. 2024 Nov 25;14(12):656.
doi: 10.3390/metabo14120656.

Longitudinal Metabolomics Reveals Metabolic Dysregulation Dynamics in Patients with Severe COVID-19

Affiliations

Longitudinal Metabolomics Reveals Metabolic Dysregulation Dynamics in Patients with Severe COVID-19

Ryo Uchimido et al. Metabolites. .

Abstract

Background/Objective: A dysregulated metabolism has been studied as a key aspect of the COVID-19 pathophysiology, but its longitudinal progression in severe cases remains unclear. In this study, we aimed to investigate metabolic dysregulation over time in patients with severe COVID-19 requiring mechanical ventilation (MV). Methods: In this single-center, prospective, observational study, we obtained 236 serum samples from 118 adult patients on MV in an ICU. The metabolite measurements were performed using capillary electrophoresis Fourier transform mass spectrometry, and we categorized the sampling time points into three time zones to align them with the disease progression: time zone 1 (T1) (the hyperacute phase, days 1-3 post-MV initiation), T2 (the acute phase, days 4-14), and T3 (the chronic phase, days 15-30). Using volcano plots and enrichment pathway analyses, we identified the differential metabolites (DMs) and enriched pathways (EPs) between the survivors and non-survivors for each time zone. The DMs and EPs were further grouped into early-stage, late-stage, and consistent groups based on the time zones in which they were detected. Results: With the 566 annotated metabolites, we identified 38 DMs and 17 EPs as the early-stage group, which indicated enhanced energy production in glucose, amino acid, and fatty acid metabolisms in non-survivors. As the late-stage group, 84 DMs and 10 EPs showed upregulated sphingolipid, taurine, and tryptophan-kynurenine metabolisms with downregulated steroid hormone synthesis in non-survivors. Three DMs and 23 EPs in the consistent group showed more pronounced dysregulation in the dopamine and arachidonic acid metabolisms across all three time zones in non-survivors. Conclusions: This study elucidated the temporal differences in metabolic dysregulation between survivors and non-survivors of severe COVID-19, offering insights into its longitudinal progression and disease mechanisms.

Keywords: longitudinal metabolic dysregulation; severe COVID-19.


Conflict of interest statement

R.U. receives research funding from Human Metabolome Technologies, Inc. The funders played roles in the data analyses and interpretation.

Figures
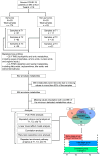
Figure 1
Figure 1
Workflow of the metabolomics analysis. N represents the number of patients, and n represents the number of samples. PLS-ROG: partial least square with ranking of groups; T1: time zone 1; T2: time zone 2; T3: time zone 3.
Figure 2
Figure 2
Partial least squares with rank order of groups (PLS−ROG) analysis revealed the association between the metabolic profiles and time−dependent subclasses. (a) PLS−ROG analysis illustrating the distribution of the first and second PLS−ROG scores for the metabolite levels as the explanatory variables in the model, with the coloring based on the ICU outcomes. (b) PLS−ROG analysis demonstrating the distribution of the first and second PLS−ROG scores, with the colors representing the time−dependent subclasses. (c,d) Box plots displaying the first and second PLS−ROG scores across the different time−dependent subclasses, respectively. (e) Dot plot with arrows showing the trajectories of the mean metabolic profiles with each time−dependent subclass.
Figure 3
Figure 3
Change in differences in metabolic dysregulation between survivors and non−survivors over time. (a) Three volcano plots displaying significantly differential metabolites (DMs) between survivors and non−survivors with the red color at each time zone, wherein each dot represents a metabolite. (b) Bar charts showing the number of DMs at each time zone: 17 in time zone 1 (T1), 74 in time zone 2 (T2), and 93 in time zone 3 (T3). (c) Venn diagram illustrating the distribution of DMs identified across different time zone combinations: only in T1; in both T1 and T2; in both T1 and T3; only in T2; in both T2 and T3; only in T3; and in all three time zones (T1, T2, and T3). (d) Bar plots presenting the number of DMs across the different time zone combinations, categorized into early−stage, late−stage, and consistent DMs. The 38 early−stage DMs were found either only in T1 (n = 6), in both T1 and T2 (n = 2), or only in T2 (n = 30); 84 late−stage DMs were identified either only in T2 (n = 38) or in both T2 and T3 (n = 46); and four consistent DMs were detected across all three time zones: T1, T2, and T3 (n = 4).
Figure 4
Figure 4
Heatmaps depicting the log2 fold changes (log2FCs) in the metabolite values when comparing non−survivors to survivors for (a) early−stage DMs (n = 38), (b) late−stage DMs (n = 84), and (c) consistent DMs (n = 4).
Figure 5
Figure 5
Time−series box plots showing the longitudinal changes in the scaled values of the early−stage differential metabolites and the temporal variation in the significant differences between the survivors and non-survivors across all three time zones. (a) The γ−glutamyl dipeptides γ−Glu−Asn, γ−Glu−Gly, and γ−Glu−Glu. (b) Metabolites related to nucleic acid metabolism, such as 3-methylcytidine, orotidine, and succinyl adenosine. (c) FA (24:5) and FA (17:3) involved in lipid metabolism. All p−values were adjusted using the Benjamini−Hochberg method. Underlined numbers met both criteria for differential metabolites: (1) a BH−adjusted p−value of <0.05 and (2) an absolute log2 fold change of >1.
Figure 6
Figure 6
Time−series box plots showing the longitudinal changes in the scaled values of the late−stage differential metabolites and the temporal variation in the significant differences between the survivors and non−survivors across all three time zones. (a) Metabolites from the kynurenine pathway, including kynurenine, kynurenic acid, anthranilic acid, 3−hydroxy kynurenine, 3−hydroxy anthranilic acid, quinolinic acid, and picolinic acid. (b) Bile acid metabolism metabolites, such as deoxycholic acid, taurine, glycodeoxycholic acid, and isochenodeoxycholic acid. (c) Hormones, including serotonin, testosterone, and corticosterone. All p−values were adjusted using the Benjamini−Hochberg method. Underlined numbers met both criteria for differential metabolites: (1) a BH−adjusted p−value of <0.05 and (2) an absolute log2 fold change of >1.
Figure 7
Figure 7
Time−series box plots showing the longitudinal changes in the scaled values of the consistent differential metabolites and the temporal variation in the significant differences between the survivors and non−survivors across all three time zones. The plots show homovanillic acid, N′−formyl kynurenine, and thromboxane B2. All p−values were adjusted using the Benjamini−Hochberg method. Underlined numbers met both criteria for differential metabolites: (1) a BH−adjusted p−value of <0.05 and (2) an absolute log2 fold change of >1.
Figure 8
Figure 8
Linear mixed models displaying the p−values of the regression coefficients for the time zones, ICU outcomes (survival or not), and interaction terms between the time zones and ICU outcomes. (a) Two early−stage differential metabolites with significant p−values for the interaction term. (b) The top five metabolites with significant p-values for the interaction term among the late−stage differential metabolites. All p−values were adjusted using the Benjamini–Hochberg method.
Figure 9
Figure 9
Correlation heatmap depicting the Spearman’s correlations between the differential metabolites and clinical laboratory data. All p−values were adjusted using the Benjamini−Hochberg method. Significance levels are indicated as follows: *** p < 0.001, ** p  < 0.01, and * p  < 0.05.
Figure 10
Figure 10
The prognostic abilities of homovanillic acid, N′-formylkynurenine, and thromboxane B2 demonstrated by the areas under the curves (AUCs) of their receiver operating characteristic (ROC) curves across all three time zones: (a) homovanillic acid AUCs: 0.87, 0.90, and 0.89; (b) N′-formylkynurenine AUCs: 0.84, 0.83, and 0.92; and (c) thromboxane B2 AUCs: 0.70, 0.77, and 0.64. (d) The logistic regression model, which incorporated these three metabolites along with the age and sex, showed AUCs of 0.89, 0.95, and 0.87 for time zones 1, 2, and 3, respectively.
Figure 11
Figure 11
Enriched pathway analysis identified metabolic pathways enriched between survivors and non-survivors in each time zone. (a) Bar charts showing the number of enriched pathways (EPs) in each time zone: 30 in time zone 1 (T1), 44 in time zone 2 (T2), and 34 in time zone 3 (T3). (b) Venn diagram illustrating the distribution of EPs identified in the different time zone combinations: only in T1; in both T1 and T2; in both T1 and T3; only in T2; in both T2 and T3; only in T3; and in all three time zones (T1, T2, and T3). (c) Bar plots presenting the numbers of EPs across the different time zone combinations, categorized into early-stage, late-stage, and consistent EPs. The 17 early-stage EPs were found only in T1 (n = 3), in both T1 and T2 (n = 3), or only in T2 (n = 11); the 10 late-stage EPs were identified only in T2 (n = 7) or in both T2 and T3 (n = 3); and the 23 consistent EPs were detected across all three time zones: T1, T2, and T3 (n = 23).
Figure 12
Figure 12
Enrichment ratios and false discovery rates of enriched pathways in early-stage, late-stage, and consistent categories. This figure was generated using MetaboAnalyst 6.0 (www.metaboanalyst.ca, accessed on 20 July 2024). Enrichment ratios were calculated as the number of observed metabolites divided by the number of expected metabolites within a specific metabolic pathway. The size of each circle represents the enrichment ratio, and the color indicates the false discovery rate.

Similar articles

References

    1. Andrade Silva M., da Silva A.R.P.A., do Amaral M.A., Fragas M.G., Câmara N.O.S. Metabolic Alterations in SARS-CoV-2 Infection and Its Implication in Kidney Dysfunction. Front. Physiol. 2021;12:624698. doi: 10.3389/fphys.2021.624698. - DOI - PMC - PubMed
    1. Ramos-Casals M., Brito-Zerón P., Mariette X. Systemic and Organ-Specific Immune-Related Manifestations of COVID-19. Nat. Rev. Rheumatol. 2021;17:315–332. doi: 10.1038/s41584-021-00608-z. - DOI - PMC - PubMed
    1. Vincent J.-L. COVID-19: It’s All about Sepsis. Future Microbiol. 2021;16:131–133. doi: 10.2217/fmb-2020-0312. - DOI - PMC - PubMed
    1. Zaim S., Chong J.H., Sankaranarayanan V., Harky A. COVID-19 and Multiorgan Response. Curr. Probl. Cardiol. 2020;45:100618. doi: 10.1016/j.cpcardiol.2020.100618. - DOI - PMC - PubMed
    1. Termorshuizen F., Dongelmans D.A., Brinkman S., Bakhshi-Raiez F., Arbous M.S., de Lange D.W., van Bussel B.C.T., de Keizer N.F. Dutch COVID-19 Research Consortium Characteristics and Outcome of COVID-19 Patients Admitted to the ICU: A Nationwide Cohort Study on the Comparison between the Consecutive Stages of the COVID-19 Pandemic in the Netherlands, an Update. Ann. Intensive Care. 2024;14:11. doi: 10.1186/s13613-023-01238-2. - DOI - PMC - PubMed

LinkOut - more resources