

Transcriptomic Profiling Reveals Altered Expression of Genes Involved in Metabolic and Immune Processes in NDV-Infected Chicken Embryos
- PMID: 39728450
- PMCID: PMC11678133
- DOI: 10.3390/metabo14120669
Transcriptomic Profiling Reveals Altered Expression of Genes Involved in Metabolic and Immune Processes in NDV-Infected Chicken Embryos
Abstract
Objective: The poultry industry is significantly impacted by viral infections, particularly Newcastle Disease Virus (NDV), which leads to substantial economic losses. It is essential to comprehend how the sequence of development affects biological pathways and how early exposure to infections might affect immune responses.
Methods: This study employed transcriptome analysis to investigate host-pathogen interactions by analyzing gene expression changes in NDV-infected chicken embryos' lungs.
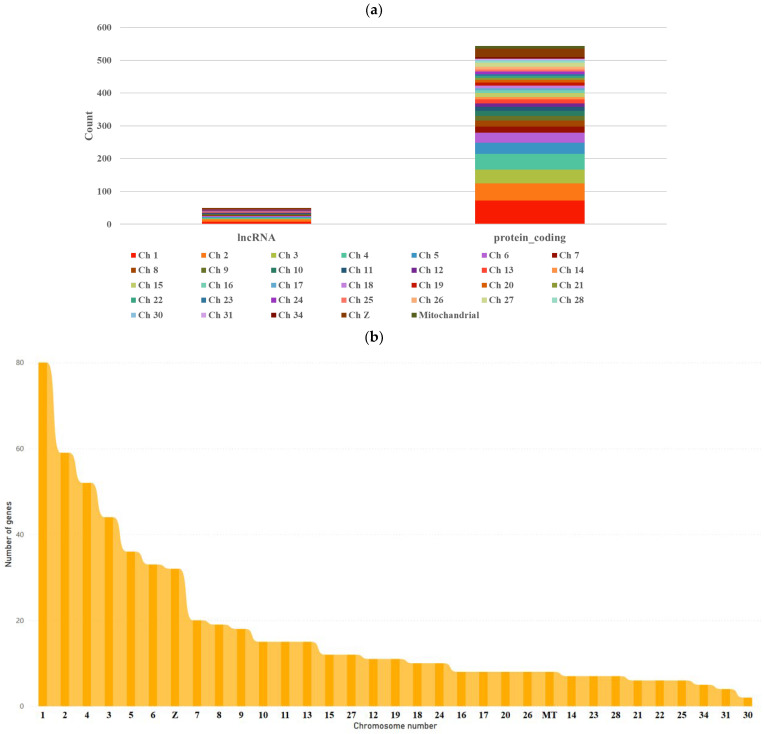
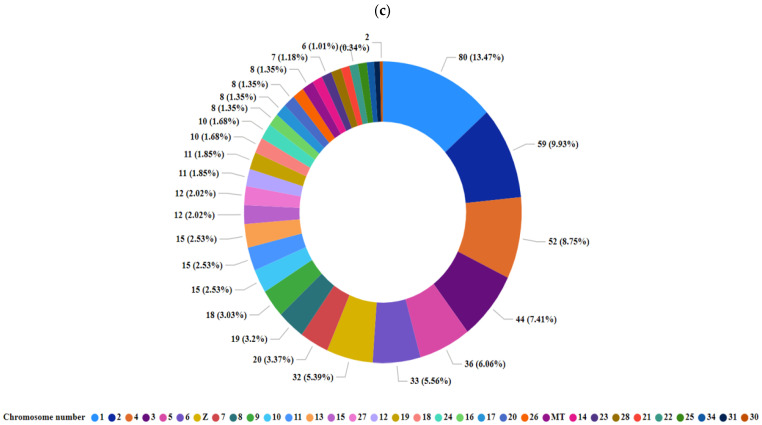
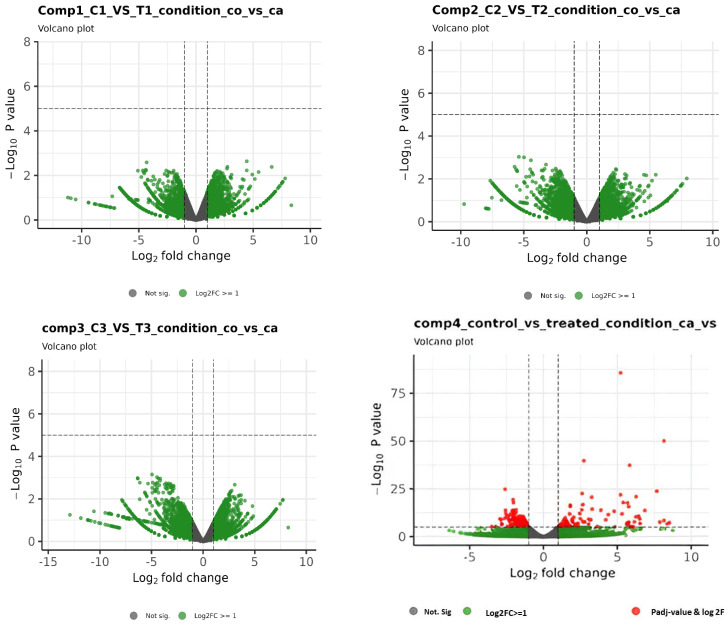
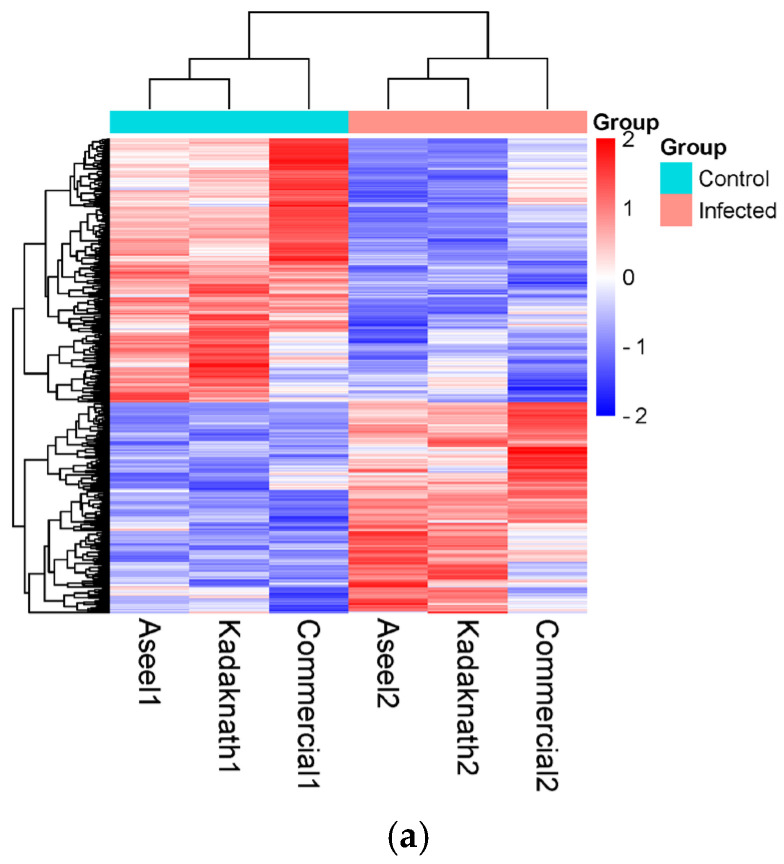
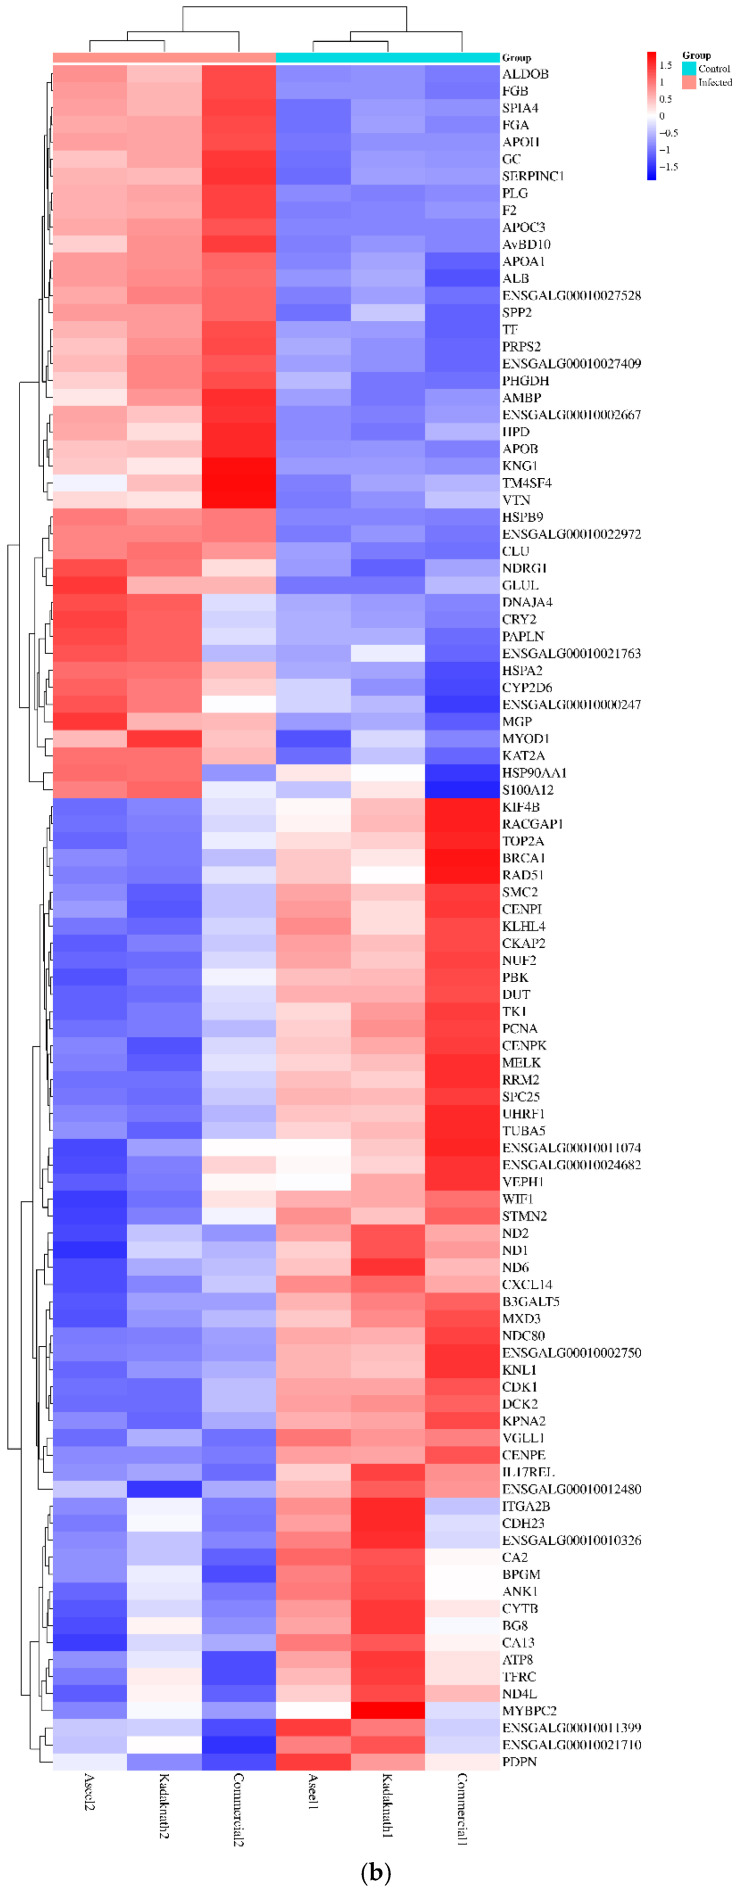
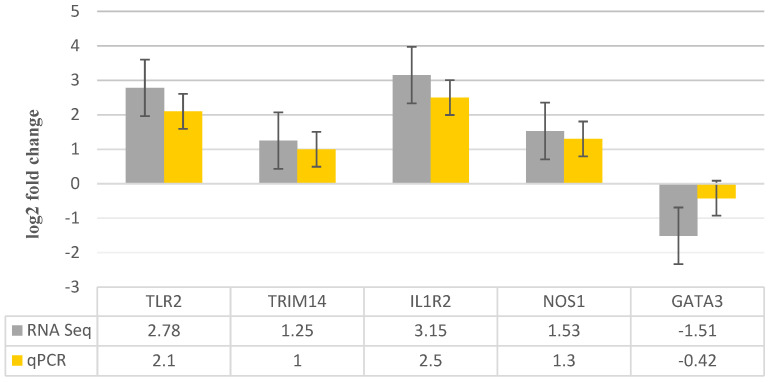
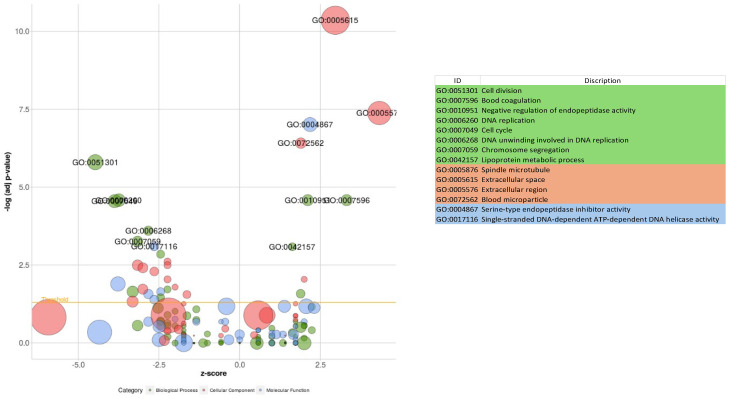
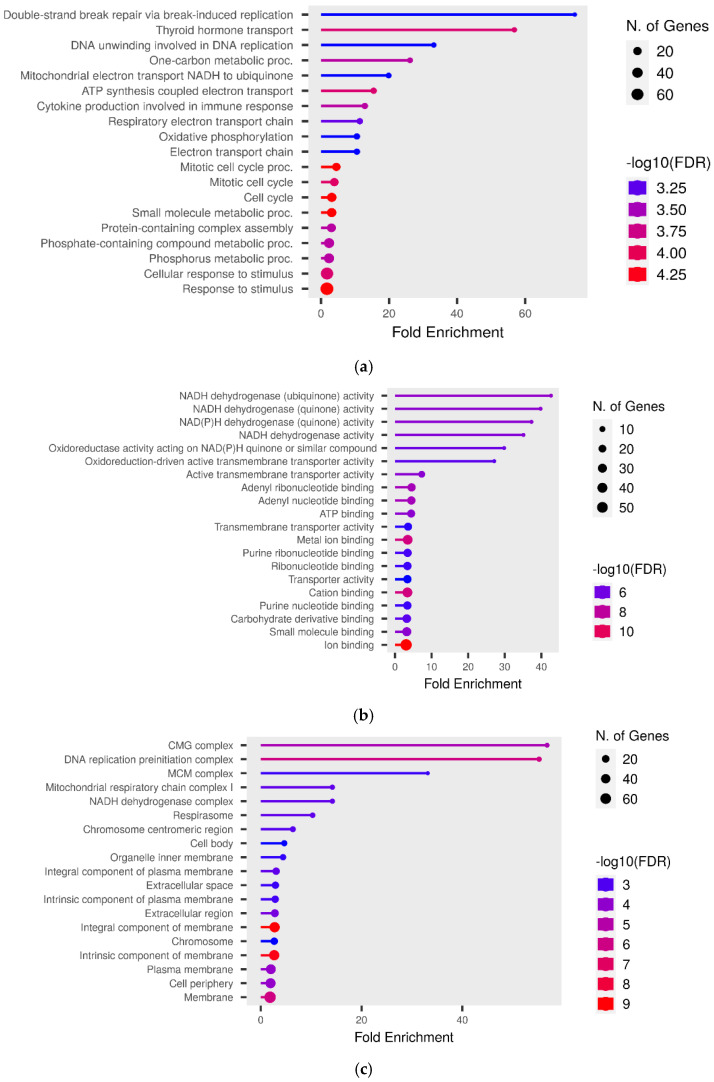
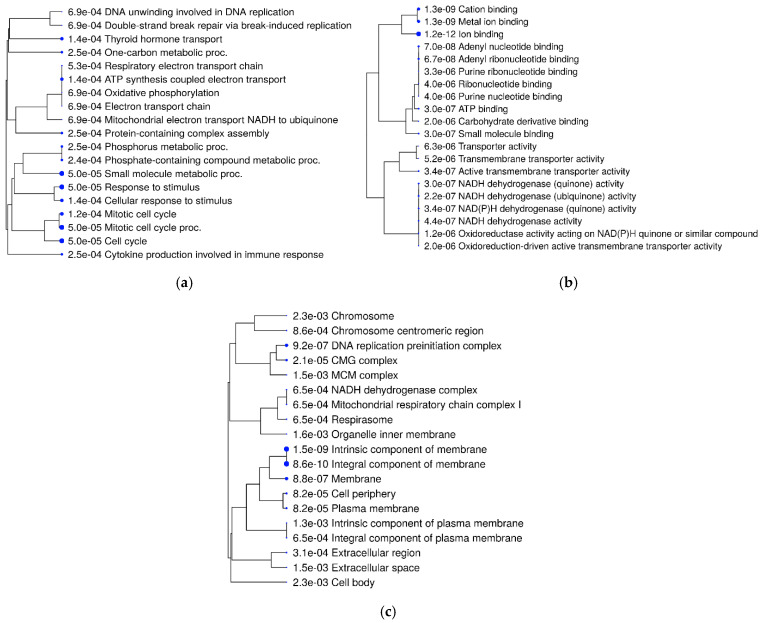
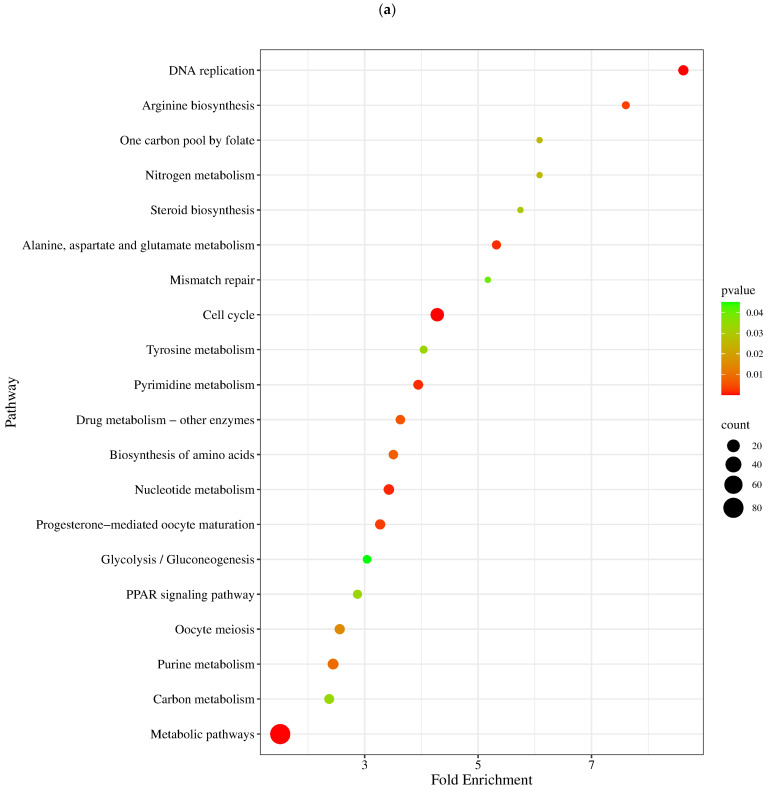
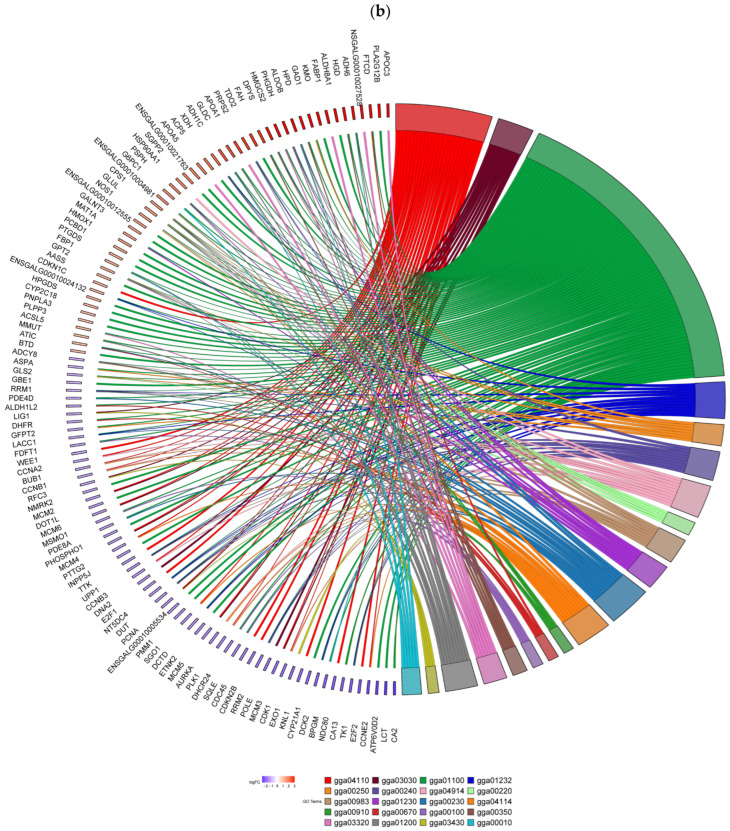
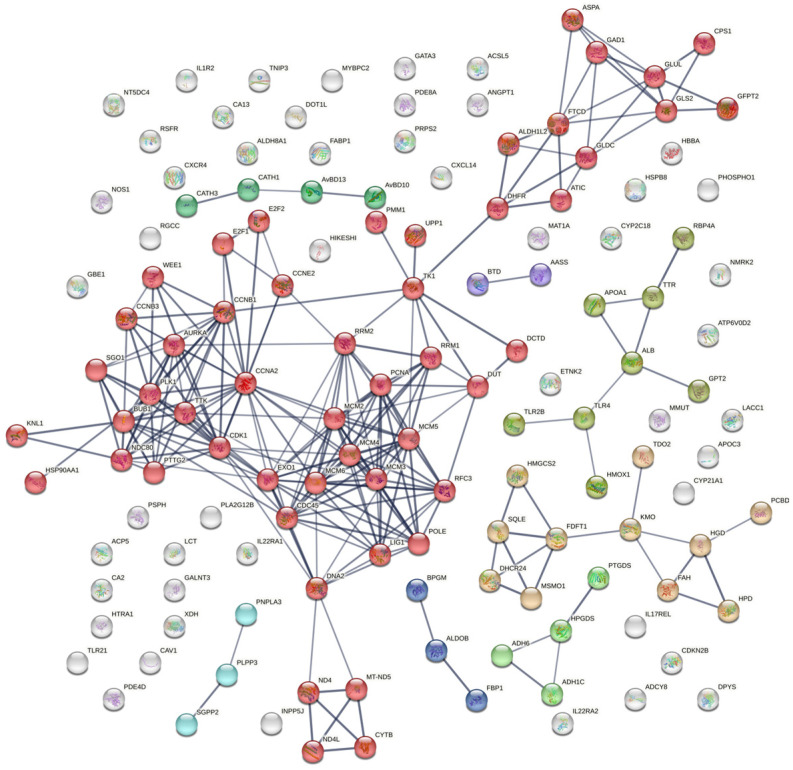
Result: RNA-Seq reads were aligned with the chicken reference genome (Galgal7), revealing 594 differentially expressed genes: 264 upregulated and 330 downregulated. The most overexpressed genes, with logFC between 8.15 and 8.75, included C8A, FGG, PIT54, FETUB, APOC3, and FGA. Notably, downregulated genes included BPIFB3 (-4.46 logFC) and TRIM39.1 (-4.26 logFC). The analysis also identified 29 novel transcripts and 20 lncRNAs that were upregulated. Gene Ontology and KEGG pathways' analyses revealed significant alterations in gene expression related to immune function, metabolism, cell cycle, nucleic acid processes, and mitochondrial activity due to NDV infection. Key metabolic genes, such as ALDOB (3.27 logFC), PRPS2 (2.66 logFC), and XDH (2.15 logFC), exhibited altered expression patterns, while DCK2 (-1.99 logFC) and TK1 (-2.11 logFC) were also affected. Several immune-related genes showed significant upregulation in infected lung samples, including ALB (6.15 logFC), TLR4 (1.86 logFC), TLR2 (2.79 logFC), and interleukin receptors, such as IL1R2 (3.15 logFC) and IL22RA2 (1.37 logFC). Conversely, genes such as CXCR4 (-1.49 logFC), CXCL14 (-2.57 logFC), GATA3 (-1.51 logFC), and IL17REL (-2.93 logFC) were downregulated. The higher expression of HSP genes underscores their vital role in immune responses.
Conclusion: Comprehension of these genes' interactions is essential for regulating viral replication and immune responses during infections, potentially aiding in the identification of candidate genes for poultry breed improvement amidst NDV challenges.
Keywords: ALDOB; APOC3; BPI; NDV; TRIM3 HSP; chicken; immune genes; metabolic genes.
Conflict of interest statement
The authors declare that the research was conducted in the absence of any commercial or financial relationships that could be construed as a potential conflict of interest.
Figures
Similar articles
-
Transcriptomic analysis of chicken immune response to infection of different doses of Newcastle disease vaccine.Gene. 2021 Jan 15;766:145077. doi: 10.1016/j.gene.2020.145077. Epub 2020 Sep 14. Gene. 2021. PMID: 32941951
-
Integrative study of chicken lung transcriptome to understand the host immune response during Newcastle disease virus challenge.Front Cell Infect Microbiol. 2024 Sep 3;14:1368887. doi: 10.3389/fcimb.2024.1368887. eCollection 2024. Front Cell Infect Microbiol. 2024. PMID: 39290979 Free PMC article.
-
Deep Sequencing-Based Transcriptome Profiling Reveals Avian Interferon-Stimulated Genes and Provides Comprehensive Insight into Newcastle Disease Virus-Induced Host Responses.Viruses. 2018 Mar 30;10(4):162. doi: 10.3390/v10040162. Viruses. 2018. PMID: 29601508 Free PMC article.
-
Breed and timepoint-based analysis of chicken harderian gland transcriptome during Newcastle disease virus challenge.Front Mol Biosci. 2024 Jun 10;11:1365888. doi: 10.3389/fmolb.2024.1365888. eCollection 2024. Front Mol Biosci. 2024. PMID: 38915939 Free PMC article.
-
Immune responses of poultry to Newcastle disease virus.Dev Comp Immunol. 2013 Nov;41(3):447-53. doi: 10.1016/j.dci.2013.04.012. Epub 2013 Apr 25. Dev Comp Immunol. 2013. PMID: 23623955 Review.
References
-
- Wang Y., Saelao P., Chanthavixay G., Gallardo R.A., Wolc A., Fulton J.E., Dekkers J.M., Lamont S.J., Kelly T.R., Zhou H. Genomic Regions and Candidate Genes Affecting Response to Heat Stress with Newcastle Virus Infection in Commercial Layer Chicks Using Chicken 600K Single Nucleotide Polymorphism Array. Int. J. Mol. Sci. 2024;25:2640. doi: 10.3390/ijms25052640. - DOI - PMC - PubMed
-
- DAHD Animal Husbandry Statistics (AHS) [(accessed on 19 October 2024)]; Available online: https://dahd.gov.in/schemes/programmes/animal-husbandry-statistics.
-
- Food and Agriculture Organization of the United Nations Production|Gateway to Poultry Production and Products. [(accessed on 19 October 2024)]. Available online: https://www.fao.org/poultry-production-products/production/en/
-
- Jaynudin K., Joshi B., Mathakiya R., Prajapati K., Sipai S. Economic Impact of Genotype-Xiii Newcastle Disease Virus Infection on Commercial Vaccinated Layer Farms in India. Int. J. Livest. Res. 2018;8:280–288. doi: 10.5455/ijlr.20170820030455. - DOI
-
- Sharma R., Saran S., Yadav A.S., Kumar S., Verma M.R., Kumar D., Tyagi J.S. Economic Losses Due to Newcastle Disease in Layers in Subtropical India. Indian J. Anim. Sci. 2023;93:422–426. doi: 10.56093/ijans.v93i5.132229. - DOI
LinkOut - more resources
Full Text Sources
Miscellaneous
