

Comprehensive Blood Metabolome and Exposome Analysis, Annotation, and Interpretation in E-Waste Workers
- PMID: 39728452
- PMCID: PMC11677618
- DOI: 10.3390/metabo14120671
Comprehensive Blood Metabolome and Exposome Analysis, Annotation, and Interpretation in E-Waste Workers
Abstract
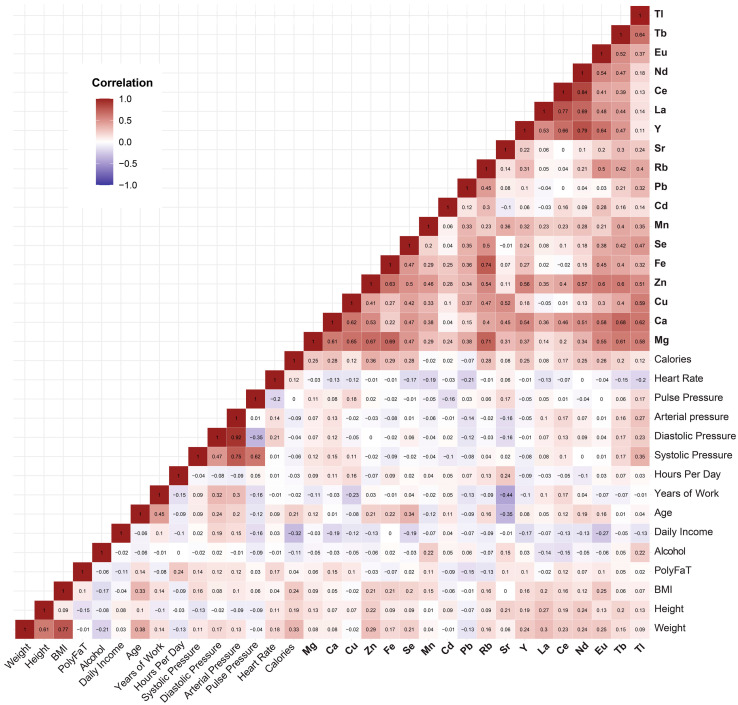
Background: Electronic and electrical waste (e-waste) production has emerged to be of global environmental public health concern. E-waste workers, who are frequently exposed to hazardous chemicals through occupational activities, face considerable health risks. Methods: To investigate the metabolic and exposomic changes in these workers, we analyzed whole blood samples from 100 male e-waste workers and 49 controls from the GEOHealth II project (2017-2018 in Accra, Ghana) using LC-MS/MS. A specialized computational workflow was established for exposomics data analysis, incorporating two curated reference libraries for metabolome and exposome profiling. Two feature detection algorithms, asari and centWave, were applied. Results: In comparison to centWave, asari showed better sensitivity in detecting MS features, particularly at trace levels. Principal component analysis demonstrated distinct metabolic profiles between e-waste workers and controls, revealing significant disruptions in key metabolic pathways, including steroid hormone biosynthesis, drug metabolism, bile acid biosynthesis, vitamin metabolism, and prostaglandin biosynthesis. Correlation analyses linked metal exposures to alterations in hundreds to thousands of metabolic features. Functional enrichment analysis highlighted significant perturbations in pathways related to liver function, vitamin metabolism, linoleate metabolism, and dynorphin signaling, with the latter being observed for the first time in e-waste workers. Conclusions: This study provides new insights into the biological impact of prolonged metal exposure in e-waste workers.
Keywords: e-waste; exposomics; mass spectrometry; metabolomics; metals.
Conflict of interest statement
J. Xia is the founder of XiaLab Analytics. The authors declare that there are no conflicts of interest.
Figures


Similar articles
-
HBM4EU E-waste study - An untargeted metabolomics approach to characterize metabolic changes during E-waste recycling.Environ Int. 2025 Feb;196:109281. doi: 10.1016/j.envint.2025.109281. Epub 2025 Jan 16. Environ Int. 2025. PMID: 39842165
-
Pilot study on the internal exposure to heavy metals of informal-level electronic waste workers in Agbogbloshie, Accra, Ghana.Environ Sci Pollut Res Int. 2017 Jan;24(3):3097-3107. doi: 10.1007/s11356-016-8002-5. Epub 2016 Nov 17. Environ Sci Pollut Res Int. 2017. PMID: 27858271
-
The Minderoo-Monaco Commission on Plastics and Human Health.Ann Glob Health. 2023 Mar 21;89(1):23. doi: 10.5334/aogh.4056. eCollection 2023. Ann Glob Health. 2023. PMID: 36969097 Free PMC article. Review.
-
A review of environmental metabolism disrupting chemicals and effect biomarkers associating disease risks: Where exposomics meets metabolomics.Environ Int. 2022 Jan;158:106941. doi: 10.1016/j.envint.2021.106941. Epub 2021 Oct 22. Environ Int. 2022. PMID: 34689039 Review.
-
Multi-trace element levels and arsenic speciation in urine of e-waste recycling workers from Agbogbloshie, Accra in Ghana.Sci Total Environ. 2012 May 1;424:63-73. doi: 10.1016/j.scitotenv.2012.02.072. Epub 2012 Mar 24. Sci Total Environ. 2012. PMID: 22446112
Cited by
-
Integrative Modeling of Urinary Metabolomics and Metal Exposure Reveals Systemic Impacts of Electronic Waste in Exposed Populations.Metabolites. 2025 Jul 5;15(7):456. doi: 10.3390/metabo15070456. Metabolites. 2025. PMID: 40710556 Free PMC article.
References
-
- Borroni E., Frigerio G., Polledri E., Mercadante R., Maggioni C., Fedrizzi L., Pesatori A.C., Fustinoni S., Carugno M. Metabolomic profiles in night shift workers: A cross-sectional study on hospital female nurses. Front. Public Health. 2023;11:1082074. doi: 10.3389/fpubh.2023.1082074. - DOI - PMC - PubMed
Grants and funding
- 1U2RTW010110-01/5U01TW010101/1/2-The West Africa-Michigan CHARTER in GEOHealth with funding from the United States Na-tional Institutes of Health/Fogarty International Center (US NIH/FIC)
- 108121-001/Canada's International Development Research Center (IDRC)
- N/A/Genome Canada
- N/A/Canadian Foundation for Innovation (CFI)
- N/A/Natural Sciences and Engineering Research Council of Canada (NSERC)
LinkOut - more resources
Full Text Sources
Medical
