

Integrative Metagenomic Analyses Reveal Gut Microbiota-Derived Multiple Hits Connected to Development of Diabetes Mellitus
- PMID: 39728500
- PMCID: PMC11677966
- DOI: 10.3390/metabo14120720
Integrative Metagenomic Analyses Reveal Gut Microbiota-Derived Multiple Hits Connected to Development of Diabetes Mellitus
Abstract
Background/objectives: Type 2 diabetes mellitus (T2DM) is a chronic metabolic disorder associated with gut dysbiosis. To investigate the association between gut microbiota and T2DM in a Saudi Arabian population.
Methods: We conducted a comparative analysis of fecal microbiota from 35 individuals, including both T2DM patients and healthy controls. 16S rRNA gene sequencing was employed to characterize the microbial community structure.
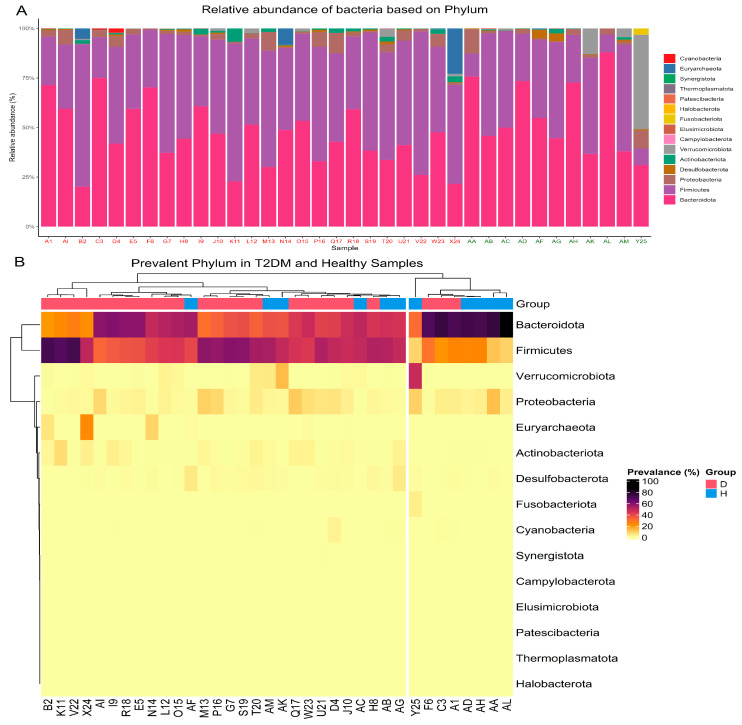
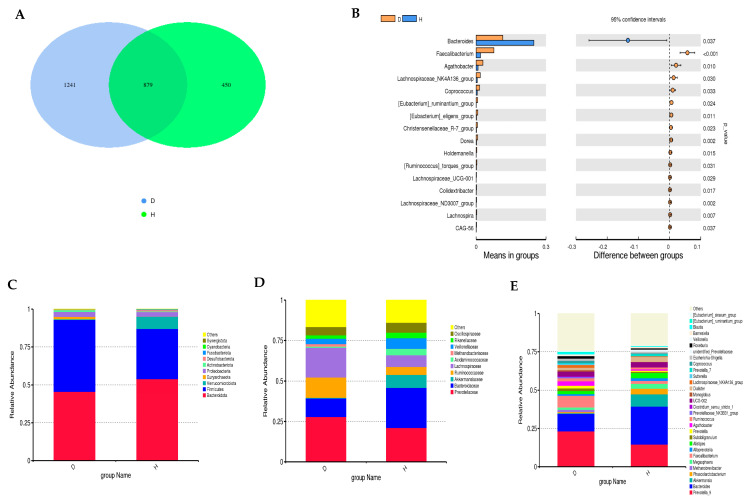
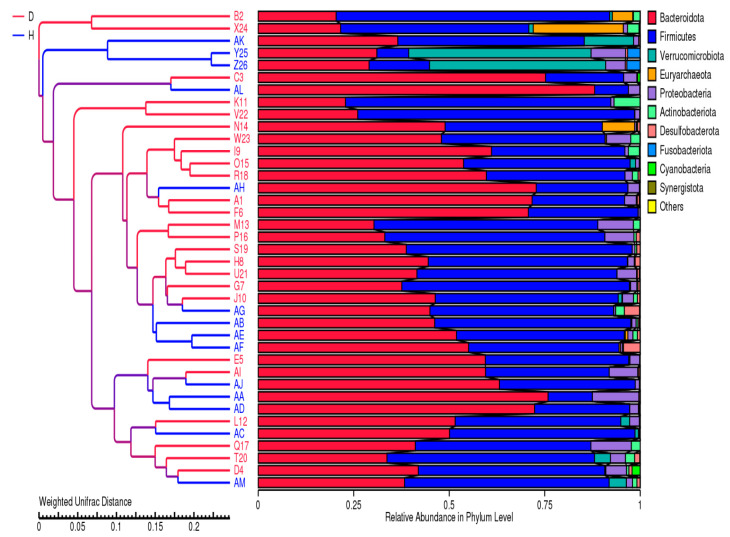
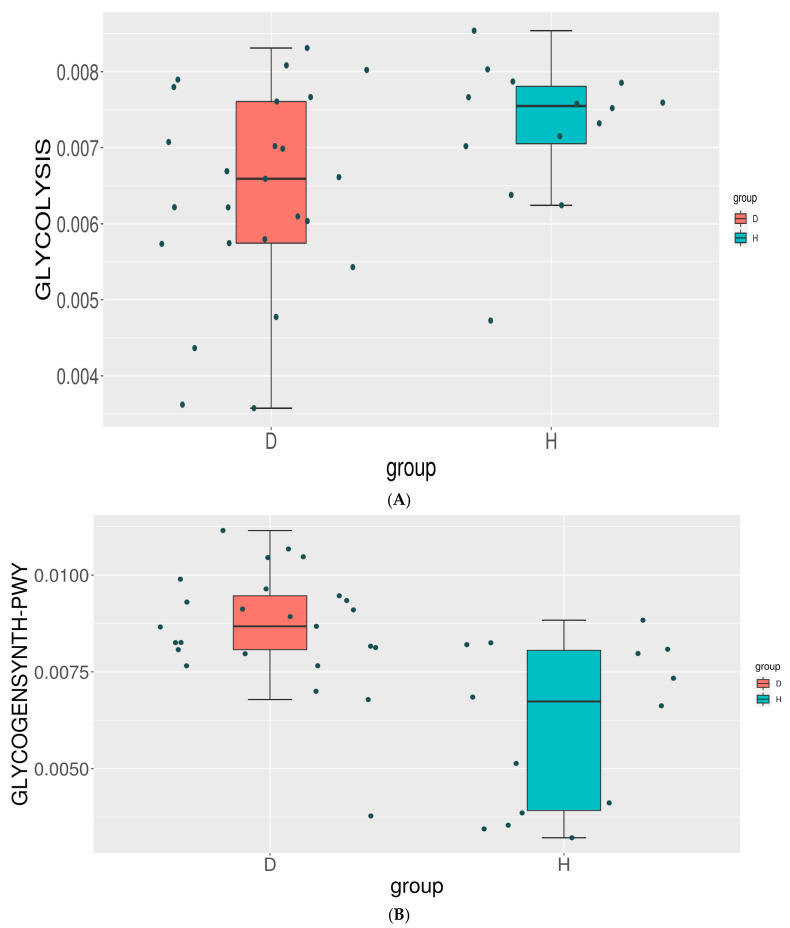
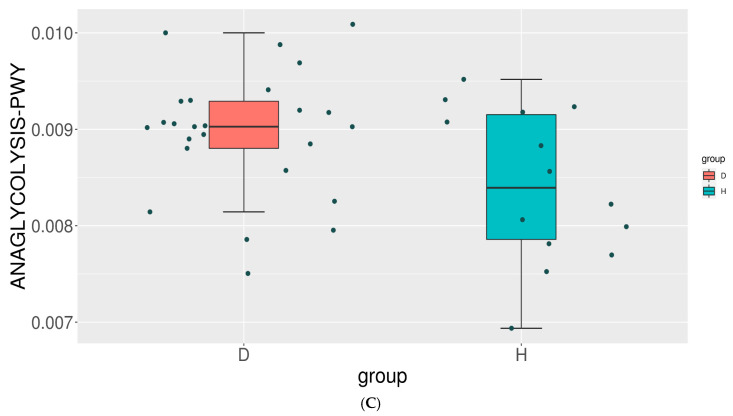
Results: Our findings revealed significant differences in microbial composition between the two groups. The T2DM group exhibited a higher abundance of Firmicutes and lower levels of Bacteroidetes compared to the healthy control group. At the genus level, T2DM patients showed a decrease in butyrate-producing bacteria such as Bacteroides and Akkermansia, while an increase in Ruminococcus and Prevotella was observed. Additionally, the T2DM group had a higher abundance of Faecalibacterium, Agathobacter, and Lachnospiraceae, along with a lower abundance of Bacteroides.
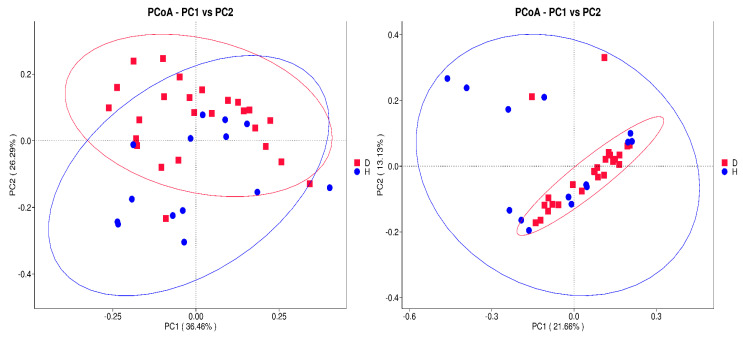
Conclusions: These results suggest that alterations in gut microbiota composition may contribute to the development of T2DM in the Saudi Arabian population. Further large-scale studies are needed to validate these findings and explore potential therapeutic interventions targeting the gut microbiome.
Keywords: 16S rRNA sequencing; T2DM; function of gut microbiota; gut microbiome; gut microbiota; gut microbiota dysbiosis; metabolic disorder; metagenomics; microbial composition; type 2 diabetes.
Conflict of interest statement
The authors declare no conflicts of interest.
Figures
Similar articles
-
Alterations in the Gut Microbiota in Pregnant Women with Pregestational Type 2 Diabetes Mellitus.mSystems. 2023 Apr 27;8(2):e0114622. doi: 10.1128/msystems.01146-22. Epub 2023 Feb 28. mSystems. 2023. PMID: 36853013 Free PMC article.
-
Exploring the associations between gut microbiota composition and SARS-CoV-2 inactivated vaccine response in mice with type 2 diabetes mellitus.mSphere. 2024 Sep 25;9(9):e0038024. doi: 10.1128/msphere.00380-24. Epub 2024 Aug 27. mSphere. 2024. PMID: 39189780 Free PMC article.
-
Alterations in the Gut Microbiota Composition in Obesity with and without Type 2 Diabetes: A Pilot Study.Diabetes Metab Syndr Obes. 2024 Oct 24;17:3965-3974. doi: 10.2147/DMSO.S477494. eCollection 2024. Diabetes Metab Syndr Obes. 2024. PMID: 39469300 Free PMC article.
-
A systematic review on gut microbiota in type 2 diabetes mellitus.Front Endocrinol (Lausanne). 2025 Jan 17;15:1486793. doi: 10.3389/fendo.2024.1486793. eCollection 2024. Front Endocrinol (Lausanne). 2025. PMID: 39897957 Free PMC article.
-
Gut Microbiota and Its Repercussion in Parkinson's Disease: A Systematic Review in Occidental Patients.Neurol Int. 2023 Jun 13;15(2):750-763. doi: 10.3390/neurolint15020047. Neurol Int. 2023. PMID: 37368331 Free PMC article. Review.
References
-
- Larsen N., Vogensen F.K., Van Den Berg F.W.J., Nielsen D.S., Andreasen A.S., Pedersen B.K., Al-Soud W.A., Sørensen S.J., Hansen L.H., Jakobsen M. Gut microbiota in human adults with type 2 diabetes differs from non-diabetic adults. PLoS ONE. 2010;5:e9085. doi: 10.1371/journal.pone.0009085. - DOI - PMC - PubMed
LinkOut - more resources
Full Text Sources
