. 2024 Dec 14;14(24):2010.
doi: 10.3390/nano14242010.

Carbapenem-Resistant E. coli Adherence to Magnetic Nanoparticles

Affiliations

Carbapenem-Resistant E. coli Adherence to Magnetic Nanoparticles

Oznur Caliskan-Aydogan et al. Nanomaterials (Basel). .

Abstract

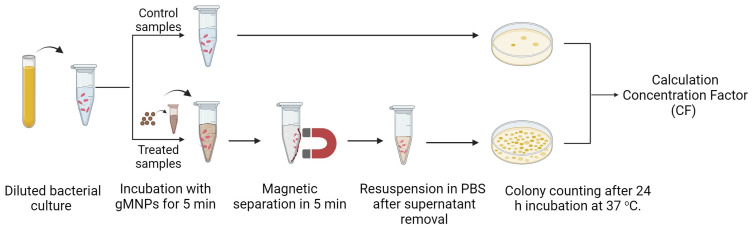
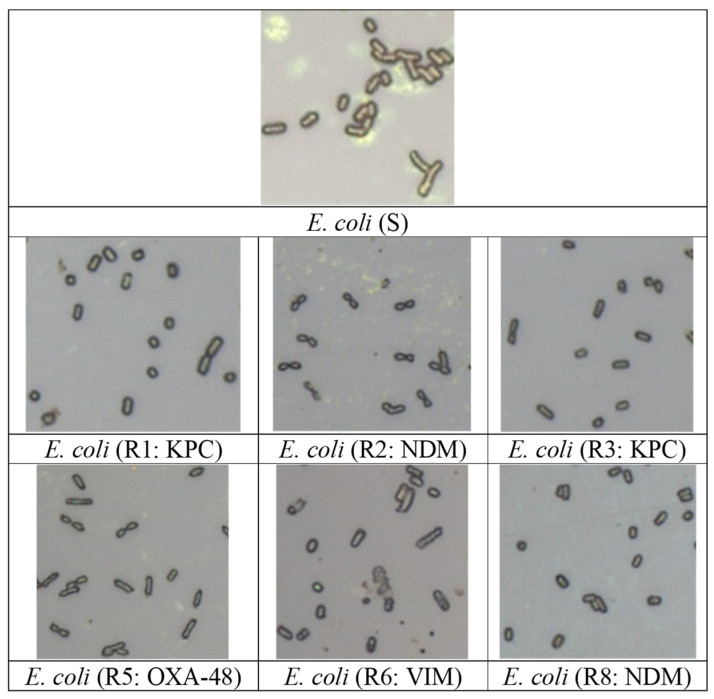
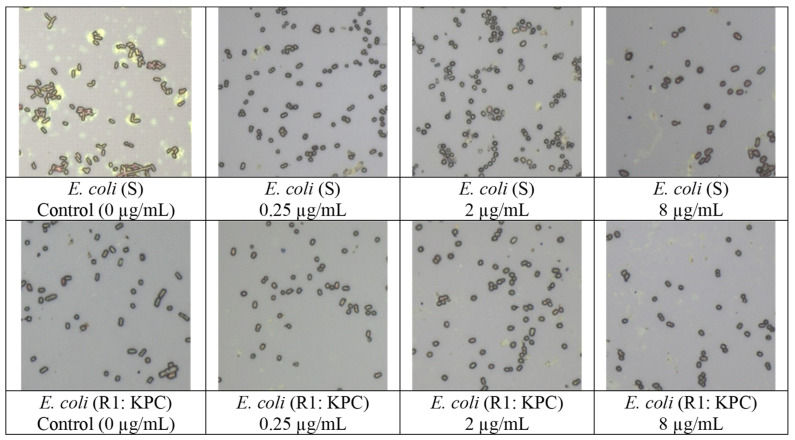
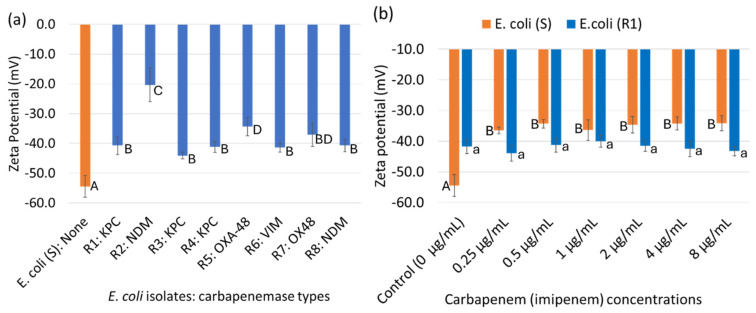
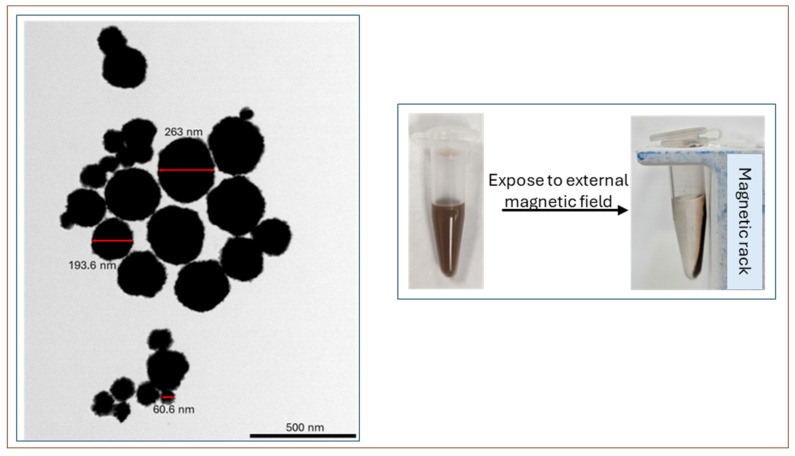
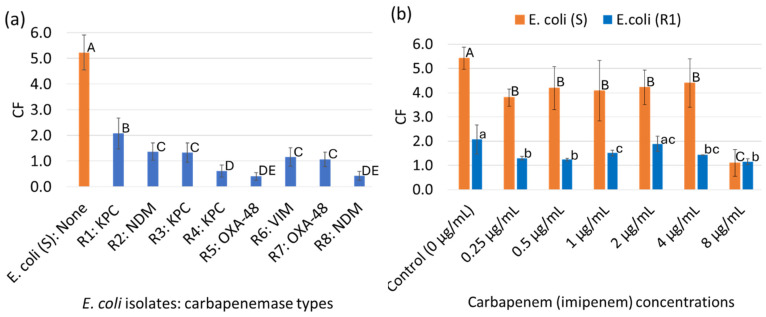
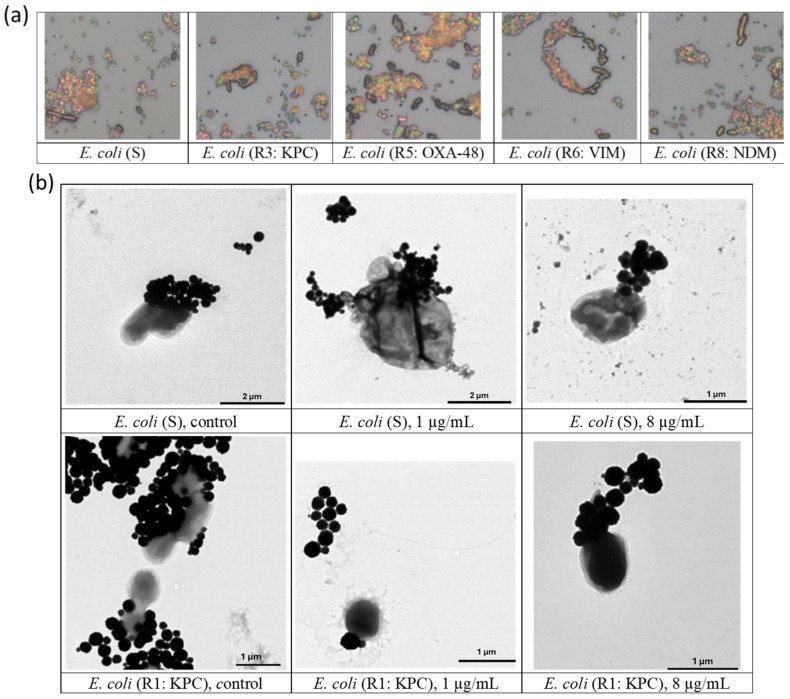
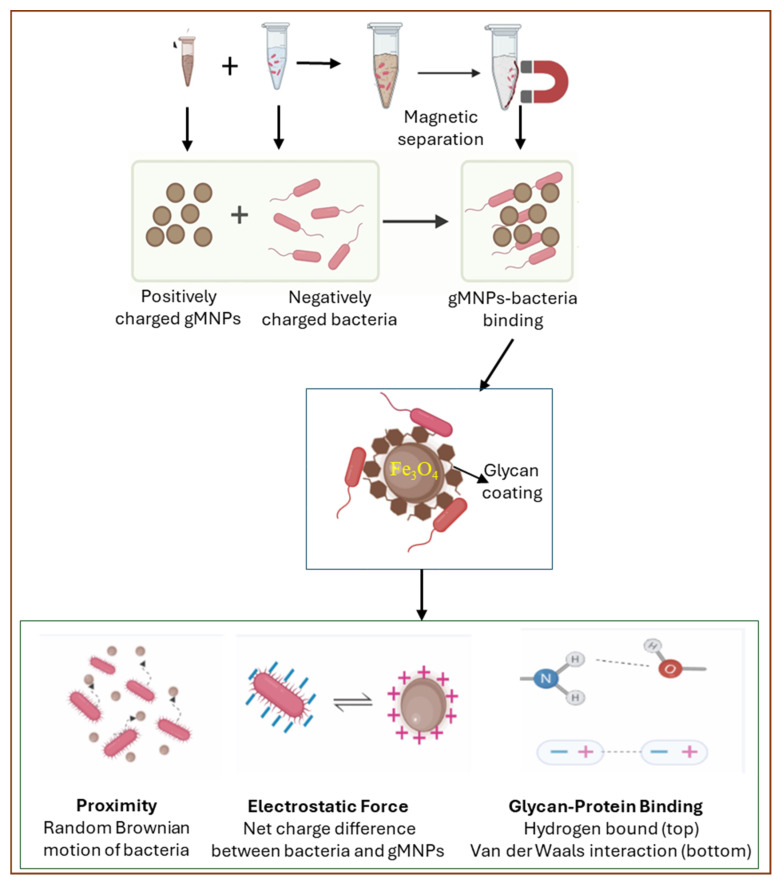
Carbapenem-resistant Enterobacterales (CRE) is an emerging global concern. Specifically, carbapenemase-producing (CP) E. coli strains in CRE have recently been found in clinical, environmental, and food samples worldwide, causing many hospitalizations and deaths. Their rapid identification and characterization are paramount in control, management options, and treatment choices. Thus, this study aimed to characterize the cell surface properties of carbapenem-resistant (R) E. coli isolates and their interaction with glycan-coated magnetic nanoparticles (gMNPs) compared with carbapenem-susceptible (S) E coli. This study used two groups of bacteria: The first group included E. coli (R) isolates harboring carbapenemases and had no antibiotic exposure. Their initial gMNP-cell binding capacity, with cell surface characteristics, was assessed. In the second group, one of the E. coli (R) isolates and E. coli (S) had long-term serial antibiotic exposure, which we used to observe their cell surface characteristics and gMNP interactions. Initially, cell surface characteristics (cell morphology and cell surface charge) of the E. coli isolates were evaluated using confocal laser scanning microscope (LSCM) and a Zetasizer, respectively. The interaction of gMNPs with the E. coli isolates was assessed through LSCM and transmission electron microscope (TEM). Further, the gMNP-cell attachment was quantified as a concentration factor (CF) through the standard plating method. The results showed that the CF values of all E. coli (R) were significantly different from those of E. coli (S), which could be due to the differences in cell characteristics. The E. coli (R) isolates displayed heterogeneous cell shapes (rod and round cells) and lower negative zeta potential (cell surface charge) values compared to E. coli (S). Further, this research identified the differences in the cell surface characteristics of E. coli (S) under carbapenem exposure, compared to unexposed E. coli (S) that impact their attachment capacity. The gMNPs captured more E. coli (S) cells compared to carbapenem-exposed E. coli (S) and all E. coli (R) isolates. This study clearly found that differences in cell surface characteristics impact their interaction with magnetic nanoparticles. The gained insights aid in further understanding adhesion mechanisms to develop or improve bacterial isolation techniques and diagnostic and treatment methods for CRE.

Keywords: CRE; MNP–cell interaction; cell morphology; gMNP; rapid isolation; surface charge.


Conflict of interest statement

The authors declare no conflicts of interest.

Figures

Scheme 1
Scheme 1
The procedure of gMNP–bacteria attachment capacity (created with BioRender.com, accessed on 10 November 2022).
Figure 1
Figure 1
LSCM images of carbapenem-susceptible E. coli (S) and carbapenem-resistant E. coli (R) isolates harboring carbapenemases without carbapenem exposure (group 1).
Figure 2
Figure 2
LSCM images of the carbapenem-exposed and unexposed E. coli (S) and E. coli (R1: KPC) cells at low, medium, and high- concentrations at the end of 30 serial growth cycles (group 2).
Figure 3
Figure 3
The mean zeta potential values of two groups of bacteria with standard deviations (N:27): (a) E. coli (S) and E. coli (R) isolates harboring carbapenemases, without carbapenem exposure (group 1) (capital letters represent statistical results) and (b) the long-term carbapenem-exposed and unexposed (control) E. coli (S) and E. coli (R1: KPC) at low, medium, and high concentrations (group 2) (letters represent statistical results: capital letters for comparison with E. coli (S) cells and lowercase letters for comparison with E. coli (R1: KPC) cells). Different letters above the bars denote significant difference (p < 0.05), and the same letter denotes no significant difference.
Figure 4
Figure 4
Characterization of synthesized gMNPs: TEM micrograph of gMNPs (left) and visualization of superparamagnetic properties of gMNPs under external magnet (right).
Figure 5
Figure 5
The gMNP–bacterial cell binding capacity, the average concentration factor (CF), of two groups of bacteria with standard deviations (N:18): (a) CF of E. coli (S) and E. coli (R) isolates harboring carbapenemases, without carbapenem exposure (group 1) (capital letters represent statistical results) and (b) the CF of the long-term carbapenem-exposed and unexposed (control) E. coli (S) and E. coli (R1:KPC) at low, medium, and high concentrations (group 2) (letters represent statistical results (capital letters for comparison of E. coli (S) cells and lowercase letters for comparison of E. coli (R1:KPC) cells). Different letters above the bars denote significant difference (p < 0.05), and the same letter denotes no significant difference.
Figure 6
Figure 6
Microscopic images of gMNP–cell interaction of two groups of bacteria, which were obtained in the presence of gMNPs: (a) LSCM images showing the interaction of gMNPs with E. coli (S) and E. coli (R) isolates harboring carbapenemases, without carbapenem exposure (group 1) and (b) TEM images showing the interaction of gMNPs with long-term carbapenem-exposed and unexposed (control) E. coli (S) and E. coli (R1: KPC) cells at medium and high concentrations (group 2).
Scheme 2
Scheme 2
Demonstration of the hypothesis of the gMNP–bacteria attachment mechanism (created with BioRender.com, accessed in 2 November 2023), which was adapted from a study [28].

Similar articles

References

    1. Wellington E.M.H., Boxall A.B.A., Cross P., Feil E.J., Gaze W.H., Hawkey P.M., Johnson-Rollings A.S., Jones D.L., Lee N.M., Otten W., et al. The Role of the Natural Environment in the Emergence of Antibiotic Resistance in Gram-Negative Bacteria. Lancet Infect. Dis. 2013;13:155–165. doi: 10.1016/S1473-3099(12)70317-1. - DOI - PubMed
    1. Caliskan-Aydogan O., Alocilja E.C. A Review of Carbapenem Resistance in Enterobacterales and Its Detection Techniques. Microorganisms. 2023;11:1491. doi: 10.3390/microorganisms11061491. - DOI - PMC - PubMed
    1. Gullberg E., Cao S., Berg O.G., Ilbäck C., Sandegren L., Hughes D., Andersson D.I. Selection of Resistant Bacteria at Very Low Antibiotic Concentrations. PLoS Pathog. 2011;7:e1002158. doi: 10.1371/journal.ppat.1002158. - DOI - PMC - PubMed
    1. Serwecińska L. Antimicrobials and Antibiotic-Resistant Bacteria: A Risk to the Environment and to Public Health. Water. 2020;12:3313. doi: 10.3390/w12123313. - DOI
    1. Sandegren L. Selection of Antibiotic Resistance at Very Low Antibiotic Concentrations. Upsala J. Med. Sci. 2014;119:103–107. doi: 10.3109/03009734.2014.904457. - DOI - PMC - PubMed

LinkOut - more resources