. 2024 Dec 2;7(6):97.
doi: 10.3390/mps7060097.

Energy-Resolved Mass Spectrometry and Mid-Infrared Spectroscopy for Purity Assessment of a Synthetic Peptide Cyclised by Intramolecular Huisgen Click Chemistry

Affiliations

Energy-Resolved Mass Spectrometry and Mid-Infrared Spectroscopy for Purity Assessment of a Synthetic Peptide Cyclised by Intramolecular Huisgen Click Chemistry

Alicia Maroto et al. Methods Protoc. .

Abstract

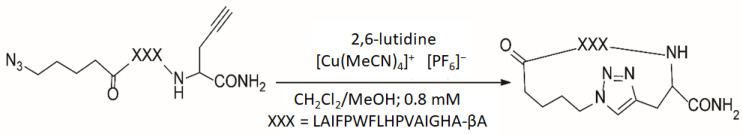
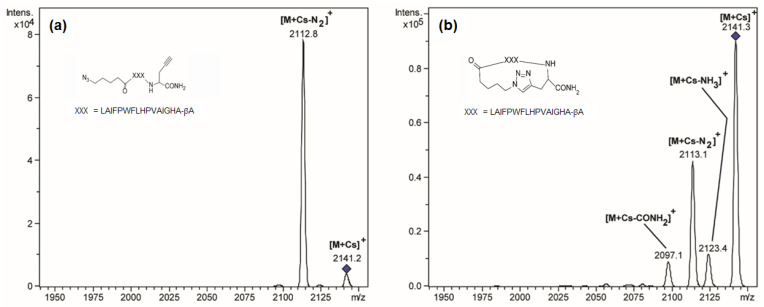
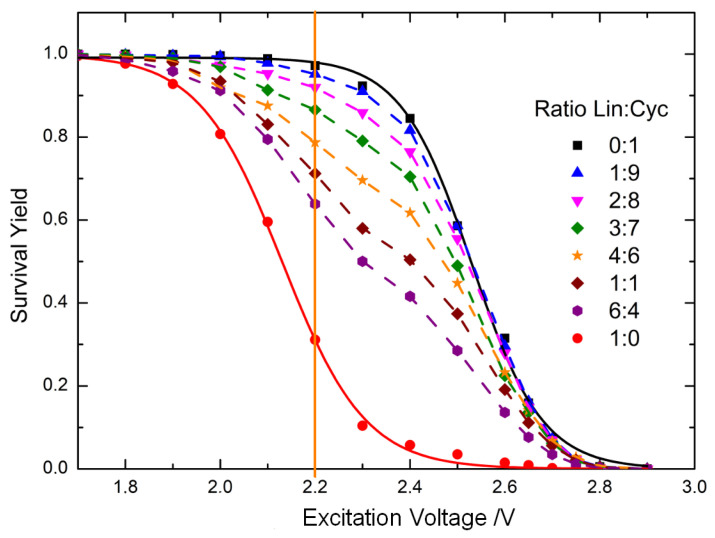
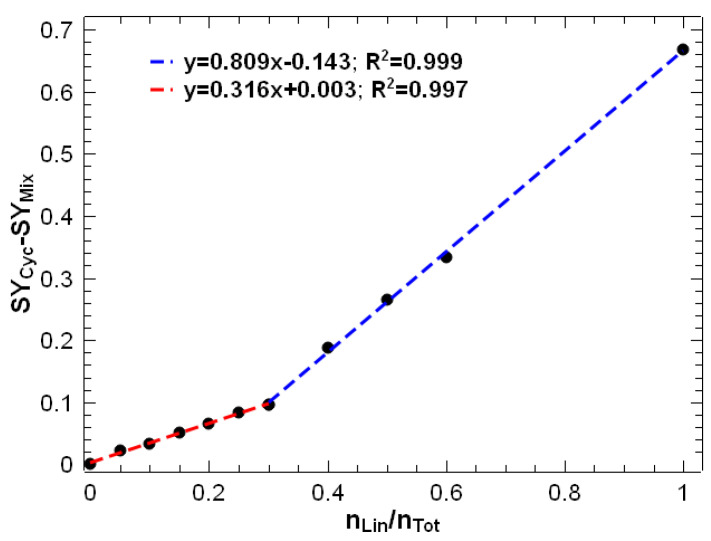
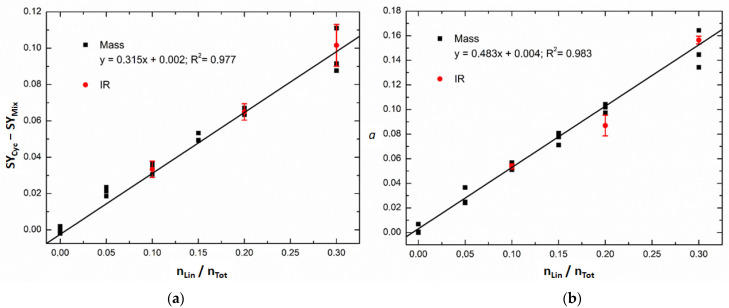
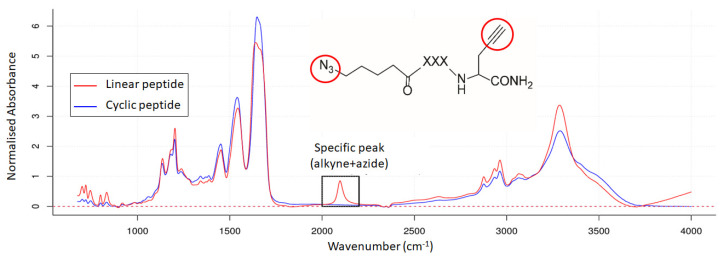
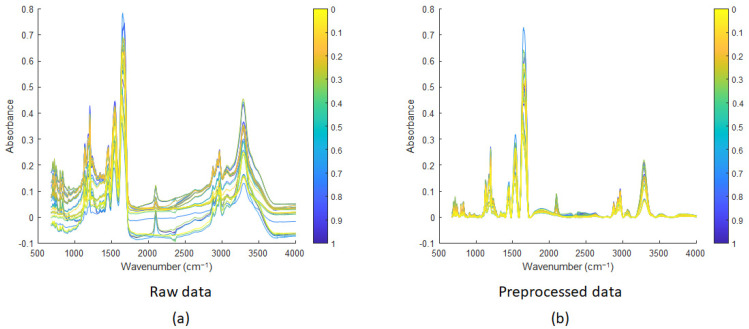
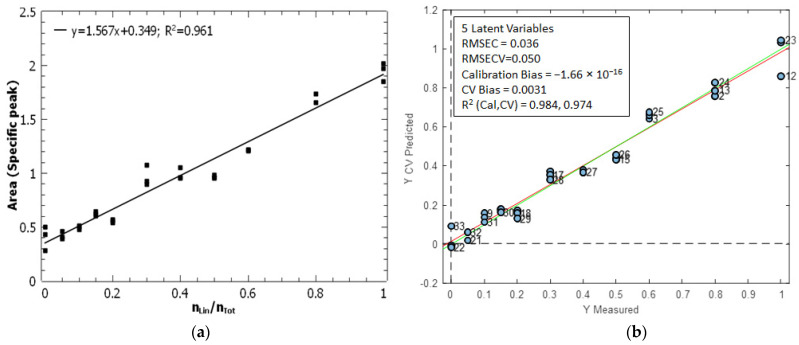
Cyclic peptides have higher stability and better properties as therapeutic agents than their linear peptide analogues. Consequently, intramolecular click chemistry is becoming an increasingly popular method for the synthesis of cyclic peptides from their isomeric linear peptides. However, assessing the purity of these cyclic peptides by mass spectrometry is a significant challenge, as the linear and cyclic peptides have identical masses. In this paper, we have evaluated the analytical capabilities of energy-resolved mass spectrometry (ER MS) and mid-infrared microscopy (IR) to address this challenge. On the one hand, mixtures of both peptides were subjected to collision-induced dissociation tandem mass spectrometry (CID MS/MS) experiments in an ion trap mass spectrometer at several excitation energies. Two different calibration models were used: a univariate model (at a single excitation voltage) and a multivariate model (using multiple excitation voltages). The multivariate model demonstrated slightly enhanced analytical performance, which can be attributed to more effective signal averaging when multiple excitation voltages are considered. On the other hand, IR microscopy was used for the quantification of the relative amount of linear peptide. This was achieved through univariate calibration, based on the absorbance of an alkyne band specific to the linear peptide, and through Partial Least Squares (PLS) multivariate calibration. The PLS calibration model demonstrated superior performance in comparison to univariate calibration, indicating that consideration of the full IR spectrum is preferable to focusing on the specific peak of the linear peptide. The advantage of IR microscopy is that it is linear across the entire working interval, from linear peptide molar ratios of 0 (equivalent to pure cyclic peptide) up to 1 (pure linear peptide). In contrast, the ER MS calibration models exhibited linearity only up to 0.3 linear peptide molar ratio. However, ER MS showed better performances in terms of the limit of detection, intermediate precision and the root-mean-square-error of calibration. Therefore, ER MS is the optimal choice for the detection and quantification of the lowest relative amounts of linear peptides.

Keywords: click chemistry; cyclic peptide; energy-resolved mass spectrometry; infrared microscopy; multivariate and univariate calibration; peptide isomers; quantification.


Conflict of interest statement

The authors declare no conflicts of interest.

Figures

Figure 1
Figure 1
Synthesis of the cyclic peptide from the linear peptide by “click chemistry” using the Huisgen reaction.
Figure 2
Figure 2
MS/MS spectra of linear (a) and cyclic (b) caesium-cationised peptides at 2.5 V excitation voltage. No peaks were observed outside of the mass range displayed in these MS/MS spectra.
Figure 3
Figure 3
Survival Yield (SY) curves of mixtures of linear and cyclic peptides at different molar ratios. The SY is calculated from the MS/MS spectra of the caesium-cationised peptides. The SY of the mixtures lies between the SY curves of the linear and cyclic peptides. The orange vertical line corresponds to the excitation voltage at which the univariate calibration model was calculated to relate the SY to the molar ratio of the linear peptide.
Figure 4
Figure 4
SY at an excitation voltage of 2.2 V for caesium-cationised mixtures of cyclic and linear peptides at different molar ratios. Two regression models were calculated: one for molar ratios of linear peptide from 0 to 0.3 (in red) and another from 0.3 to 1 (in blue).
Figure 5
Figure 5
Calibration models of SY data with three replicates (black squares) for mixtures of caesium-cationised linear and cyclic peptides obtained with (a) univariate calibration at an excitation voltage of 2.2 V and with (b) multivariate calibration (coefficient (a) in Equation (2)). The IR samples (red circles) correspond to mixtures initially prepared for IR microscopy and measured by ER MS. The red circles correspond to the mean value of three measurements, and the error bar corresponds to the standard deviation of the three measurements.
Figure 6
Figure 6
IR spectra of the linear peptide (in red) and the cyclic peptide (in blue). A specific peak is observed for the linear peptide. The red circles indicate the alkyne and azide groups in the linear peptide, which are responsible for this peak.
Figure 7
Figure 7
IR spectra of mixtures of linear and cyclic peptides: (a) raw data and (b) preprocessed spectra with baseline correction using AsLS. The figure uses a colour coding scheme to represent the molar ratios of linear and cyclic peptides. The pure peptides are assigned distinct colours: yellow for the cyclic peptide and blue for the linear peptide. Intermediate colours represent gradients resulting from the proportional mixing of yellow and blue, with each shade corresponding to the specific molar ratio of linear peptide.
Figure 8
Figure 8
Calibration models to quantify the molar ratio of linear peptides by IR microscopy. (a) Univariate calibration is based on the area of the specific peak of linear peptide (Figure 7). (b) PLS calibration model calculated from the whole IR spectra. The green line represents the theoretical line y = x, while the red line represents the regression line derived from the predicted values of the calibration standards.

Similar articles

Cited by

References

    1. Abdalla M.A., McGaw L.J. Natural Cyclic Peptides as an Attractive Modality for Therapeutics: A Mini Review. Molecules. 2018;23:2080. doi: 10.3390/molecules23082080. - DOI - PMC - PubMed
    1. Ji X., Nielsen A.L., Heinis C. Cyclic Peptides for Drug Development. Angew. Chem. Int. Ed. 2024;63:e202308251. doi: 10.1002/anie.202308251. - DOI - PubMed
    1. Ramadhani D., Maharani R., Gazzali A.M., Muchtaridi M. Cyclic Peptides for the Treatment of Cancers: A Review. Molecules. 2022;27:4428. doi: 10.3390/molecules27144428. - DOI - PMC - PubMed
    1. Gisemba S.A., Ferracane M.J., Murray T.F., Aldrich J.V. A Bicyclic Analog of the Linear Peptide Arodyn Is a Potent and Selective Kappa Opioid Receptor Antagonist. Molecules. 2024;29:3109. doi: 10.3390/molecules29133109. - DOI - PMC - PubMed
    1. Li P., Roller P.P. Cyclization Strategies in Peptide Derived Drug Design. Curr. Top. Med. Chem. 2002;2:325–341. doi: 10.2174/1568026023394209. - DOI - PubMed

Grants and funding

LinkOut - more resources