. 2024 Dec 10;16(12):533.
doi: 10.3390/toxins16120533.

Veratridine Induces Vasorelaxation in Mouse Cecocolic Mesenteric Arteries

Affiliations

Veratridine Induces Vasorelaxation in Mouse Cecocolic Mesenteric Arteries

Joohee Park et al. Toxins (Basel). .

Abstract

The vegetal alkaloid toxin veratridine (VTD) is a selective voltage-gated Na+ (NaV) channel activator, widely used as a pharmacological tool in vascular physiology. We have previously shown that NaV channels, expressed in arteries, contribute to vascular tone in mouse mesenteric arteries (MAs). Here, we aimed to better characterize the mechanisms of action of VTD using mouse cecocolic arteries (CAs), a model of resistance artery. Using wire myography, we found that VTD induced vasorelaxation in mouse CAs. This VTD-induced relaxation was insensitive to prazosin, an α1-adrenergic receptor antagonist, but abolished by atropine, a muscarinic receptor antagonist. Indeed, VTD-vasorelaxant effect was totally inhibited by the NaV channel blocker tetrodotoxin (0.3 µM), the NO synthase inhibitor L-NNA (20 µM), and low extracellular Na+ concentration (14.9 mM) and was partially blocked by the NCX1 antagonist SEA0400 (45.4% at 1 µM). Thus, we assumed that the VTD-induced vasorelaxation in CAs was due to acetylcholine release by parasympathetic neurons, which induced NO synthase activation mediated by the NCX1-Ca2+ entry mode in endothelial cells (ECs). We demonstrated NCX1 expression in ECs by RT-qPCR and immunohisto- and western immunolabelling. VTD did not induce an increase in intracellular Ca2+ ([Ca2+]i), while SEA0400 partially blocked acetylcholine-triggered [Ca2+]i elevations in Mile Sven 1 ECs. Altogether, these results illustrate that VTD activates NaV channels in parasympathetic neurons and then vasorelaxation in resistance arteries, which could explain arterial hypotension after VTD intoxication.

Keywords: Na+/Ca2+ exchanger (NCX); mesenteric and endothelial cell lines; mouse mesenteric arteries; myography; veratridine; voltage-gated Na+ channel.


Conflict of interest statement

The authors declare no conflicts of interest.

Figures

Figure 1
Figure 1
Functional organization of perivascular innervation of mesenteric arteries. (a) Schematic representation of periarterial innervation. Neurotransmitters are released from varicosities and diffuse to receptors in SMCs and ECs. CGRP = calcitonin gene-related peptide; NE = norepinephrine; NY = neuropeptide Y; SP = substance P. Galanin is not shown since it has not been detected in nerve fibers of mesenteric arteries. (b) Image of mesenteric arterial bed in mice. Three different branches were used: cecocolic artery (CA; diameter = ~200 µm), middle colic artery (MCA; diameter = ~150 µm), and first-order mesenteric artery (FOMA; diameter = ~150 µm). Red arrow illustrates blood flow.
Figure 2
Figure 2
Effects of VTD on CAs and MCAs. Wall tension generated by CAs and MCAs was measured with and without PZ (1 µM). (a) Examples of myographic traces showing effects of VTD (30 µM) on CAs. (be) Graphs illustrating connected scatter plots of individual values of wall tension levels (force, in mN) before and after VTD application for each CA (bd) and MCA (e). Control: wall tension with U46619 alone; PZ: wall tension with U46619 with PZ; PZ + AP: wall tension with U46619, PZ, and atropine (AP, 100 nM). CAs were isolated from male (n = 9) and female (n = 7) mice (b,c). Only male mice were used in (d) (n = 7) and (e) (n = 6). Significance was evaluated using paired t test: *: p < 0.05; ****: p < 0.0001; ns: non-significant; p = 0.0602.
Figure 3
Figure 3
Concentration-dependent effects of VTD and TTX on CAs. (a) Concentration–relaxation relationship of VTD effect on CAs analyzed using Langmuir equation (EC50 = 5 µM; maximum effect = 47.9%). Numbers in brackets indicate the numbers of animal used. (b) Scatter plots illustrating effect of TTX (0.3 and 1 µM) on VTD-induced relaxation (30 µM). (c) Scatter plots showing effect of low extracellular Na+ concentration ([Na+]e = 14.9 mM) on VTD-induced relaxation (30 µM). All experiments were performed with PZ (1 µM). CAs were isolated from male (n = 10) and female (n = 10) mice (a,b). Only male mice were used in (c) (n = 7). Values are means ± SEM. Significance was analyzed with one-way ANOVA test followed by Dunn’s test (b) for multiple comparisons (ns: non-significant; ****: p < 0.0001) and paired t test (c) (*: p < 0.05).
Figure 4
Figure 4
The effects of L-NNA on VTD-induced vasorelaxation in CAs. (a,b) Connected scatter plots showing the contractile force (in mN) generated by isolated CAs before and after the application of VTD (30 µM) in the absence of L-NNA (a) and in the presence of 20 µM L-NNA (b). (c) Scatter plots illustrating the reduction in VTD-induced relaxation (in %) by L-NNA. All experiments were carried out on pre-contracted CAs with U46619 in the presence of PZ (1 µM). The CAs were isolated from male (n = 16) and female (n = 10) mice. The significance was analyzed by a parametric paired t test (****: p < 0.0001; ns: non-significant; p = 0.8193).
Figure 5
Figure 5
Effects of NCX antagonists on VTD-induced vasorelaxation in CAs. Scatter plots illustrating reduction in VTD-induced vasorelaxant responses of CAs with KB-R7943 (10 µM, NCX blocker) (a) and with SEA0400 (1 and 10 µM, NCX1 blocker) (b). CAs were pre-contracted with U46619 in presence of PZ (1 µM). CAs were isolated from males (n = 7) and females (n = 7) (b). Values are means ± SEM. Significance was analyzed with paired t test (a) and one-way ANOVA, followed by Tukey multiple comparison test (b) (****: p < 0.0001).
Figure 6
Figure 6
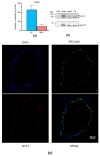
NCX expression in CAs. (a) Histograms showing the mRNA expression levels of NCX determined by absolute RT-qPCR in CAs collected from male and female mice. (b) NCX1 immunoblotting in the CAs. NCX1 expression was evaluated in CAs by Western blotting with an anti-NCX1 antibody. HSC70 was used as a loading control and mouse brains and hearts were used as positive control samples. The experiments were carried out with 10 µg of proteins. Due to the limited size of the CAs, segments of three mice were pooled. (c) NCX1 immunolocalization in CAs. NCX1 were immunodetected in CAs by an anti-NCX1 antibody (red). Endothelium was immunolabeled by an anti-PECAM1 antibody (green). The nucleus was labeled by DAPI (blue). Values are the means ± SEM of three independent experiments. MW: molecular weight.
Figure 7
Figure 7
Effects of VTD on intracellular Ca2+ concentration in MS1 ECs. (a,b) RT-qPCR data, illustrated as RNA relative level (2−ΔCT), showing expression of nos3, pecam1, chrm1-3, scn3a, and scn1b. Undetectable genes are not represented (scn1a, scn2a, scn4a, scn5a, scn8-11a, scn1-2b, and scn4b) (b) Western blot (right panel) illustrating NaV channel expression in MS1 ECs. Western blot was performed with 30 µg of proteins. PanNaV and β-actin antibodies were used. GH3b6 cells were used as positive control. (c,d) Example of kinetic traces of Fura-2 fluorescence–emission ratio obtained before and after injection, at 30 s, of VTD, brevetoxin 2 (PbTx2), batrachotoxin (BTX) (c), and ACh (d,e). Effects of co-injection of ACh and VTD or TTX or AP are shown (d,e). Hank’s Balanced Salt Solution (HBSS) was used as negative control. Data are the mean ± SEM of three independent experiments (n = 3).
Figure 8
Figure 8
The effects of NCX antagonists on the ACh-induced Ca2+ response in MS1 ECs. (a) RT-qPCR data (left panel) illustrated as the RNA relative level (2−ΔCT), showing the expression of slc8a1, encoding NCX1. The undetectable genes (Slc8a2 and Slc8a3) are not illustrated. The Western blot (right panel) shows the immunodetection of NCX1 in the MS1 ECs. HSC70 antibodies were used as loading controls. Protein extracts from mouse hearts served as positive controls. (b) An example of kinetic traces of the Fura-2 fluorescence–emission ratio, illustrating the effects of ACh (1 µM) co-injected or not co-injected with AP (100 nM), in free Na+ and Ca2+ buffers. The histograms illustrate the normalized emission ratio of Fura-2 measured after Ach injection (1 µM) in Ca2+-free buffer and in Na+-free buffer. These data represent the area under the curve (AUC) calculated from the kinetic traces and after normalization by ACh-induced responses at 1 µM in Hank’s Balanced Salt Solution (HBSS), used as the control. (c,d) The effects of NCX antagonists on the ACh-induced Ca2+ response in MS1 ECs. The left panels show examples of kinetic traces of the Fura-2 fluorescence–emission ratio before and after the injection, at 30 s, of ACh, which led to the highest inhibition induced by the two NCX antagonists KB-R7943 (10 µM) (c) and SEA0400 (10 µM) (d). The graphs on the right panels illustrate the inhibition (% of control) induced by KB-R7943 (c) and SEA0400 (d), as a function of the ACh concentration. HBSS was used as a negative control (d). Data are the mean ± SEM of three independent experiments (n = 3). Statistical significances were determined using the Mann–Whitney test (b) and Wilcoxon test (c,d) (* p < 0.05; ** p < 0.01; **** p < 0.0001; ns: non-significant).
Figure 9
Figure 9
The effects of thapsigargin and chelerythrine on ACh-induced Ca2+ responses in MS1 ECs. (a) The effects of thapsigargin (5 µM) on Ca2+ responses induced by 1 µM of ACh. Hank’s Balanced Salt Solution (HBSS) was used as a negative control. (b) The curves represent the inhibitory effects of chelerythrine (10 µM) on the Ca2+ responses induced by 0.01, 0.1, 1, and 10 µM of ACh in the MS1 ECs. The analyses were based on the area under the curve determined from the kinetic traces. The data were normalized by the Ca2+ response induced by ACh at 10 µM. The mean values of the inhibitory effects were compared to 0% using a one-sample t test (** p < 0.01). Values are means ± SEM (n = 3).

References

    1. Krayer O., Acheson G.H. The Pharmacology of the Veratrum Alkaloids. Physiol. Rev. 1946;26:383–446. doi: 10.1152/physrev.1946.26.3.383. - DOI - PubMed
    1. Ulbricht W. Reviews of Physiology Biochemistry and Pharmacology, Volume 133. Springer; Berlin/Heidelberg, Germany: 1998. Effects of Veratridine on Sodium Currents and Fluxes; pp. 1–54. - PubMed
    1. Craig R.A., Garrison C.E., Nguyen P.T., Yarov-Yarovoy V., Du Bois J. Veratridine: A Janus-Faced Modulator of Voltage-Gated Sodium Ion Channels. ACS Chem. Neurosci. 2020;11:418–426. doi: 10.1021/acschemneuro.9b00621. - DOI - PubMed
    1. Mattei C., Legros C. The Voltage-Gated Sodium Channel: A Major Target of Marine Neurotoxins. Toxicon. 2014;91:84–95. doi: 10.1016/j.toxicon.2014.09.016. - DOI - PubMed
    1. Réthoré L., Park J., Montnach J., Nicolas S., Khoury J., Le Seac’h E., Mabrouk K., De Pomyers H., Tricoire-Leignel H., Mattei C., et al. Pharmacological Dissection of the Crosstalk between NaV and CaV Channels in GH3b6 Cells. Int. J. Mol. Sci. 2022;23:827. doi: 10.3390/ijms23020827. - DOI - PMC - PubMed

Publication types

LinkOut - more resources