. 2024 Dec 6;11(12):625.
doi: 10.3390/vetsci11120625.

Effects of Caffeic Acid Phenethyl Ester on Embryonic Development Through Regulation of Mitochondria and Endoplasmic Reticulum

Affiliations

Effects of Caffeic Acid Phenethyl Ester on Embryonic Development Through Regulation of Mitochondria and Endoplasmic Reticulum

Chu-Man Huang et al. Vet Sci. .

Abstract

Caffeic acid phenethyl ester (CAPE) is one of the main active components of the natural medicine propolis, which has antioxidant, anti-tumor, and immunomodulatory activities. This study aimed to analyze the effects and underlying mechanisms of CAPE added to the medium of in vitro cultures on the developmental competence, mitochondria, and endoplasmic reticulum of porcine embryos. The results demonstrated that 1 nM of CAPE significantly improved the quality of porcine embryos, increased the rate of blastocyst formation, and enhanced the proliferation ability. It also enhanced mitochondrial function by increasing the level of mitochondrial membrane potential and expression of the mitochondrial biogenesis-related protein PPARgamma coactivator 1 alpha and beta (PGC1 alpha and beta), regulating mitochondrial biogenesis, and increasing adenosine triphosphate (ATP) content. In addition, CAPE alleviated oxidative and endoplasmic reticulum (ER) stress in embryos by decreasing ROS accumulation and increasing glutathione content, as well as elevating Nrf2 and reducing GRP78 (ER stress marker) expression levels. Moreover, CAPE reduced the levels of apoptosis and autophagy in the cultivated embryos. These results indicate that CAPE improves the quality and enhances the mitochondrial function of in vitro-produced porcine embryos by alleviating oxidative and ER stress.

Keywords: caffeic acid phenethyl ester; embryonic development; endoplasmic reticulum; mitochondrial function.


Conflict of interest statement

The authors declare no conflicts of interest.

Figures

Figure 1
Figure 1
Effects of different concentrations of CAPE on the formation of blastocysts in vitro. (A) Effects of different CAPE concentrations (0, 0.1, 1, and 20 nM) on porcine blastocyst formation rate, especially 1 nM. (B) Stained images of total cell number in day 7 blastocysts with or without 1 nM CAPE treatment. (C) Effects of different CAPE concentrations (0, 0.1, 1, and 20 nM) on porcine blastocyst formation rate, especially 1 nM. Number of oocytes (n) used here was 131, 129, 127, and 127 for 0, 0.1, 1, and 20 nM of CAPE, respectively. (D) Total cell number in the control (n = 35) and 1 nM CAPE-treated (n = 30) groups. Scale bars = 100 μm. * p < 0.05, *** p < 0.001.
Figure 2
Figure 2
Effect of CAPE on the proliferative capacity of porcine embryos. (A) Representative 5-ethynyl-2′-deoxyuridine (EdU) staining images. The blue colour represents the nucleus and the green colour represents the EdU-positive nuclei. (B) Relative levels of proliferating cells in embryos treated with (n = 31) or without (n = 29) CAPE. (C) Relative mRNA expression levels of embryonic developmental genes, BMP15, PCNA, OCT4, CCNB1, CDK2, CDK1, SOX2, and NANOG, quantified with RT-qPCR. Scale bars = 100 μm. * p < 0.05, ** p < 0.01, *** p < 0.001.
Figure 3
Figure 3
Effect of CAPE on the antioxidant performance of porcine embryos in vitro. (A) Representative 4-chloromethyl-6,8-difluoro-7-hydroxycoumarin and 2′,7′-dichlorodihydrofluorescein diacetate staining images. The green colour represents ROS and the blue colour represents GSH. (B) Relative changes in CMF2HC fluorescence intensity in the control (n = 43) and CAPE-treated (n = 39) groups. (C) Representative images of blastocysts stained for the Nrf2 protein. The blue colour represents the nucleus and the green colour represents the Nrf2 protein. (D) Relative changes in DCFH fluorescence intensity in the control (n = 33) and CAPE-treated (n = 32) groups. (E) Relative mRNA expression levels of antioxidant-related genes, SOD1, SOD2, GPX, CAT, PRDX2, and NRF2, quantified by RT-qPCR. (F) Fluorescence intensity of the Nrf2 protein in blastocysts treated with (n = 30) or without (n = 31) CAPE. Scale bars = 100 μm. * p < 0.05, ** p < 0.01, *** p < 0.001.
Figure 4
Figure 4
Effects of CAPE on mitochondrial function of porcine embryos. (A) Representative MitoTracker Red CMXRos staining images. The red colour represents the MitoTracker. (B) Representative JC-1 staining images. The red colour represents the JC1 red fluorescence, the green colour represents the JC1 green fluorescence and the orange colour represents the merged image of the two fluorescence channels. (C) Representative images of blastocysts with PGC1 alpha and beta proteins detected with immunofluorescence staining. The blue colour represents the nucleus and the green colour represents the PGC1 alpha and beta protein. (D) Relative fluorescence levels of MitoTracker Red in 4-cell-stage embryos treated with (n = 50) or without (n = 50) CAPE. (E) Relative fluorescence levels of JC-1 red/green in 4-cell-stage embryos treated with (n = 31) or without (n = 34) CAPE. (F) Relative fluorescence levels of PGC1 alpha and beta in blastocysts treated with (n = 45) or without (n = 35) CAPE. (G) Relative ATP content in blastocysts treated with (n = 60) or without (n = 60) CAPE. (H) Relative mRNA expression levels of mitochondrial function-related genes, PGC1α, TFAM, TFB1M, TFB2M, NRF1, SIRT1, and ATP5B, analyzed by RT-qPCR. Scale bars = 100 μm. * p < 0.05, *** p < 0.001.
Figure 5
Figure 5
Effect of CAPE on endoplasmic reticulum stress of porcine embryos. (A) Representative images of blastocysts with the expression of the GRP78 protein determined with immunofluorescence staining. The blue colour represents the nucleus and the red colour represents the PGC1 alpha and beta protein. (B) Relative fluorescence levels of the GRP78 protein in blastocysts treated with (n = 34) or without (n = 35) CAPE. (C) Relative mRNA expression levels of ER stress-related genes, CHOP, uXBP1, sXBP1, GRP78, ATF4, and ATF6, quantified by RT-qPCR. Scale bars = 100 μm. * p < 0.05, ** p < 0.01, *** p < 0.001.
Figure 6
Figure 6
Effect of CAPE on autophagy and apoptosis of in vitro-produced early porcine embryos. (A) Representative immunofluorescence staining images of the LC3B protein in blastocysts. The blue colour represents the nucleus and the green colour represents the LC3B protein. (B) Representative images of blastocysts stained with TUNEL. The blue colour represents the nucleus and the green colour represents the apoptotic nuclei. (C) Relative autophagy levels in embryos treated with (n = 64) or without (n = 61) CAPE. (D) Relative apoptosis levels in embryos treated with (n = 26) or without (n = 24) CAPE on day 7. (E) Relative mRNA expression levels of autophagy and apoptosis marker genes, LC3B, P62, CASP3, JNK, BAX, and BCL2, quantified using RT-qPCR. Scale bars = 100 μm. * p < 0.05, ** p < 0.01, *** p < 0.001.
Figure 7
Figure 7
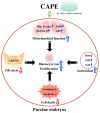
A schematic illustration summarizes how caffeic acid phenethyl ester (CAPE) improves the quality of in vitro-produced porcine embryos by affecting the mitochondrial function, ER stress, antioxidant performance, and cell death. Treating early embryos with 1 nM of CAPE enhances mitochondrial function by increasing the number of functional mitochondria, elevating the mitochondrial membrane potential, and enhancing PGC1 alpha and beta protein expression, which, in turn, promotes mitochondrial biogenesis and increases mitochondrial ATP production. In addition, the CAPE treatment enhances antioxidant properties by lowering ROS production and increasing GSH content and Nrf2 expression. The CAPE treatment also alleviates ER stress by reducing GRP78 expression and hindering autophagy and apoptosis. Solid blue arrows in the figure indicate an increase in relevant content or expression, and blue hollow arrows indicate a facilitation or improvement in relevant function. Solid red arrows in the figure indicate a decrease in the relevant content or expression, and red hollow arrows indicate that the relevant response was inhibited. (By Figdraw, https://www.figdraw.com, 19 January 2024).

References

    1. Galli C., Duchi R., Crotti G., Turini P., Ponderato N., Colleoni S., Lagutina I., Lazzari G. Bovine embryo technologies. Theriogenology. 2003;59:599–616. doi: 10.1016/S0093-691X(02)01243-8. - DOI - PubMed
    1. Babayev E., Seli E. Oocyte mitochondrial function and reproduction. Curr. Opin. Obstet. Gynecol. 2015;27:175–181. doi: 10.1097/GCO.0000000000000164. - DOI - PMC - PubMed
    1. Morgan M.J., Liu Z.G. Crosstalk of reactive oxygen species and NF-κB signaling. Cell Res. 2011;21:103–115. doi: 10.1038/cr.2010.178. - DOI - PMC - PubMed
    1. Ramalho-Santos J., Varum S., Amaral S., Mota P.C., Sousa A.P., Amaral A. Mitochondrial functionality in reproduction: From gonads and gametes to embryos and embryonic stem cells. Hum. Reprod. Update. 2009;15:553–572. doi: 10.1093/humupd/dmp016. - DOI - PubMed
    1. Spinelli J.B., Haigis M.C. The multifaceted contributions of mitochondria to cellular metabolism. Nat. Cell Biol. 2018;20:745–754. doi: 10.1038/s41556-018-0124-1. - DOI - PMC - PubMed

LinkOut - more resources