. 2024 Dec 27;21(1):13.
doi: 10.1007/s11306-024-02215-x.

Metabolic profiling and antibacterial activity of tree wood extracts obtained under variable extraction conditions

Affiliations

Metabolic profiling and antibacterial activity of tree wood extracts obtained under variable extraction conditions

Diana Vinchira-Villarraga et al. Metabolomics. .

Abstract

Introduction: Tree bacterial diseases are a threat in forestry due to their increasing incidence and severity. Understanding tree defence mechanisms requires evaluating metabolic changes arising during infection. Metabolite extraction affects the chemical diversity of the samples and, therefore, the biological relevance of the data. Metabolite extraction has been standardized for several biological models. However, little information is available regarding how it influences wood extract's chemical diversity.

Objectives: This study aimed to develop a methodological approach to obtain extracts from different tree species with the highest reproducibility and chemical diversity possible, to ensure proper coverage of the trees' metabolome.

Methods: A full factorial design was used to evaluate the effect of solvent type, extraction temperature and number of extraction cycles on the metabolic profile, chemical diversity and antibacterial activity of four tree species.

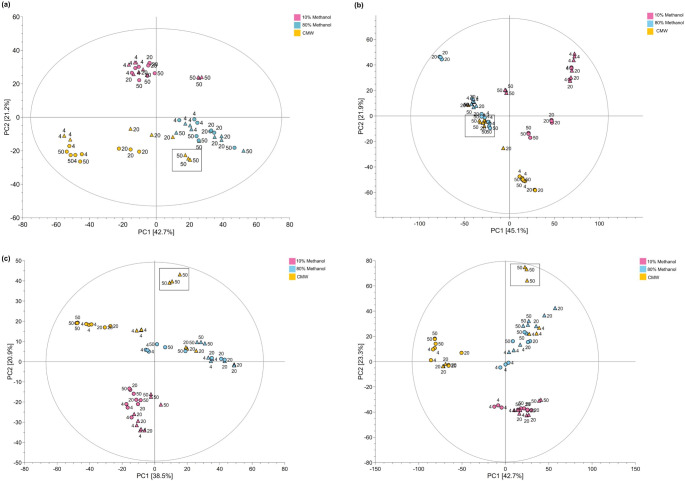
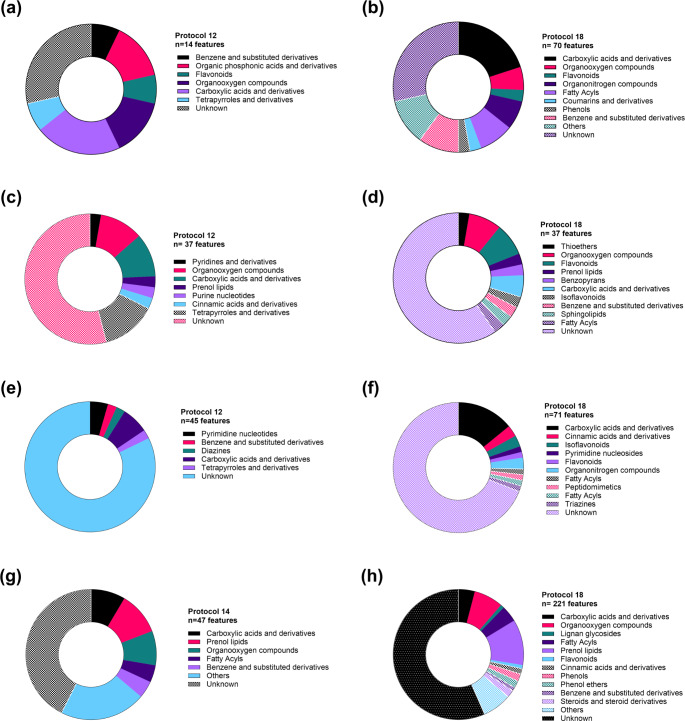
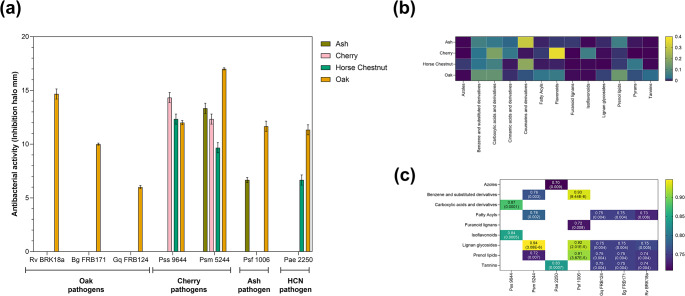
Results: Solvent, temperature and their interaction significantly affected the extracts' chemical diversity, while the number of extraction cycles positively correlated with yield and antibacterial activity. Although 60% of the features were recovered in all the tested conditions, differences in the presence and abundance of specific chemical classes per tree were observed, including organooxygen compounds, prenol lipids, carboxylic acids, and flavonoids.

Conclusions: Each tree species has a unique metabolic profile, which means that no single protocol is universally effective. Extraction at 50 °C for three cycles using 80% methanol or chloroform/methanol/water showed the best results and is suggested for studying wood metabolome. These observations highlight the need to tailor extraction protocols to each tree species to ensure comprehensive metabolome coverage for metabolic profiling.

Keywords: Chemical diversity; Extraction; Mass spectrometry; Tree-metabolomics; Wood.


Conflict of interest statement

Declarations. Ethical approval: This article does not contain any studies with human and/or animal participants. Competing interests: The authors declare no competing interests.

Figures

Fig. 1
Fig. 1
Effect of different extraction conditions on the metabolic profiles of extracts obtained from tree woody tissues. The figure presents the Principal component analysis (PCA) of the mass spectral data collected from (a) cherry, (b) ash, (c) horse chestnut and (d) oak woody tissue. The samples in the figure are coloured according to the extraction solvent (10% methanol, pink; 80% methanol, blue; CMW, orange). In the PCA, samples extracted once or three times are presented as circles or triangles, respectively. Labels on the PCA indicate the extraction temperature. P18 is highlighted with grey boxes in the score plots
Fig. 2
Fig. 2
Comparative assessment of alpha diversity indexes and extraction yield across evaluated extraction protocols. The figure presents the feature richness, unique compounds, Simpson index, and extraction yield of the evaluated protocols on (a-c) cherry, (d-f) ash, (g-i) horse chestnut or (j-l) oak. The Upset plot (panels a, d, g and j) represents the unique features detected only in the specified extraction protocol (single black dots) and the shared (intersect, black line) features detected in the highlighted protocols (black dots). The bottom left bar chart shows the protocol richness (number of features detected). Error bars from the Simpson diversity index and yield plots represent the standard deviation of three replicates per protocol. Protocols with the highest richness are highlighted in orange, blue or green. Significant differences among protocols are presented, indicating the p-value as follows: (ns) p > 0.05, (*) p ≤ 0.05, (**) p ≤ 0.01, (***) p ≤ 0.001, (****) p < 0.0001
Fig. 3
Fig. 3
Correlation between extraction factors and the chemical diversity and antibacterial activity of wood extracts. The heatmaps represent the Spearman correlation matrix of the evaluated extraction factors and the chemical diversity indices for (a) cherry, (b) ash, (c) horse chestnut and (d) oak. The magnitude of the correlation coefficient is proportional to colour intensity according to the scale presented at the bottom right of the figure. Factors with no significant correlation were left empty. Note that correlation values were included within each cell for improved presentation. The p-value of the correlation is presented as follows: (*) p ≤ 0.05, (**) p ≤ 0.01, (***) p ≤ 0.001, (****) p < 0.0001
Fig. 4
Fig. 4
Chemical class distribution of unique features identified in the selected protocols for each tree species. The pie charts indicate the number of unique features annotated in each chemical class in the (a-b) cherry, (c-d) ash, (e-f) horse chestnut and (g-h) oak datasets. Chemical classes were annotated based on the ClassyFire chemical ontology. The number of unique metabolites identified on each protocol is presented at the top of the pie charts (n). Features whose classification score in SIRIUS was lower than 50% (probability < 0.5) and features with no classification were included in the “Unknown” group. Protocol 12–80% methanol, 50 °C, 3 cycles-; Protocol 14 -CMW, 20 °C, 1 cycles-; Protocol 18 -CMW, 50 °C, 3 cycles-
Fig. 5
Fig. 5
Relative abundance variation of the major chemical classes identified on each tree using selected extraction protocols. The figures illustrate the relative abundance of identified chemical taxa across individually evaluated extraction protocols for (a) cherry, (b) ash, (c) horse chestnut and (d) oak. Chemical classes whose relative abundance was lower than 0.5% were merged and presented as “Other”. Features whose classification score in SIRIUS was lower than 50% (probability < 0.5) and features with no classification were included in the “Unknown” group. Significant differences are shown as (*) p ≤ 0.05, (**) p ≤ 0.01, (***) p ≤ 0.001, (****) p < 0.0001. Protocol 12–80% methanol, 50 °C, 3 cycles-; Protocol 6–10% methanol, 50 °C, 3 cycles-; Protocol 14 -CMW, 20 °C, 1 cycles-; Protocol 18 -CMW, 50 °C, 3 cycles-
Fig. 6
Fig. 6
Antibacterial activity, chemical profile variation and their correlation among the four evaluated tree species. Panel (a) presents the average (barplot) antibacterial activity of the tree extracts obtained with P18, against seven tree-pathogenic bacteria. Error bars represent the standard deviation of three biological replicates evaluated per bacteria and tree extract. Panel (b) presents the relative abundance (log10) of the major chemical classes observed on each studied tree. Correlation analyses presented on panel (c) were calculated using the Spearman rank correlation method. Only discriminant chemical classes or subclasses with a strong correlation degree (Spearman correlation coefficient ρ > 0.7) and significant p-values (p < 0.05) were included. In panel (c), the Spearman correlation coefficient value is represented according to the scale colour at the bottom. For clarity, this value is also included within each cell, accompanied by the correlation p-value (presented in brackets). All the figures were created with the data acquired from the extracts obtained with P18 (CMW, 50 °C, 3 cycles). HCN, Horse chestnut

Similar articles

Cited by

References

    1. Abedini, A., Colin, M., Hubert, J., Charpentier, E., Angelis, A., Bounasri, H., Bertaux, B., Kotland, A., Reffuveille, F., Nuzillard, J. M., Renault, J. H., & Gangloff, S. C. (2020). Abundant extractable metabolites from temperate tree barks: The specific antimicrobial activity of Prunus avium extracts. Antibiotics, 9, 111. https://doi.org/10.1101/2022.05.18.492370 - PMC - PubMed
    1. Agarwal, C., Hofmann, T., Visi-Rajczi, E., & Pásztory, Z. (2021). Low-frequency, green sonoextraction of antioxidants from tree barks of Hungarian woodlands for potential food applications. Chemical Engineering and Processing - Process Intensification, 159, 108221.
    1. Aguiar, M. C. S., Mueller de Freitas, M., de Freitas, C. A., Boica Junior, A. L., Carneiro, R. L., da Silva, M., Fernandes, J. B., & Forim, M. R. (2022). Exploring chemical diversity in Glycine max cultivars: A multivariate approach in the search for bioactive compounds against Spodoptera cosmioides. Frontier Plant Sciences, 13, 987782. - PMC - PubMed
    1. Aldana, J., Romero-Otero, A., & Cala, M. P. (2020). Exploring the Lipidome: Current lipid extraction techniques for mass spectrometry analysis. Metabolites, 10(6). - PMC - PubMed
    1. Alseekh, S., Aharoni, A., Brotman, Y., Contrepois, K., D’Auria, J., Ewald, J., Ewald, J., Fraser, P. D., Giavalisco, P., Hall, R. D., Heinemann, M., Link, H., Luo, J., Neumann, S., Nielsen, J., Perez De Souza, L., Saito, K., Sauer, U., & Fernie, A. R. (2021). Mass spectrometry-based metabolomics: a guide for annotation, quantification and best reporting practices. Nature Methods, 18, 747–756. - PMC - PubMed

MeSH terms

LinkOut - more resources