Review
. 2025 Feb;67(2):469-492.
doi: 10.1007/s00234-024-03517-6. Epub 2024 Dec 27.

Retinoblastoma and beyond: pediatric orbital mass lesions

Affiliations
Review

Retinoblastoma and beyond: pediatric orbital mass lesions

Zoran Rumboldt et al. Neuroradiology. 2025 Feb.

Abstract

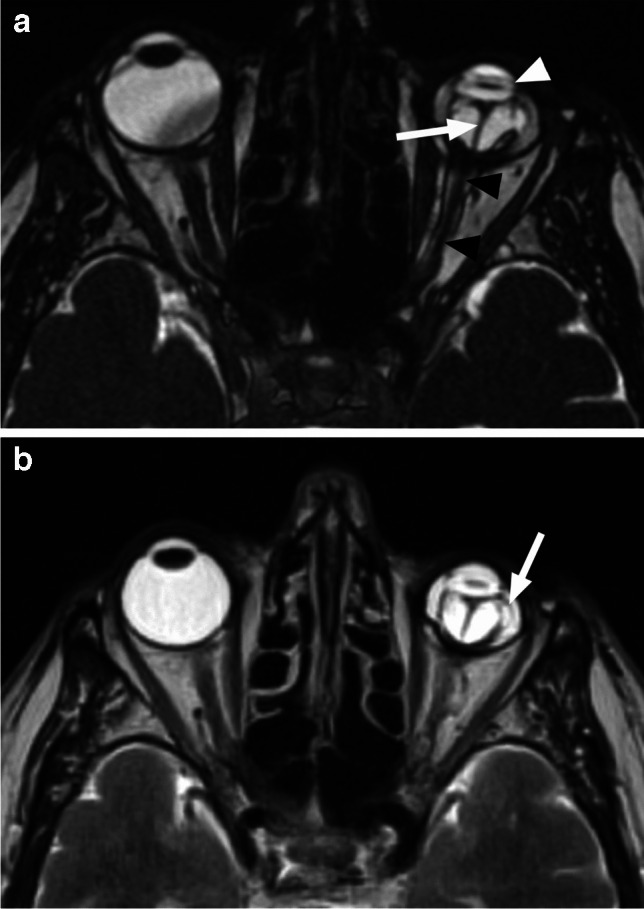
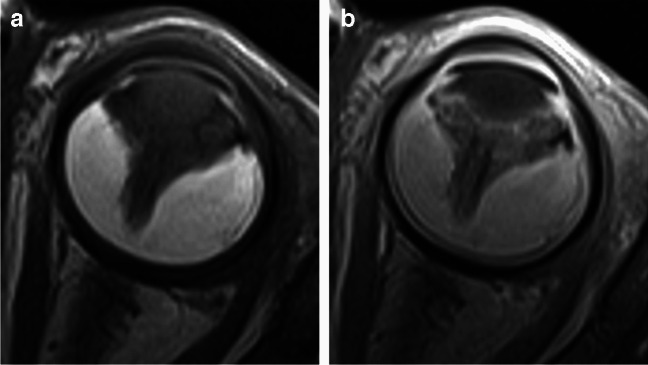
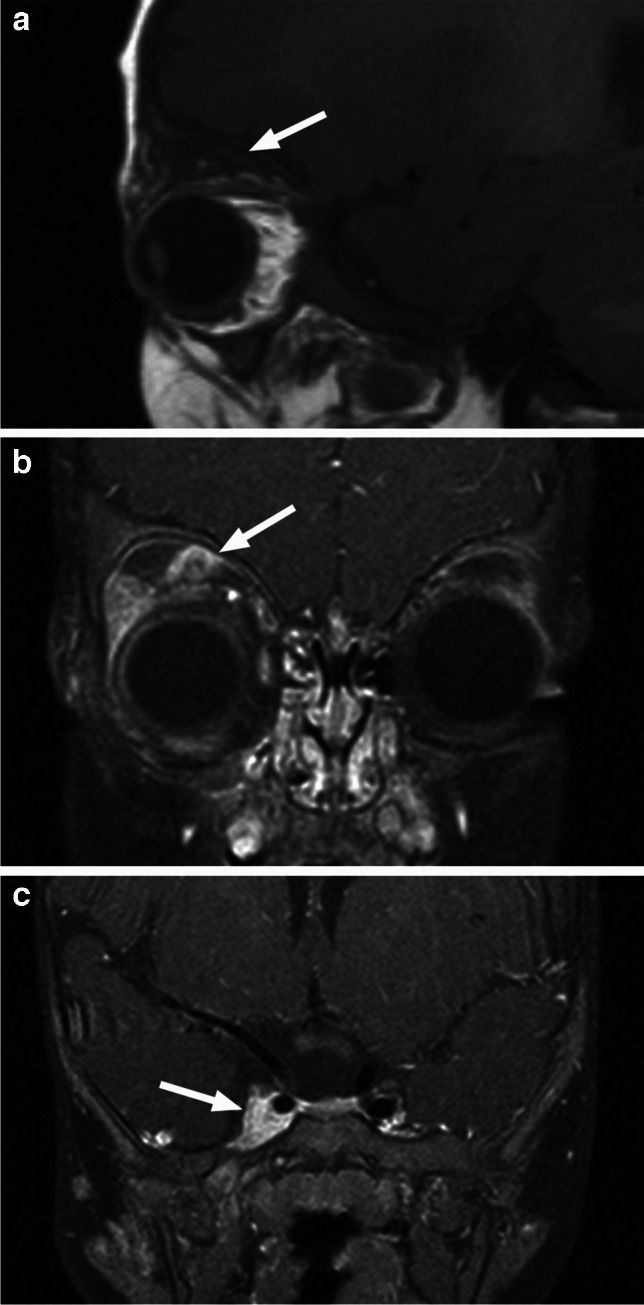
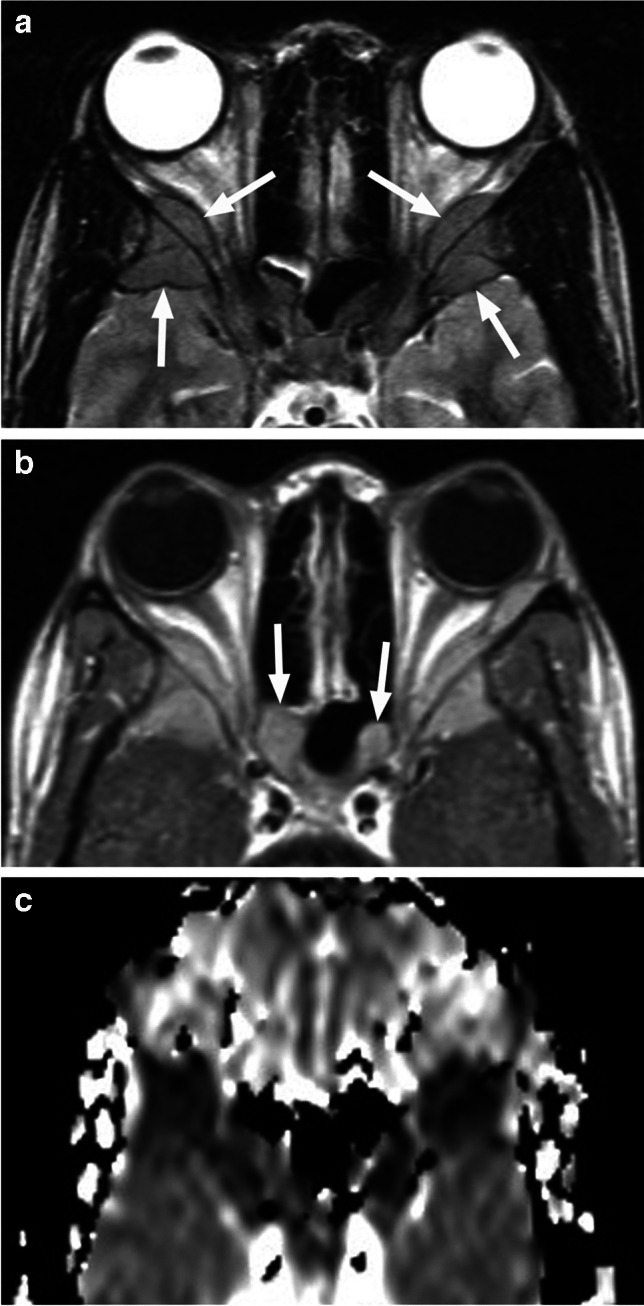
Various space occupying lesions can arise in the orbit, ranging from developmental anomalies to malignancies, and many of the diseases occurring in children are different from the pathologies in the adult population. As the clinical presentation is frequently nonspecific, radiologic evaluation is essential for lesion detection and characterization as well as patient management. While orbital masses may in some cases involve multiple compartments, a simple compartmental approach is the key for the diagnosis on imaging studies, and MRI is the modality of choice. This pictorial review presents the most common and characteristic non-emergent pediatric orbital lesions, stressing their MRI and CT appearances, including specific differentiating features. The lesions are subdivided into 4 compartments: intraocular, intraconal, extraconal, and orbital walls. Retinoblastoma, Coats disease and persistent fetal vasculature; optic pathway glioma and lymphovascular malformations; rhabdomyosarcoma, infantile hemangioma, neurofibroma and lymphoma; neuroblastoma, leukemia/myeloid sarcoma, Langerhans cell histiocytosis and dermoid are reviewed in their respective compartments.

Keywords: Dermoid; Infantile hemangioma; Langerhans cell histiocytosis; Neuroblastoma; Pseudoretinoblastoma; Retinoblastoma; Rhabdomyosarcoma; Venolymphatic malformations.


Conflict of interest statement

Declarations. Ethical approval: Ethical approval is not required for this review article, according to the institutional Ethics Committee. Informed consent: Informed consent was not necessary as the images used in this review article contain no identifying information. Competing interests: The authors have no competing interests to declare that are relevant to the content of this article. Conflict of interest: We declare that we have no conflict of interest.

Figures

Fig. 1
Fig. 1
High resolution axial T2-weighted image of the globe shows retinoblastoma with endophytic growth into the vitreous chamber, including vitreous seeding (arrows)
Fig. 2
Fig. 2
Exophytic growth of retinoblastoma (arrow) with a prominent V-shaped retinal detachment (arrowheads) on axial T2-weighted image through the globe
Fig. 3
Fig. 3
High resolution axial T2-weighted image of the globe reveals retinoblastoma with diffuse, infiltrative growth along the detached retina. There is tumor-retina folding with enclosure of the vitreous (arrow)
Fig. 4
Fig. 4
Left eye retinoblastoma in an infant. Nodular intraocular lesion (arrows) shows low diffusivity (low signal intensity, hypointense to the brain) on axial ADC map (a) and enhancement on corresponding postcontrast T1-weighted image with fat saturation (b)
Fig. 5
Fig. 5
Bilateral retinoblastoma. Axial T2-weighted image of the orbits demonstrates intraocular hypointense masses arising from the retina of both eyes
Fig. 6
Fig. 6
Bilateral retinoblastoma. There are right greater than left intraocular masses containing calcifications on this axial CT image of the orbits with soft tissue algorithm and window
Fig. 7
Fig. 7
Retinoblastoma with postlaminar optic nerve invasion (PLONI). Axial T2-weighted image shows left intraocular hypointense mass (arrow) with retinal detachment and subretinal fluid level (white arrowhead). There is also thickening of the retrobulbar optic nerve (black arrowhead)
Fig. 8
Fig. 8
Coronal STIR image (a) shows thickening and increased signal intensity of the retrobulbar left optic nerve (arrow). There is also enhancement of the intraorbital nerve (arrow) on a more posterior coronal postcontrast T1-weighted image with fat saturation (b). The findings are consistent with PLONI in this patient with retinoblastoma of the left eye
Fig. 9
Fig. 9
Axial postcontrast T1-weighted image of the globe in a patient with retinoblastoma demonstrates postlaminar optic nerve enhancement (white arrow) that is similar with the adjacent uninterrupted choroid (black arrow), indictive of inflammation. There was no nerve infiltration at histology
Fig. 10
Fig. 10
Axial postcontrast T1-weighted image in another patient with retinoblastoma shows optic nerve enhancement and interruption of the choroidal enhancement (white arrow), indicative of neoplastic invasion of the nerve. There is also extension of the enhancing mass to the anterior ocular chamber (black arrow)
Fig. 11
Fig. 11
Retinoblastoma with scleral and extrascleral invasion. Axial T2-weighted image of the globe (a) shows a heterogenous mass with endophytic growth, consistent with retinoblastoma. The adjacent linear scleral hypointensity is irregular and discontinuous with extension of the mass into the retrobulbar fat (arrow). Corresponding postcontrast T1-weighted image (b) reveals enhancement of the affected sclera (arrow), which is confirmed on sagittal postcontrast T1-weighted image (c) demonstrating continuous enhancement of the intraocular lesion, sclera and retrobulbar fat (arrow)
Fig. 12
Fig. 12
Coats disease (exudative retinitis). High resolution axial T2-weighted image of the globe reveals Y-shaped retinal detachment (arrow), without evidence of underlying mass lesion
Fig. 13
Fig. 13
Coats disease. Axial T1-weighted image of the orbits (a) shows retinal detachment in the smaller left globe with hyperintensity of the exudate. Corresponding T2-weighted image (b) demonstrates low signal of the subretinal fluid and a retinal cyst (arrow). Extensive retinal detachment without evidence of an underlying mass in the smaller left globe is also seen on coronal STIR image (c)
Fig. 14
Fig. 14
Persistent fetal vasculature (PFV). High resolution 3D T2-weighted image of the orbits in the axial plane (a) demonstrates microphthalmia on the left side with the characteristic central linear band (arrow) along with deformed lens and ciliary body (white arrowhead). There is also small caliber of the optic nerve (black arrowheads), consistent with nerve atrophy. Corresponding axial T2-weighted image (b) shows the same intraocular findings, including a retinal cyst (arrow)
Fig. 15
Fig. 15
Axial T1-weighted images of the globe without (a) and with contrast agent (b) show Y-shaped retinal detachment with prominent hyperintensity of the exudate and enhancement of the cone-shaped retrolental tissue in this patient with PHV
Fig. 16
Fig. 16
Optic nerve glioma. Coronal STIR image through the orbits (a) reveals a very prominent thickening and slightly increased signal intensity of the right optic nerve (arrow). Axial T1-weighted image (b) exhibits fusiform enlargement of the entire intraorbital nerve (arrow), which demonstrates patchy enhancement on the corresponding postcontrast T1-weighted image with fat saturation (c)
Fig. 17
Fig. 17
Coronal T2-weighted image shows bilaterally thickened intraorbital optic nerves, consistent with ONGs in a patient with neurofibromatosis type 1 (NF1)
Fig. 18
Fig. 18
OPG in a patient with NF1. Coronal T1-weighted postcontrast image with fat saturation (a) shows an optic chiasm/hypothalamic mass with avid heterogenous enhancement (arrow), adjacent to pituitary infundibulum (arrowhead). Corresponding follow-up image (b) reveals decreased and more heterogenous enhancement, without any interval treatment
Fig. 19
Fig. 19
Venous malformation. Sagittal T1-weighted image (a) shows an isointense preseptal and postseptal intraorbital lesion (arrows), which is enhancing on the corresponding delayed postcontrast image (b). Coronal STIR image (c) demonstrates increased signal of the lobulated mass with an internal oval hypointensity, indicative of a phlebolith (arrow), without flow voids. The irregular trans-spatial lesion is contiguous with an additional facial component (arrowhead), which is also present on the sagittal images
Fig. 20
Fig. 20
Lymphatic malformation. Axial postcontrast CT image (a) shows a heterogenous predominantly intraconal left orbital mass leading to left ocular proptosis. Corresponding T2-weighted image with fat saturation (b) reveals multicystic structure of the lesion with characteristic layering fluid levels (arrow)
Fig. 21
Fig. 21
Axial CT image with bone algorithm and window (a) demonstrates mild expansion and smooth remodeling of the bony orbital walls on the left side with most prominent medial deviation of the lamina papyracea (arrow). There appears to be an intraconal mass lesion. Corresponding T1-weighted image (b) reveals a slightly heterogenous predominantly isointense intraconal mass (arrow), which exhibits partial patchy enhancement on the postcontrast image (c). High resolution 3D T2-weighted image (d) at the same level shows the characteristic fluid-fluid levels within the multicystic portion of this venolymphatic malformation (VLM)
Fig. 22
Fig. 22
Rhabdomyosarcoma. Axial non-enhanced CT image (a) shows a well-defined homogenous oval extraconal lesion (arrow) in the superonasal aspect of the right orbit, isodense with extra-ocular muscles and mildly compressing the globe. Adjacent medial orbital wall appears intact. Axial T2-weighted (b) and T1-weighted (c) images at a similar level show homogenous intermediate to slightly increased signal intensity of the mass, without flow voids. There is mildly heterogenous enhancement on axial postcontrast T1-weighted image with fat saturation (d, suboptimal image quality due to motion artifacts) and low diffusivity of the mass (arrow), which is hypointense to the brain on corresponding ADC map (e)
Fig. 23
Fig. 23
Infantile hemangioma. Axial T2-weighted image through the orbits (a) shows a small preseptal and superomedial extraconal mass (arrow) with internal dark flow voids and fibrous septa. Corresponding postcontrast T1-weighted image with fat saturation (b) demonstrates avid dense enhancement of the well-defined lesion
Fig. 24
Fig. 24
Axial T2-weighted image of the orbits (a) shows a preseptal and postseptal intraorbital lesion containing flow voids (arrows), which demonstrates intense homogenous hyperperfusion with arterial spin labeling (ASL) (b). The lesion also demonstrated prominent homogenous enhancement and high ADC values, hyperintense to the brain (not shown), consistent with infantile hemangioma
Fig. 25
Fig. 25
Congenital hemangioma. Axial CT image (a) in a neonate with prominent proptosis shows a heterogeneous right intraorbital and intracranial mass containing calcifications. Follow-up MRI scan with axial T2-weighted image at a similar level (b) reveals flow voids (arrows) within the heterogenous mass (arrows). Corresponding postcontrast T1-weighted image (c) shows intense enhancement of the lesion, while ADC map (d) demonstrates increased diffusivity (hyperintensity compared to the brain)
Fig. 26
Fig. 26
Plexiform neurofibroma. Sagittal T1-weighted image (a) shows a heterogenous lesion (arrow) in the superior extraconal compartment. There is heterogenous enhancement of the irregular mass (arrow) in the frontal nerve location and mild expansion of the orbit on postcontrast coronal T1-weighted image with fat saturation (b). A more posterior coronal image (c) shows extension of the lesion into the enlarged right cavernous sinus (arrow)
Fig. 27
Fig. 27
Axial postcontrast CT in soft tissue (a) and bone (b) window shows bilateral destructive lesions of the sphenoid wings/dorsolateral orbital walls with associated soft tissue components (arrows) and spiculated periosteal reaction in this patient with neuroblastoma metastases
Fig. 28
Fig. 28
Neuroblastoma metastases. Axial T2-weighted image shows left greater than right expansile masses centered at sphenoid wings with displacement of the globe and intraorbital contents. Striated appearance of the lesions corresponds to the spiculated periosteal reaction
Fig. 29
Fig. 29
Axial T2-weighted image of the orbits (a) shows bilateral homogenous mildly hypointense masses (arrows) centered at the posterior lateral orbital walls/sphenoid wings. There are preserved central hypointense lines in the cortical bone location. Corresponding postcontrast T1-weighted image (b) demonstrates mild homogenous enhancement of the lesions, which also extend into the sphenoid sinuses (arrows). Axial ADC map at a similar level (c) reveals dark signal of the masses, representing very low diffusivity. Acute myeloid leukemia (AML) was diagnosed in this patient presenting with orbital myeloid sarcoma
Fig. 30
Fig. 30
Orbital myeloid sarcoma. Coronal postcontrast CT in soft tissue (a) and bone (b) window and algorithm shows an infiltrative soft tissue mass (arrow) in the inferior left orbit extending to the left maxillary sinus (arrowhead) without bone erosion in this patient with AML
Fig. 31
Fig. 31
Coronal (a) and axial (b) T2-weighted images as well as axial ADC map (c) demonstrate an extraconal slightly heterogeneous mass (arrows) in the superolateral right orbit, likely arising from the lacrimal gland, with compression of the globe. Compared to the normal gland on the left (arrowheads), the lesion shows slightly increased T2 signal and decreased, very low ADC values (hypointense to the brain). The imaging appearances in this patient with acute lymphoblastic leukemia (ALL) are typical for orbital lymphoma, reflecting the similarity of these two mass lesions
Fig. 32
Fig. 32
Coronal postcontrast CT images in soft tissue (a) and bone (b) window and algorithm show a destructive lesion of the left superolateral orbital wall with soft tissue components exhibiting slightly more intense peripheral enhancement (arrows in a) and relatively well-defined bony margins (arrows in b) in this patient with Langerhans cell Histiocytosis (LCH)
Fig. 33
Fig. 33
LCH. Axial nonenhanced CT image in soft tissue window and algorithm (a) shows a slightly hypodense osteolytic lesion (arrow) of the left superolateral orbital wall. Axial CT image at a similar level in bone window and algorithm (b) reveals smooth sharp borders of the destructed bone. Corresponding T2-weighted image (c) shows hyperintensity and a thin dark rim (arrowheads) of the lesion. There is predominantly peripheral enhancement (arrow), which extends into the surrounding tissues (arrowhead) on axial postcontrast T1-weighted image with fat saturation (d). The lesion shows centrally high and peripherally mild hyperintensity compared to the brain, consistent with high ADC values (increased diffusivity) on corresponding ADC map (e)
Fig. 34
Fig. 34
Nonenhanced axial CT image in soft tissue window (a) reveals a right periorbital slightly hyperdense oval subcutaneous mass with central hypodensity (arrow). Coronal CT image in bone window (b) reveals that the lateral periorbital swelling is adjacent to the right frontozygomatic suture (arrow) in this patient with dermoid
Fig. 35
Fig. 35
Dermoid. Axial T1-weighted image of the orbits (a) shows a well-defined mildly hyperintense oval lesion (arrow) in the typical lateral periorbital location. The mass is hyperintense on coronal T2-weighted image (b), without suppression on the corresponding STIR image (c). Arrow in (b) points to the adjacent frontozygomatic suture
Fig. 36
Fig. 36
Intraorbital dermoid. Coronal T2-weighted image through the orbits (a) shows an oval extraconal circumscribed mass (arrow) on the right side, adjacent to the lacrimal gland. The lesion exhibits fat-like hyperintensity (arrow) on sagittal T1-weighted image (b) with complete signal suppression (arrow) on fat saturated axial T2-weighted image (c)

Similar articles

References

    1. Joseph AK, Guerin JB, Eckel LJ, Dalvin LA, Keating GF, Liebo GB, Benson JC, Brinjikji W, Laack NN, Silvera VM (2022) Imaging findings of pediatric orbital masses and tumor mimics. Radiographics 42:880–897. 10.1148/rg.210116 - PubMed
    1. Morris JA, Chiu SS, Rahim TA, Schaffner SR, Bajaj M (2022) An eye for eyes: Pediatric ophthalmologic diseases on MRI. Neurographics 12:103–116
    1. Koc G, Doganay S, Ciraci S, Dogan MS, Karakukcu M, Evereklioglu C, Coskun A (2017) Imaging evaluation of pediatric orbital pathologies. J Ayub Med Coll Abbottabad 29:523–528 - PubMed
    1. Dimaras H, Corson TW (2019) Retinoblastoma, the visible CNS tumor: a review. J Neurosci Res 97:29–44. 10.1002/jnr.24213 - PMC - PubMed
    1. Deike-Hofmann K, von Lampe P, Eerikaeinen M, Ting S, Schlüter S, Schlemmer HP, Bechrakis NE, Forsting M, Radbruch A (2022) Anterior chamber enhancement predicts optic nerve infiltration in retinoblastoma. Eur Radiol 32:7354–7364. 10.1007/s00330-022-08778-4 - PMC - PubMed

MeSH terms