. 2024 Dec 27:13:RP95988.
doi: 10.7554/eLife.95988.

Unveiling chemotherapy-induced immune landscape remodeling and metabolic reprogramming in lung adenocarcinoma by scRNA-sequencing

Affiliations

Unveiling chemotherapy-induced immune landscape remodeling and metabolic reprogramming in lung adenocarcinoma by scRNA-sequencing

Yiwei Huang et al. Elife. .

Abstract

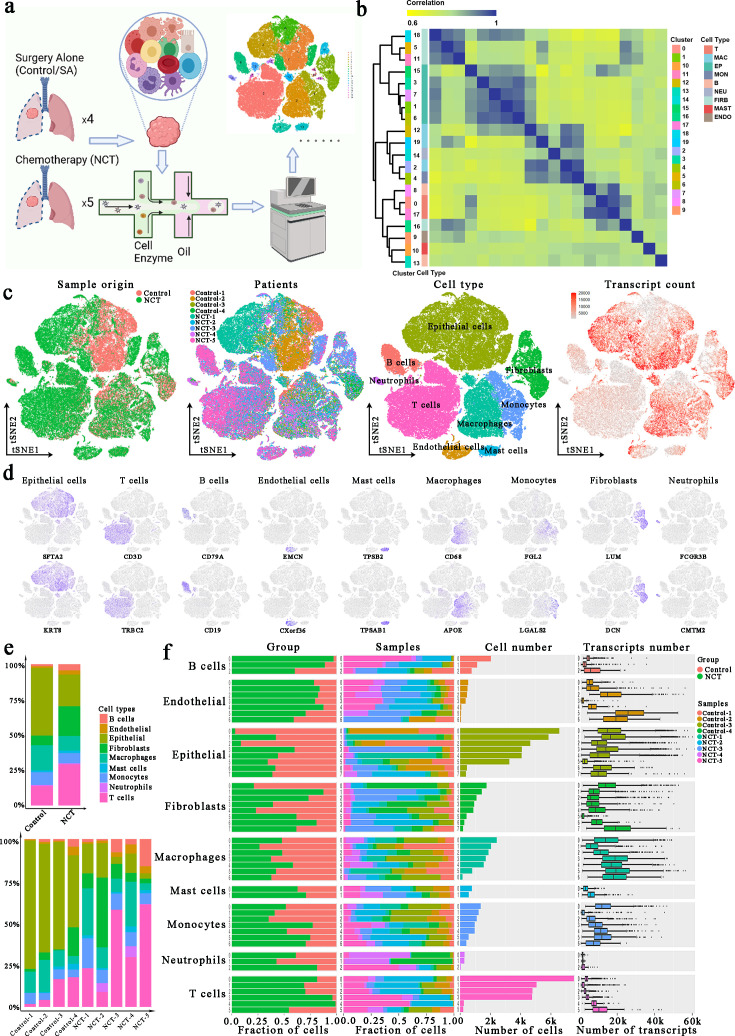
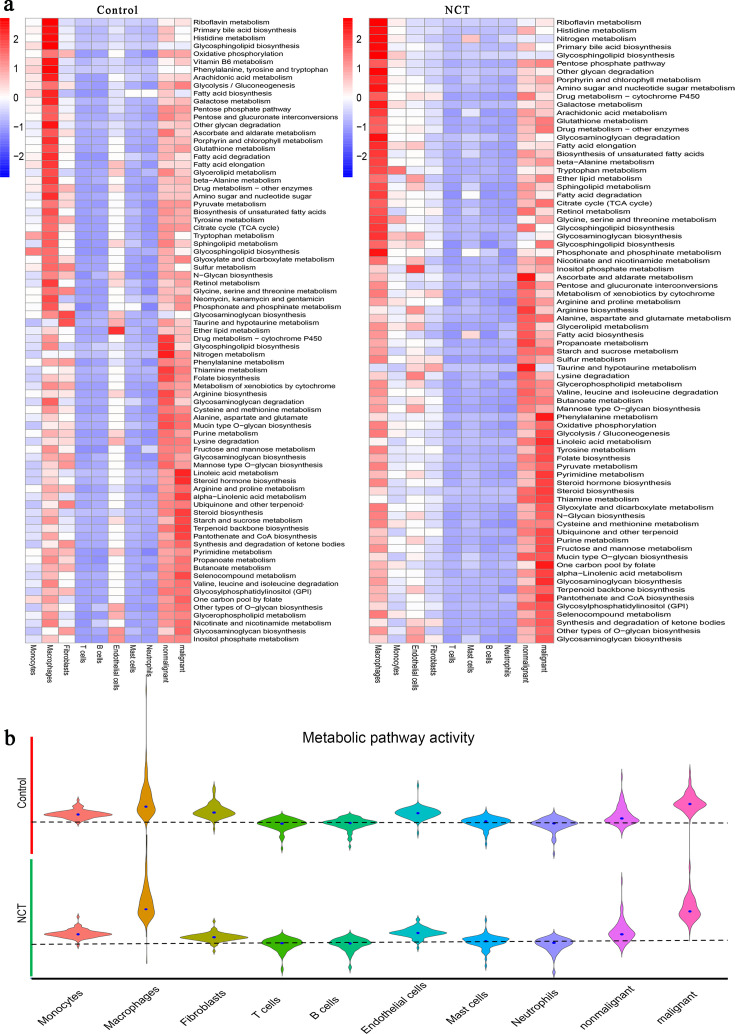
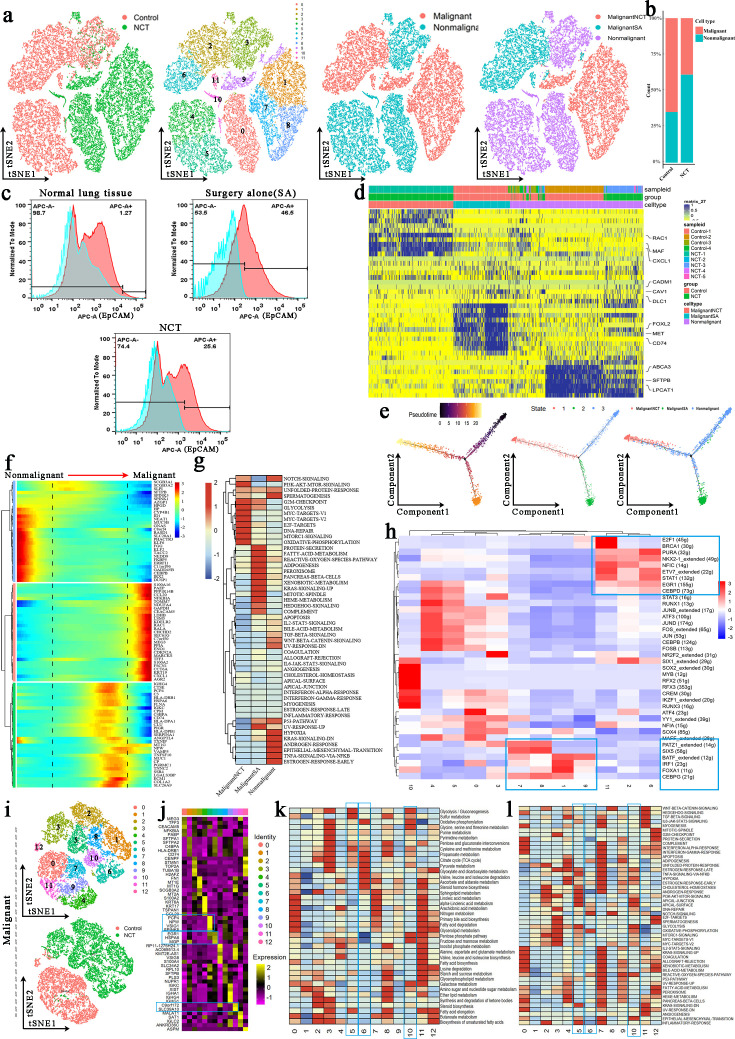
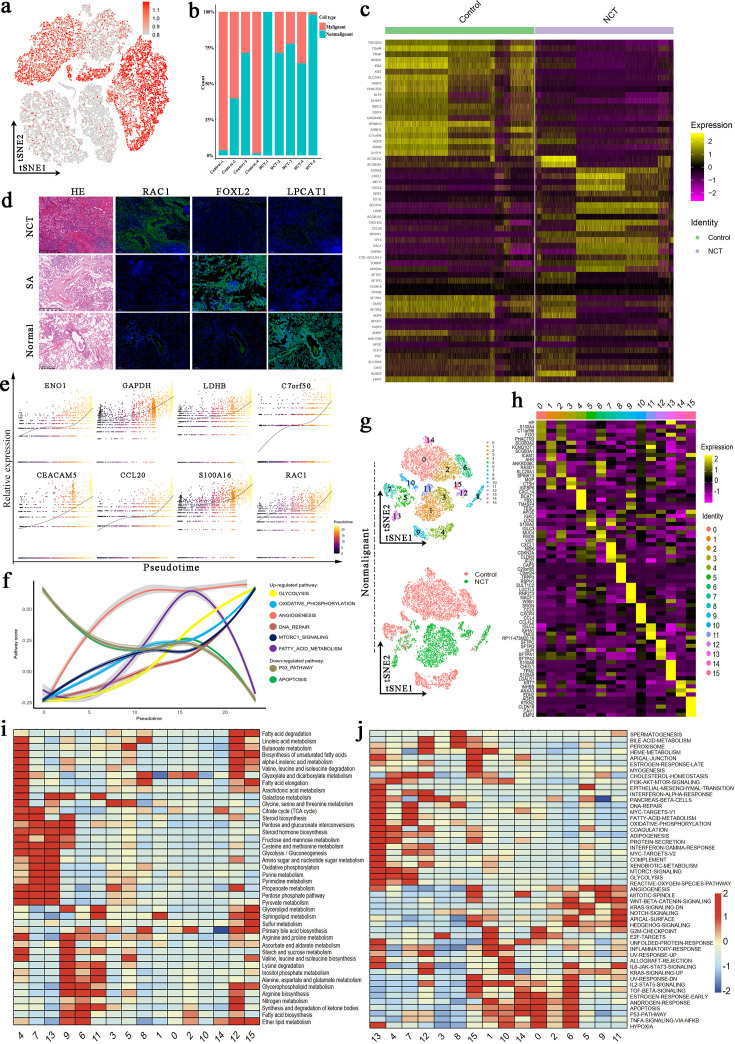
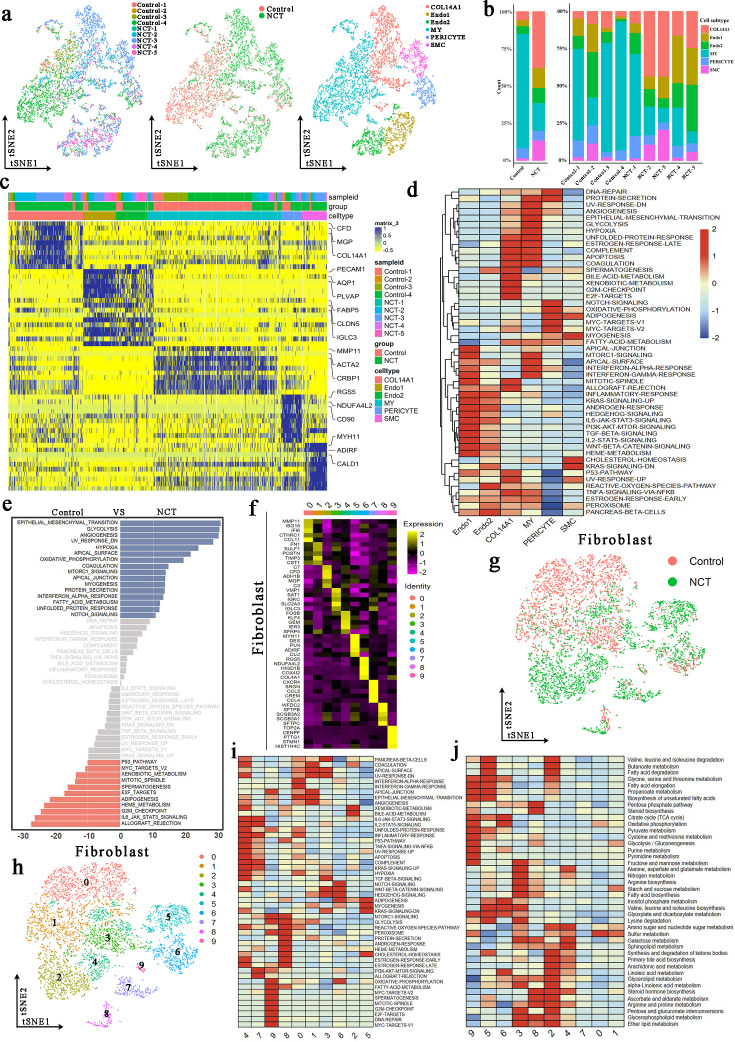
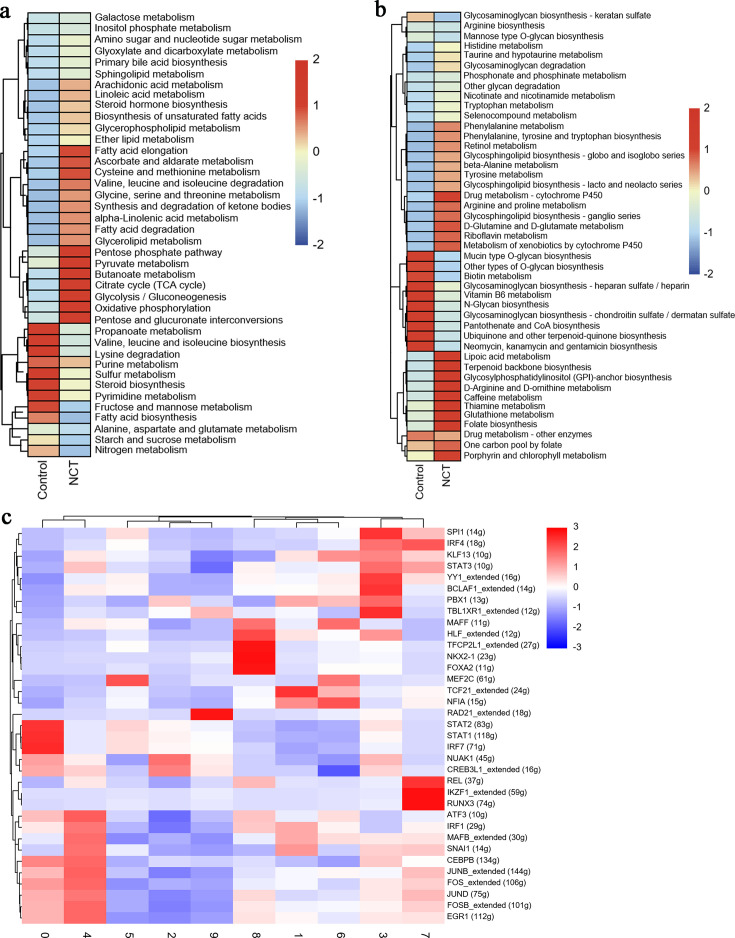
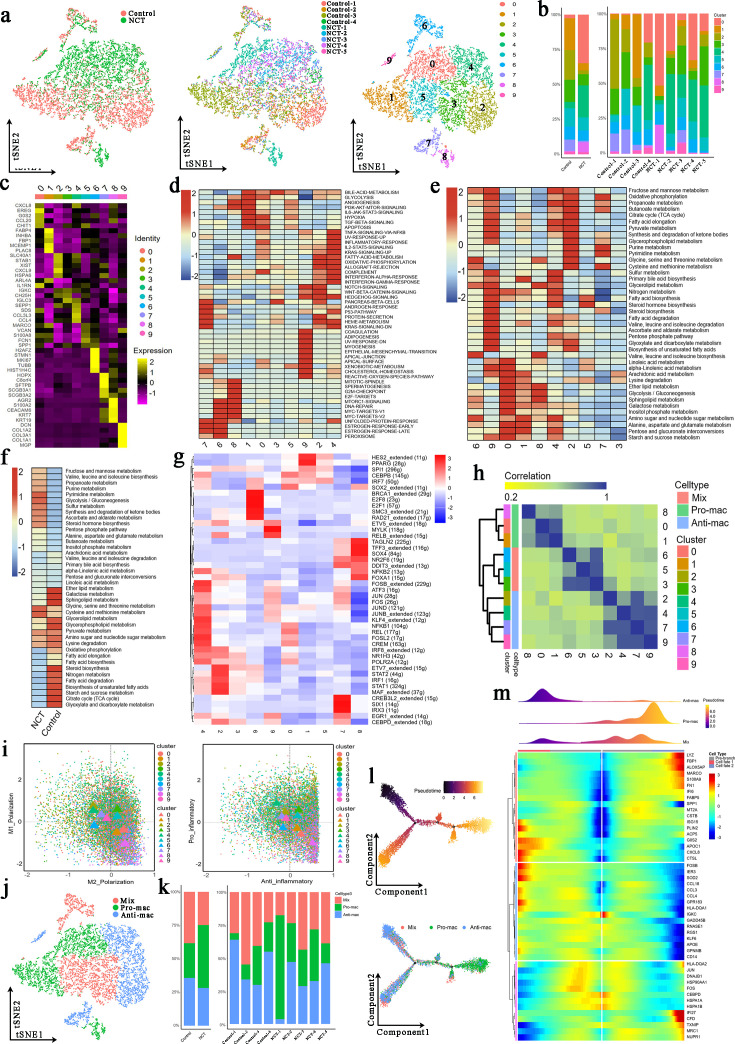
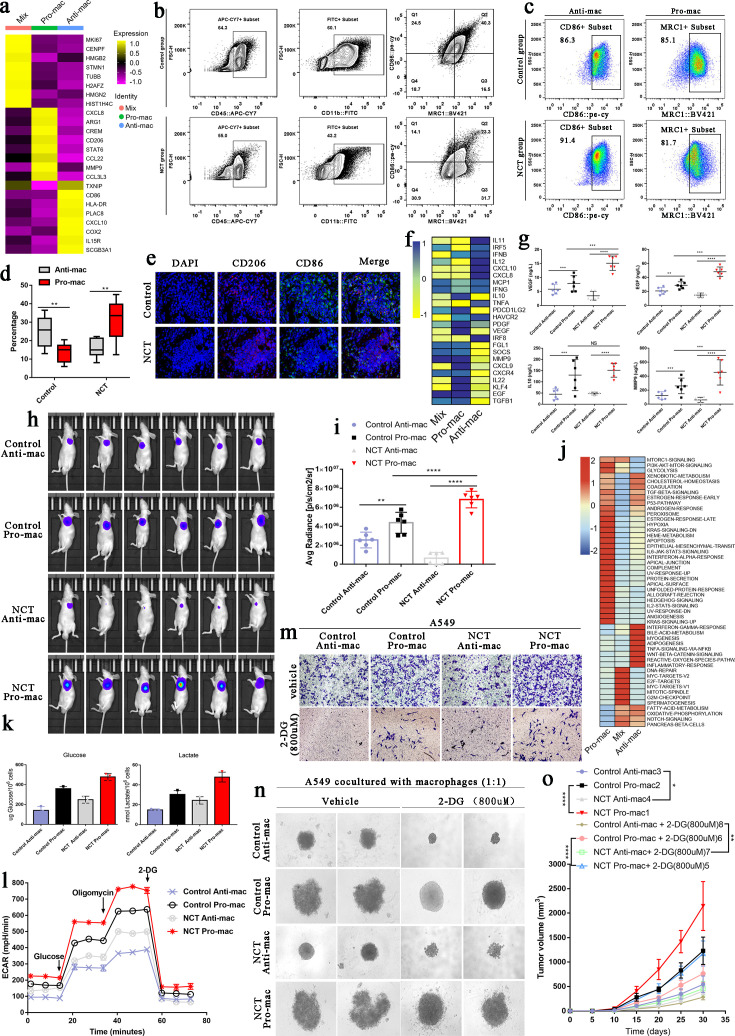
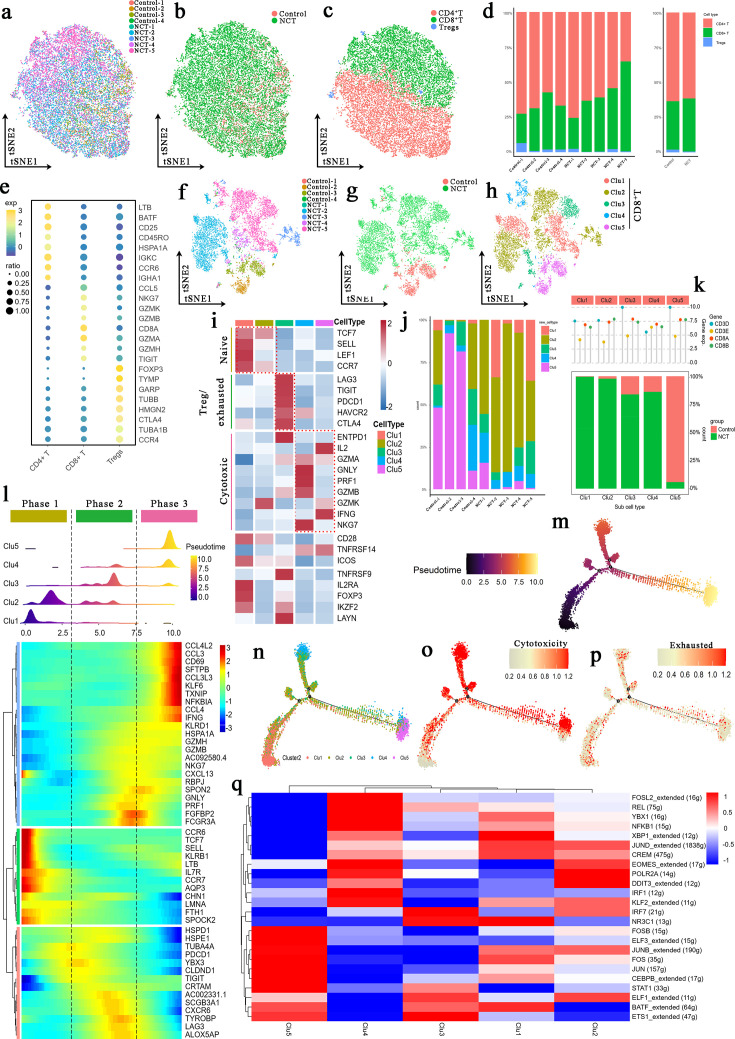
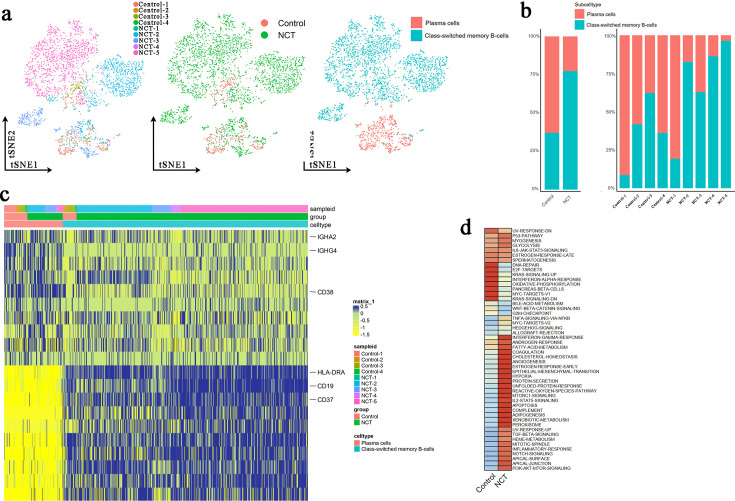
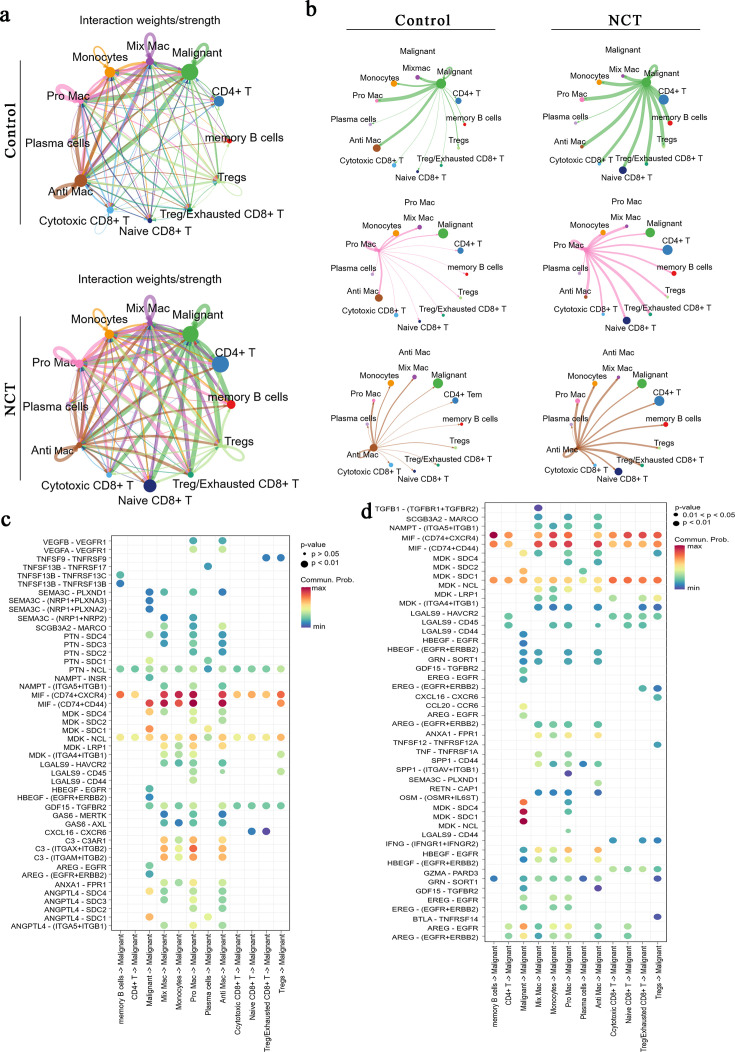
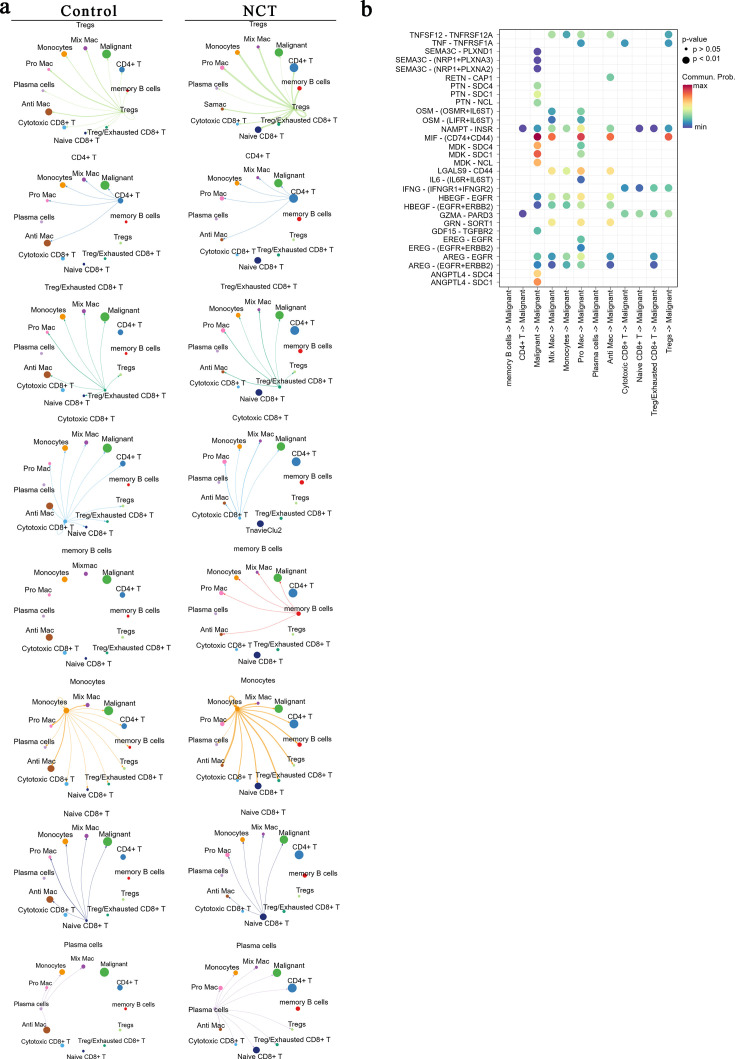
Chemotherapy is widely used to treat lung adenocarcinoma (LUAD) patients comprehensively. Considering the limitations of chemotherapy due to drug resistance and other issues, it is crucial to explore the impact of chemotherapy and immunotherapy on these aspects. In this study, tumor samples from nine LUAD patients, of which four only received surgery and five received neoadjuvant chemotherapy, were subjected to scRNA-seq analysis. In vitro and in vivo assays, including flow cytometry, immunofluorescence, Seahorse assay, and tumor xenograft models, were carried out to validate our findings. A total of 83,622 cells were enrolled for subsequent analyses. The composition of cell types exhibited high heterogeneity across different groups. Functional enrichment analysis revealed that chemotherapy drove significant metabolic reprogramming in tumor cells and macrophages. We identified two subtypes of macrophages: Anti-mac cells (CD45+CD11b+CD86+) and Pro-mac cells (CD45+CD11b+ARG +) and sorted them by flow cytometry. The proportion of Pro-mac cells in LUAD tissues increased significantly after neoadjuvant chemotherapy. Pro-mac cells promote tumor growth and angiogenesis and also suppress tumor immunity. Moreover, by analyzing the remodeling of T and B cells induced by neoadjuvant therapy, we noted that chemotherapy ignited a relatively more robust immune cytotoxic response toward tumor cells. Our study demonstrates that chemotherapy induces metabolic reprogramming within the tumor microenvironment of LUAD, particularly affecting the function and composition of immune cells such as macrophages and T cells. We believe our findings will offer insight into the mechanisms of drug resistance and provide novel therapeutic targets for LUAD in the future.

Keywords: lung adenocarcinoma; cancer biology; human; metabolic reprogramming; neoadjuvant chemotherapy; phenotype atlas.


Conflict of interest statement

YH, GW, GB, LC, JL, ML, HZ, GS, ZH, ZC, ZL, WJ, QW, JX, SY, CZ No competing interests declared

Figures

Figure 1.
Figure 1.. Single-cell atlas of lung adenocarcinoma (LUAD) tissues from the control and neoadjuvant chemotherapy (NCT) group.
(a) Workflow depicting collection and processing of LUAD samples for scRNA-seq analysis. (b) Consensus clustering based on the correlations among the 20 clusters identified through the t-distributed random neighborhood embedding (TSNE) algorithm. (c) tSNE of the 83,622 cells enrolled here, with each cell color indicating: its sample type of origin, the corresponding patient, predicted cell type, and the transcript counts. (d) Expression of marker genes for the cell types defined above each panel. (e) The proportion of each cell type in different groups and samples. (f) For each of the 8 epithelial subclusters and 43 non-epithelial clusters (left to right): the fraction of cells originating from the three groups, the fraction of cells originating from each of the nine patients, the number of cells and box plots of the number of transcripts (with plot center, box, and whiskers corresponding to the median, IQR and 1.5× IQR, respectively).
Figure 1—figure supplement 1.
Figure 1—figure supplement 1.. tSNE clusters and marker genes across cell types.
(a) The t-distributed random neighborhood embedding (TSNE) plots of all clusters in this research. (b) The heatmap shows the marker genes in the different cell types.
Figure 2.
Figure 2.. Metabolic reprogramming in lung adenocarcinoma driven by neoadjuvant chemotherapy (NCT).
(a) The metabolic pathway activities of different cells from the control group and NCT group showed significant differences. (b) The metabolic pathway activity of macrophages and malignant cells increased significantly after chemotherapy.
Figure 3.
Figure 3.. Tumor cells and epithelial cells had significant phenotypic changes before and after chemotherapy.
(a) The t-distributed random neighborhood embedding (TSNE) plots and overview of the tumor cells and epithelial cells. (b) The proportion of malignant cells and nonmalignant cells in the control group and neoadjuvant chemotherapy (NCT) group. (c) Flow cytometry showed that the proportion of malignant cells was significantly reduced after chemotherapy and immunotherapy. (d) Marker genes of MalignantSA cells, MalignantNCT cells, and nonmalignant cells. (e) Pseudotime analysis showed that nonmalignant cells evolved in two directions. (f) The heatmap shows that a series of genes play an important role in transforming epithelial cells into tumor cells. (g) Gene Set Variation Analysis (GSVA) was performed for malignant and nonmalignant cells. (h) Single-Cell Regulatory Network Inference and Clustering (SCENIC) analysis revealed the hub genes in the malignant transformation of epithelial cells. (i) The tSNE plots for reclustered malignant cells. (j) Marker genes of 13 subclusters from malignant cells. (k) Metabolic characteristics in different malignant cell subclusters. (l) GSVA reveals the characteristics of pathway activity in different malignant cell subclusters.
Figure 3—figure supplement 1.
Figure 3—figure supplement 1.. CNVs, gene expression, and pathway activity of malignant and nonmalignant epithelial cells.
(a) Copy number variations (CNVs) of malignant and nonmalignant epithelial cells. (b) The proportion of malignant cells and nonmalignant cells from different patients. (c) The heatmap shows differentially expressed genes of epithelial cells in the control group and neoadjuvant chemotherapy (NCT) group. (d) Immunofluorescence shows LPCAT1, FOXL2, and RAC1 were highly expressed in normal lung tissues, the control group, and the NCT group, respectively. (e) Some genes played an important role in the transformation of epithelial cells into tumor cells. (f) Changes in the activity of several important pathways during the transformation of epithelial cells to tumor cells. (g) The t-distributed random neighborhood embedding (TSNE) plots and overview of the nonmalignant cells. (h) Heatmap of marker genes for nonmalignant cells subclusters. (i) Metabolic characteristics in different nonmalignant cell subclusters. (j) Gene Set Variation Analysis (GSVA) reveals the characteristics of pathway activity in different nonmalignant cell subclusters.
Figure 4.
Figure 4.. The scRNA profile of stromal cells derived from lung adenocarcinoma (LUAD) samples in the control and neoadjuvant chemotherapy (NCT) groups.
(a) The t-distributed random neighborhood embedding (TSNE) plots an overview of the six clusters of stromal cells. (b) Proportions of the six predicted clusters of stromal cells in different groups and samples. (c) Heatmap exhibiting the expression level of marker genes in each stromal cell cluster. (d) Gene Set Variation Analysis (GSVA) estimated the pathway activation levels of different stromal cell subtypes. The scores have been normalized. (e) GSVA revealed the activation level of hallmark pathways in stromal cells (control vs. NCT groups) (f) Heatmap exhibiting the expression level of marker genes in each fibroblast cluster. (g, h) The tSNE plots reveal the group origins (g) and predicted subclusters (h) of fibroblast. (i, j) GSVA estimated the pathway activation levels of different fibroblast subtypes.
Figure 4—figure supplement 1.
Figure 4—figure supplement 1.. Metabolic and transcriptional analysis of fibroblasts.
(a) The activity of various metabolic processes in fibroblasts from the control group and neoadjuvant chemotherapy (NCT) group. (b) Gene Set Variation Analysis (GSVA) was performed for fibroblasts from the control group and NCT group. (c) Single-Cell Regulatory Network Inference and Clustering (SCENIC) analysis revealed the hub genes in fibroblast.
Figure 5.
Figure 5.. Three newly identified subtypes of tumor-associated macrophages (TAMs) display distinct genetic and metabolic features.
(a) The t-distributed random neighborhood embedding (TSNE) plots show the group origins, sample origins, and clusters of TAMs. (b) Proportions of the 10 clusters of TAMs in different groups and samples. (c) Marker genes of the 10 clusters of TAMs. (d) Gene Set Variation Analysis (GSVA) was performed for the 10 clusters of TAMs. (e) The activity of various metabolic processes in the 10 clusters of TAMs. (f) GSVA was performed for TAMs from the control group and neoadjuvant chemotherapy (NCT) group. (g) Single-Cell Regulatory Network Inference and Clustering (SCENIC) analysis was performed for the 10 clusters of TAMs. (h) Consensus clustering based on the correlations among the 10 clusters of TAMs identified through the tSNE algorithm. (i) Polarization score (left) and inflammatory score (right) for 10 clusters of TAMs based on the expression of polarization marker genes and inflammatory genes. (j) The tSNE plots for three types of TAMs. (k) Proportions of the three subtypes of TAMs in different groups and samples. (l) Development trajectory analysis for the three subtypes of TAMs. (m) Pseudotime analysis revealed a series of genes that affect the differentiation and development of macrophages.
Figure 6.
Figure 6.. Metabolic switching in tumor-associated macrophages (TAMs) contributed to diametrical effects on tumor cells.
(a) The heatmap shows the essential marker genes for three subtypes of TAMs. (b) Based on Pro-mac and Anti-mac marker genes, these two types of cells were sorted by flow cytometry from lung adenocarcinoma tissue. (c) Flow cytometry verified the sorted cells. (d) The proportion changes of Pro-mac and Anti-mac cells in lung adenocarcinoma tissues before and after chemotherapy. (e) Immunofluorescence showed the changes in the proportion of TAMs with high CD206 and CD86 after neoadjuvant therapy. (f) The heatmap shows the differences in the cytokines secreted by the three subtypes of macrophages. (g) ELISA detected the secretion of VEGF, EGF, IL10, and MMP9. (h) The intensity of fluorescence changes in Luciferase-labeled A549 cells mixed with different TAMs. (i) The histogram shows the average fluorescence intensity emitted by the subcutaneous tumor. (j) Gene Set Variation Analysis (GSVA) performed for Pro-mac, Anti-mac, and Mix. (k) Glucose uptake and lactate production in the TAMs cell subtypes. (l) Seahorse XFe96 cell outflow analyzer detected the glycolysis level of TAMs cell subtypes (extracellular acidification rate: ECAR). (m) Transwell experiment detected the influence of TAMs subtypes on the invasion ability of A549 cells. (n) The 3D cell culture experiment detected the effect of 2-DG on the spheroidization ability of A549 cells when cultured with subtypes of TAMs. (o) In vivo experiments verified the effect of 2-DG on the tumorigenesis ability of A549 after inhibiting glycolysis of TAMs. All error bars are mean ± SD. NS, not significant. ***p<0.001, **p<0.01, *p<0.05; determined by two-tailed Student’s t-test (95% CI).
Figure 6—figure supplement 1.
Figure 6—figure supplement 1.. The scRNA profile of T cells derived from lung adenocarcinoma (LUAD) samples in the control, neoadjuvant chemotherapy, and immunotherapy groups.
(a–c) The t-distributed random neighborhood embedding (TSNE) plots reveal the sample origins (a), group origins (b), and predicted clusters (c) of T cells. (d) The three indicated clusters of T cells (CD4+ T, CD8+ T, and Tregs) were reported in different groups and samples. (e) Bubble plot exhibiting the expression level of marker genes in each T cell cluster. (f–h) The tSNE plots reveal the sample origins (f), group origins (g), and predicted subclusters (h) of CD8+ T cells. (i) Heatmap exhibiting the expression level of marker genes corresponding to naïve, Treg/exhausted, and cytotoxic phenotypes in each CD8+ T cell subcluster. (j, k) Proportions of the five predicted clusters of CD8+ T cells in different samples (j) and groups (k). (l) Dynamic changes in gene expression of CD8+ T cells during the transition (divided into three phases). (m–p) Pseudotime-ordered analysis of CD8+ T cells (m–n) revealing the dynamics of their cytotoxic (o) and exhausted levels (p). (l) Single-Cell Regulatory Network Inference and Clustering (SCENIC) analysis of CD8+ T cells.
Figure 6—figure supplement 2.
Figure 6—figure supplement 2.. The scRNA profile of B cells derived from lung adenocarcinoma (LUAD) samples in the control, neoadjuvant chemotherapy, and immunotherapy groups.
(a) The t-distributed random neighborhood embedding (TSNE) plots reveal the sample origins, group origins, and predicted clusters of B cells. (b) The two predicted clusters of B cells (plasma cells, class-switched memory B-cells) were reported in different groups and samples. (c) Heatmap exhibiting the expression level of marker genes in each B cell cluster. (d) Gene Set Variation Analysis (GSVA) estimated the pathway activation levels of different B cell subtypes.
Figure 6—figure supplement 3.
Figure 6—figure supplement 3.. Crosstalk between cancer and immune cells.
(a) Overview of selected ligand–receptor interactions of cancer cells and immune cells in the control and neoadjuvant chemotherapy (NCT) groups. The line thickness indicates the number of ligands when cognate receptors are present in the recipient cell type. The loops indicate autocrine circuits. (b) Detailed view of the ligands expressed by each cell type and the other cell types. (c, d) Bubble plot revealing the specific ligand–receptor interactions between cancer cells and immune cells in the NCT group. The circle size indicates p values, with the scale to the right (permutation test), and color indicates communication probability.
Figure 6—figure supplement 4.
Figure 6—figure supplement 4.. Crosstalk between cancer and immune cells.
(a) Each cell type and the other cell types expressed some of the ligands. (b) Bubble plot revealing the specific ligand–receptor interactions between cancer cells and immune cells in the control group. The circle size indicates p-values, with the scale to the right (permutation test), and color indicates communication probability.

Update of

  • doi: 10.1101/2024.02.18.580893
  • doi: 10.7554/eLife.95988.1
  • doi: 10.7554/eLife.95988.2

Similar articles

Cited by

References

    1. Anand P, Guillaumet-Adkins A, Dimitrova V, Yun H, Drier Y, Sotudeh N, Rogers A, Ouseph MM, Nair M, Potdar S, Isenhart R, Kloeber JA, Vijaykumar T, Niu L, Vincent T, Guo G, Frede J, Harris MH, Place AE, Silverman LB, Teachey DT, Lane AA, DeAngelo DJ, Aster JC, Bernstein BE, Lohr JG, Knoechel B. Single-cell RNA-seq reveals developmental plasticity with coexisting oncogenic states and immune evasion programs in ETP-ALL. Blood. 2021;137:2463–2480. doi: 10.1182/blood.2019004547. - DOI - PMC - PubMed
    1. Aran D, Looney AP, Liu L, Wu E, Fong V, Hsu A, Chak S, Naikawadi RP, Wolters PJ, Abate AR, Butte AJ, Bhattacharya M. Reference-based analysis of lung single-cell sequencing reveals a transitional profibrotic macrophage. Nature Immunology. 2019;20:163–172. doi: 10.1038/s41590-018-0276-y. - DOI - PMC - PubMed
    1. Bernhagen J, Krohn R, Lue H, Gregory JL, Zernecke A, Koenen RR, Dewor M, Georgiev I, Schober A, Leng L, Kooistra T, Fingerle-Rowson G, Ghezzi P, Kleemann R, McColl SR, Bucala R, Hickey MJ, Weber C. MIF is a noncognate ligand of CXC chemokine receptors in inflammatory and atherogenic cell recruitment. Nature Medicine. 2007;13:587–596. doi: 10.1038/nm1567. - DOI - PubMed
    1. Bondarenko M, Le Grand M, Shaked Y, Raviv Z, Chapuisat G, Carrère C, Montero MP, Rossi M, Pasquier E, Carré M, André N. Metronomic chemotherapy modulates clonal interactions to prevent drug resistance in non-small cell lung cancer. Cancers. 2021;13:2239. doi: 10.3390/cancers13092239. - DOI - PMC - PubMed
    1. Butler EB, Zhao Y, Muñoz-Pinedo C, Lu J, Tan M. Stalling the engine of resistance: targeting cancer metabolism to overcome therapeutic resistance. Cancer Research. 2013;73:2709–2717. doi: 10.1158/0008-5472.CAN-12-3009. - DOI - PMC - PubMed

MeSH terms

Substances