The Carbon Footprint of Hospital Services and Care Pathways: A State-of-the-Science Review
- PMID: 39729358
- PMCID: PMC11675664
- DOI: 10.1289/EHP14754
The Carbon Footprint of Hospital Services and Care Pathways: A State-of-the-Science Review
Abstract
Background: Climate change is the 21st century's biggest global health threat, endangering health care systems worldwide. Health care systems, and hospital care in particular, are also major contributors to greenhouse gas emissions.
Objectives: This study used a systematic search and screening process to review the carbon footprint of hospital services and care pathways, exploring key contributing factors and outlining the rationale for chosen services and care pathways in the studies.
Methods: This state-of-the-science review searched the MEDLINE (Ovid), Embase (Ovid), CINAHL (EBSCOhost), GreenFILE (EBSCOhost), Web of Science, Scopus, and the HealthcareLCA databases for literature published between 1 January 2000 and 1 January 2024. Gray literature was considered up to 1 January 2024. Inclusion criteria comprised original research reporting on the carbon footprint of hospital services or care pathways. Quality of evidence was assessed according to the guidelines for critical review of product life cycle assessment (LCA). PROSPERO registration number: CRD42023398527.
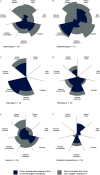
Results: Of 5,415 records, 76 studies were included, encompassing 151 hospital services and care pathways across multiple medical specialties. Reported carbon footprints varied widely, from carbon dioxide () equivalents () for an hour of intravenously administered anesthesia to 10,200 for a year of hemodialysis treatment. Travel, facilities, and consumables were key contributors to carbon footprints, whereas waste disposal had a smaller contribution. Relative importance of carbon hotspots differed per service, pathway, medical specialty, and setting. Studies employed diverse methodologies, including different LCA techniques, functional units, and system boundaries. A quarter of the studies lacked sufficient quality.
Discussion: Hospital services and care pathways have a large climate impact. Quantifying the carbon footprint and identifying hotspots enables targeted and prioritized mitigation efforts. Even for similar services, the carbon footprint varies considerably between settings, underscoring the necessity of localized studies. The emerging field of health care sustainability research faces substantial methodological heterogeneity, compromising the validity and reproducibility of study results. This review informs future carbon footprint studies by highlighting understudied areas in hospital care and providing guidance for selecting specific services and pathways. https://doi.org/10.1289/EHP14754.
Figures


Similar articles
-
The carbon footprint of critical care: a systematic review.Intensive Care Med. 2024 May;50(5):731-745. doi: 10.1007/s00134-023-07307-1. Epub 2024 Feb 28. Intensive Care Med. 2024. PMID: 38416200
-
The carbon footprint of surgical operations: a systematic review update.Ann R Coll Surg Engl. 2023 Nov;105(8):692-708. doi: 10.1308/rcsann.2023.0057. Ann R Coll Surg Engl. 2023. PMID: 37906978 Free PMC article.
-
Climate footprint of industry-sponsored in-human clinical trials: life cycle assessments of clinical trials spanning multiple phases and disease areas.BMJ Open. 2025 Feb 19;15(2):e085364. doi: 10.1136/bmjopen-2024-085364. BMJ Open. 2025. PMID: 39971605 Free PMC article.
-
Beyond the black stump: rapid reviews of health research issues affecting regional, rural and remote Australia.Med J Aust. 2020 Dec;213 Suppl 11:S3-S32.e1. doi: 10.5694/mja2.50881. Med J Aust. 2020. PMID: 33314144
-
The carbon footprint of the Chinese health-care system: an environmentally extended input-output and structural path analysis study.Lancet Planet Health. 2019 Oct;3(10):e413-e419. doi: 10.1016/S2542-5196(19)30192-5. Lancet Planet Health. 2019. PMID: 31625513
Cited by
-
Sustainable development goals: a call for future internal medicine.Intern Emerg Med. 2025 Aug;20(5):1329-1338. doi: 10.1007/s11739-025-03941-3. Epub 2025 Apr 11. Intern Emerg Med. 2025. PMID: 40214923 Free PMC article. Review.
-
Invited Perspective: Accelerating Action toward Carbon-Neutral Hospital Care.Environ Health Perspect. 2024 Dec;132(12):121301. doi: 10.1289/EHP16623. Epub 2024 Dec 27. Environ Health Perspect. 2024. PMID: 39729357 Free PMC article. No abstract available.
-
Clinical and patient-reported outcomes of self-administered outpatient parenteral antimicrobial treatment (S-OPAT): a scoping review.Infection. 2025 May 12. doi: 10.1007/s15010-025-02549-1. Online ahead of print. Infection. 2025. PMID: 40354030
References
-
- Romanello M, di Napoli C, Green C, Kennard H, Lampard P, Scamman D, et al. . 2023. The 2023 report of the Lancet Countdown on health and climate change: the imperative for a health-centred response in a world facing irreversible harms. Lancet 402(10419):2346–2394, PMID: 37977174, 10.1016/S0140-6736(23)01859-7. - DOI - PMC - PubMed
-
- Pichler P-P, Jaccard IS, Weisz U, Weisz H. 2019. International comparison of health care carbon footprints. Environ Res Lett 14(6):064004, 10.1088/1748-9326/ab19e1. - DOI
Publication types
MeSH terms
LinkOut - more resources
Full Text Sources
Medical
Research Materials

