. 2025 Feb 28;10(2):725-740.
doi: 10.1021/acssensors.4c02070. Epub 2024 Dec 27.

MicroMetaSense: Coupling Plasmonic Metasurfaces with Fluorescence for Enhanced Detection of Microplastics in Real Samples

Affiliations

MicroMetaSense: Coupling Plasmonic Metasurfaces with Fluorescence for Enhanced Detection of Microplastics in Real Samples

Emre Ece et al. ACS Sens. .

Abstract

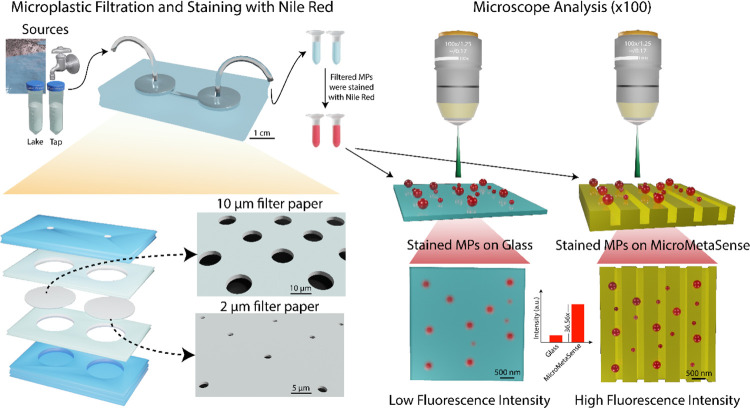
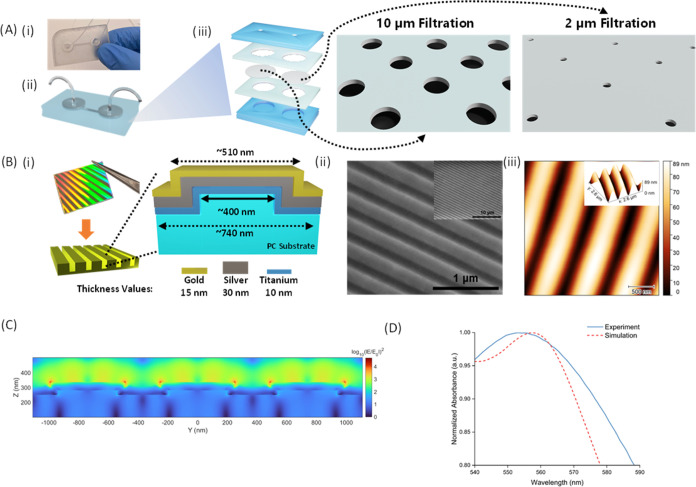
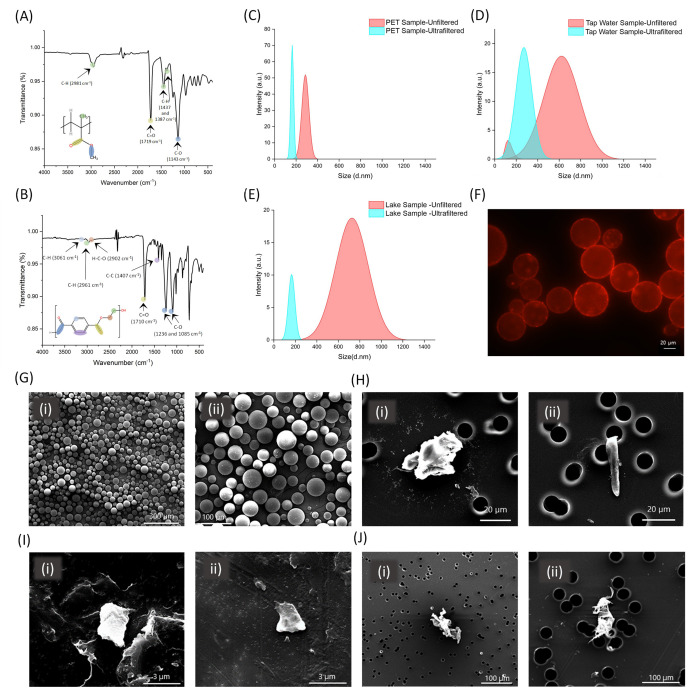
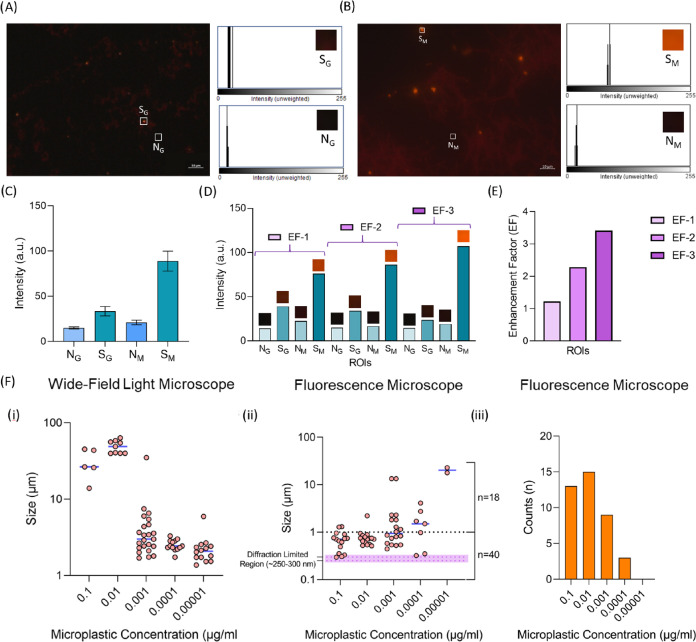
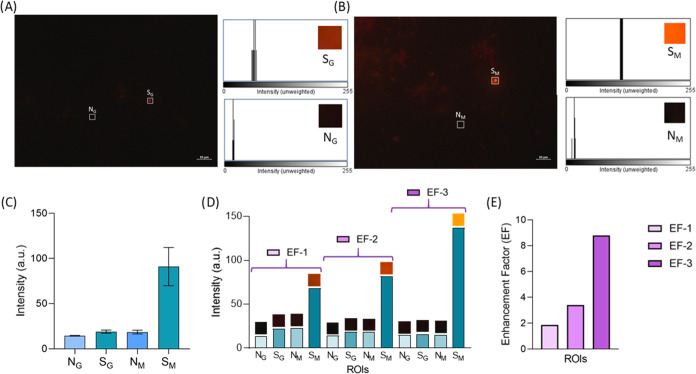
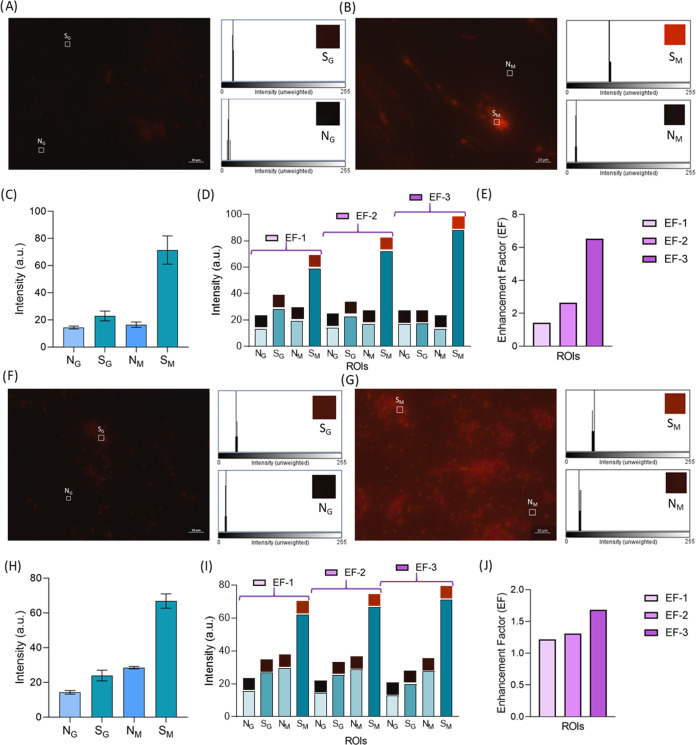
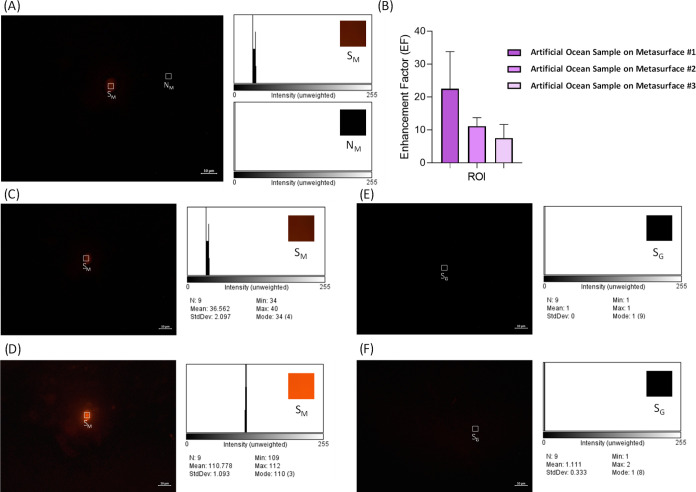
Diverse analytical techniques are employed to scrutinize microplastics (MPs)─pervasive at hazardous concentrations across diverse sources ranging from water reservoirs to consumable substances. The limitations inherent in existing methods, such as their diminished detection capacities, render them inadequate for analyzing MPs of diminutive dimensions (microplastics: 1-5 μm; nanoplastics: < 1 μm). Consequently, there is an imperative need to devise methodologies that afford improved sensitivity and lower detection limits for analyzing these pollutants. In this study, we introduce a holistic strategy, i.e., MicroMetaSense, reliant on a metal-enhanced fluorescence (MEF) phenomenon in detecting a myriad size and types of MPs (i.e., poly(methyl methacrylate) (PMMA) and poly(ethylene terephthalate) (PET)) down to 183-205 fg, as well as validated the system with real samples (tap and lake) and artificial ocean samples as a real-world scenario. To obtain precise size distribution in nanometer scale, MPs are initially processed with an ultrafiltration on-a-chip method, and subsequently, the MPs stained with Nile Red dye are subjected to meticulous analysis under a fluorescence microscope, utilizing both a conventional method (glass substrate) and the MicroMetaSense platform. Our approach employs a metasurface to augment fluorescence signals, leveraging the MEF phenomenon, and it demonstrates an enhancement rate of 36.56-fold in detecting MPs compared to the standardized protocols. This low-cost ($2), time-saving (under 30 min), and highly sensitive (183-205 femtogram) strategy presents a promising method for precise size distribution and notable improvements in detection efficacy not only for laboratory samples but also in real environmental samples; hence, signifying a pivotal advancement in conventional methodologies in MP detection.

Keywords: fluorescence microscopy; metal-enhanced fluorescence; microplastics; nanoplastics; plasmonic metasurfaces.


Conflict of interest statement

The authors declare no competing financial interest.

Figures

Figure 1
Figure 1
Workflow includes the ultrafiltration of MPs on a microfluidic chip, and subsequently analyses of Nile Red-stained MPs on the MicroMetaSense platform by demonstrating their dimensions with representative scale bars. As a conventional system, the results derived from a glass substrate are compared with the ones from our platform.
Figure 2
Figure 2
(A) (i) A photograph of the ultrafiltration chip is shown. (ii) On the right side of the photograph, a schematic for the chip components is presented, depicting different filter sizes on both the inlet and outlet ports (iii). (B) (i) MicroMetaSense consists of polycarbonate (PC) substrates and layer-by-layer metal coatings, i.e., titanium (10 nm), silver (30 nm), and gold (15 nm). The surface of MicroMetaSense features continuous and periodic grating structures with an approximate periodicity of ∼740 nm and spacing of ∼450 nm without metal coatings and ∼510 nm with metal coatings. The topography of the MicroMetaSense is demonstrated by SEM (ii) and AFM (iii). (C) Electric-field distribution of MicroMetaSense is numerically analyzed using the FDTD method. (D) Normalized absorption spectrum of the simulated MicroMetaSense demonstrates results consistent with the experimental data.
Figure 3
Figure 3
FTIR analyses of (A) PMMA and (B) PET MPs are presented. (C) Size distribution (d. nm) and intensity (%) of (C) PET, (D) tap MPs, and (E) lake MPs before and after ultrafiltration steps are measured. (F) Nile Red-stained PMMA MPs are imaged using an inverted microscope. SEM images of (G) PMMA MPs, (H) trapped PET MPs, (I) tap MPs, and (J) lake MPs are demonstrated.
Figure 4
Figure 4
Upright fluorescence imaging and size analysis of PMMA MPs are presented. The fluorescence images of Nile Red-stained PMMA MPs are examined under (A) glass substrate and (B) MicroMetaSense at 100× magnification. The fluorescent images include two different types of ROIs: one for measuring the MP fluorescent signal (S) and another for measuring the background noise (N). The grayscale intensity values in these ROIs are measured for MP fluorescence signal (SG and SM) and background noise (NG and NM). The histogram plots of the measurements are placed next to the fluorescence images. (C) Mean value of grayscale intensity values of NG, SG, NM, and SM for PMMA MPs are plotted in a bar graph using five different ROIs for each S and N. (D) EFs on a set of ROIs are demonstrated, capturing S and N for PMMA MPs on both the glass substrate and MicroMetaSense. (E) Calculated EFs for PMMA MPs are demonstrated on a bar graph. (F) The number of PMMA MPs are visually sorted by the particle size across a range of serial dilutions (up to 104 times dilution factor). The size distribution of PMMA MPs is determined on a micron scale using (i) wide-field light microscope and down to diffraction-limited region (250–350 nm) using (ii) fluorescence microscope. (iii) The number of detected submicron PMMA NPs at each dilution is separately displayed on a bar graph.
Figure 5
Figure 5
Upright fluorescence imaging of PET MPs is presented. The fluorescence images of Nile Red-stained PET MPs are examined under (A) glass substrate and (B) MicroMetaSense at 100× magnification. (C) Mean values of grayscale intensity of NG, SG, NM, and SM for PET MPs are plotted in a bar graph using five different ROIs for each S and N. (D) EFs on a set of ROIs are demonstrated, with S and N for PET MPs captured on both the glass substrate and MicroMetaSense. (E) Bar graph provides a summarized depiction of the EFs for the PET MPs.
Figure 6
Figure 6
Upright fluorescence imaging of tap and lake samples are presented. Nile Red-stained tap samples are examined under (A) glass substrate and (B) MicroMetaSense at 100× magnification. (C) Mean value of grayscale intensity values of NG, SG, NM, and SM for tap samples are plotted in a bar graph using five different ROIs for each S and N. (D) EFs on a set of ROIs are demonstrated, with S and N for tap samples captured on both the glass substrate and MicroMetaSense. (E) Bar graph provides a summarized depiction of the EFs for tap samples. Nile Red-stained lake samples are examined under (F) glass substrate and (G) MicroMetaSense at 100× magnification. (H) Mean values of grayscale intensity values of NG, SG, NM, and SM for lake samples are plotted in a bar graph using five different ROIs for each S and N. (I) EFs on a set of ROIs are demonstrated, with S and N for lake samples captured on both the glass substrate and MicroMetaSense. (J) Bar graph provides a summarized depiction of the EFs for lake samples.
Figure 7
Figure 7
Upright fluorescence imaging of MP-loaded artificial ocean water is presented. (A) SM and NM intensity values of MPs on MicroMetaSense are calculated. (B) Using three MicroMetaSense surfaces produced by the same method, five measurements per surface are taken. (C) 20% and (D) 100% intensity levels are utilized to observe the MPs on MicroMetaSense. (E) A 20% and (F) 100% intensity levels were utilized for MP detection on glass, but no MPs are observed.

Similar articles

References

    1. Tudor V. C.; Marin A.; Vasca D. Z.; Micu M. M.; Smedescu D. I. The Influence of the Plastic Bags on the Environment. Mater. Plast. 2018, 55 (4), 595.10.37358/MP.18.4.5081. - DOI
    1. Gaylarde C.; Baptista-Neto J. A.; da Fonseca E. M. Plastic Microfibre Pollution: How Important Is Clothes’ Laundering?. Heliyon 2021, 7 (5), e0710510.1016/j.heliyon.2021.e07105. - DOI - PMC - PubMed
    1. Ncube L. K.; Ude A. U.; Ogunmuyiwa E. N.; Zulkifli R.; Beas I. N. An Overview of Plastic Waste Generation and Management in Food Packaging Industries. Recycling 2021, 6 (1), 12.10.3390/recycling6010012. - DOI
    1. Wright S. L.; Rowe D.; Thompson R. C.; Galloway T. S. Microplastic Ingestion Decreases Energy Reserves in Marine Worms. Curr. Biol. 2013, 23 (23), R1031–R1033. 10.1016/j.cub.2013.10.068. - DOI - PubMed
    1. Thomas P. J.; Oral R.; Pagano G.; Tez S.; Toscanesi M.; Ranieri P.; Trifuoggi M.; Lyons D. M. Mild Toxicity of Polystyrene and Polymethylmethacrylate Microplastics in Paracentrotus Lividus Early Life Stages. Mar. Environ. Res. 2020, 161, 10513210.1016/j.marenvres.2020.105132. - DOI - PubMed

Publication types

MeSH terms

LinkOut - more resources