

A Software Tool for Rapid and Automated Preprocessing of Large-Scale Serum Metabolomic Data by Multisegment Injection-Capillary Electrophoresis-Mass Spectrometry
- PMID: 39729551
- PMCID: PMC11740174
- DOI: 10.1021/acs.analchem.4c03513
A Software Tool for Rapid and Automated Preprocessing of Large-Scale Serum Metabolomic Data by Multisegment Injection-Capillary Electrophoresis-Mass Spectrometry
Abstract
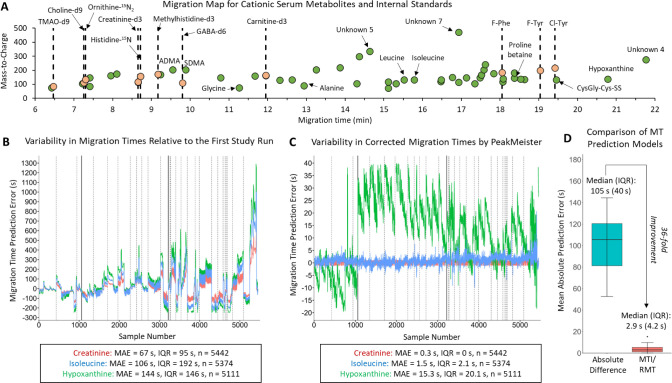
Mass spectrometry (MS)-based metabolomics often rely on separation techniques when analyzing complex biological specimens to improve method resolution, metabolome coverage, quantitative performance, and/or unknown identification. However, low sample throughput and complicated data preprocessing procedures remain major barriers to affordable metabolomic studies that are scalable to large populations. Herein, we introduce PeakMeister as a new software tool in the R statistical environment to enable standardized processing of serum metabolomic data acquired by multisegment injection-capillary electrophoresis-mass spectrometry (MSI-CE-MS), a high-throughput separation platform (<4 min/sample) which takes advantage of a serial injection format of 13 samples within a single analytical run. We performed a rigorous validation of PeakMeister by analyzing 47 cationic metabolites consistently measured in 5,000 serum and 420 quality control samples from the Brazilian National Survey on Child Nutrition (ENANI-2019) comprising a total of 224,983 metabolite peaks acquired in 40 days across three batches over an eight-month period. A migration time index using a panel of 11 internal standards was introduced to correct for large variations in migration times, which allowed for reliable peak annotation, peak integration, and sample position assignment for serum metabolites having two flanking internal standards or a single comigrating stable-isotope internal standard. PeakMeister accelerated data preprocessing times by 30-fold compared to manual processing of MSI-CE-MS data by an experienced analyst using vendor software, while also achieving excellent peak annotation fidelity (median accuracy >99.9%), acceptable intermediate precision (median CV = 16.0%), consistent metabolite peak integration (mean bias = -2.1%), and good mutual agreement when quantifying 16 plasma metabolites from NIST SRM-1950 (mean bias = -1.3%). Reference ranges are also reported for 40 serum metabolites in a national nutritional survey of Brazilian children under 5 years of age from the ENANI-2019 study. MSI-CE-MS in conjunction with PeakMeister allows for rapid and automated processing of large-scale metabolomic studies that tolerate nonlinear migration time shifts without complicated dynamic time warping or effective mobility scale transformations.
Conflict of interest statement
The authors declare no competing financial interest.
Figures


Similar articles
-
Robust Method for High-Throughput Screening of Fatty Acids by Multisegment Injection-Nonaqueous Capillary Electrophoresis-Mass Spectrometry with Stringent Quality Control.Anal Chem. 2019 Feb 5;91(3):2329-2336. doi: 10.1021/acs.analchem.8b05054. Epub 2019 Jan 7. Anal Chem. 2019. PMID: 30570251
-
Multisegment injection-capillary electrophoresis-mass spectrometry: a high-throughput platform for metabolomics with high data fidelity.Anal Chem. 2013 Nov 19;85(22):10664-9. doi: 10.1021/ac403171u. Epub 2013 Nov 6. Anal Chem. 2013. PMID: 24195601
-
The maternal serum metabolome by multisegment injection-capillary electrophoresis-mass spectrometry: a high-throughput platform and standardized data workflow for large-scale epidemiological studies.Nat Protoc. 2021 Apr;16(4):1966-1994. doi: 10.1038/s41596-020-00475-0. Epub 2021 Mar 5. Nat Protoc. 2021. PMID: 33674789
-
Capillary Electrophoresis-Mass Spectrometry for Clinical Metabolomics.Adv Clin Chem. 2016;74:1-34. doi: 10.1016/bs.acc.2015.12.002. Epub 2016 Jan 20. Adv Clin Chem. 2016. PMID: 27117659 Review.
-
[Analysis of metabolomics and proteomics based on capillary electrophoresis-mass spectrometry].Se Pu. 2020 Sep 8;38(9):1013-1021. doi: 10.3724/SP.J.1123.2020.02025. Se Pu. 2020. PMID: 34213267 Review. Chinese.
Cited by
-
Micro- and Nanoengineered Devices for Rapid Chemotaxonomic Profiling of Medicinal Plants.Nanomaterials (Basel). 2025 Jun 10;15(12):899. doi: 10.3390/nano15120899. Nanomaterials (Basel). 2025. PMID: 40559262 Free PMC article. Review.
-
Increasing mass spectrometry throughput using time-encoded sample multiplexing.bioRxiv [Preprint]. 2025 May 27:2025.05.22.655515. doi: 10.1101/2025.05.22.655515. bioRxiv. 2025. PMID: 40501910 Free PMC article. Preprint.
References
MeSH terms
LinkOut - more resources
Full Text Sources
