. 2025 Feb:79:103462.
doi: 10.1016/j.redox.2024.103462. Epub 2024 Dec 12.

Acetylation of proximal cysteine-lysine pairs by alcohol metabolism

Affiliations

Acetylation of proximal cysteine-lysine pairs by alcohol metabolism

Courtney D McGinnis et al. Redox Biol. 2025 Feb.

Abstract

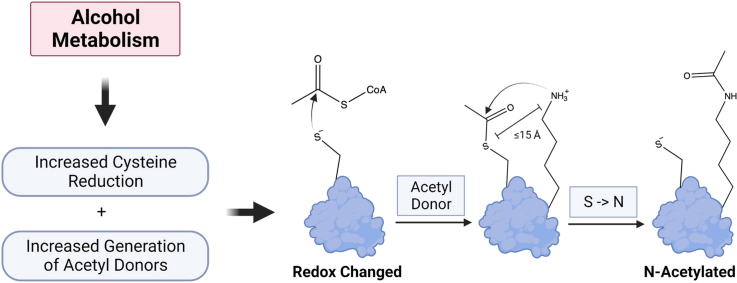
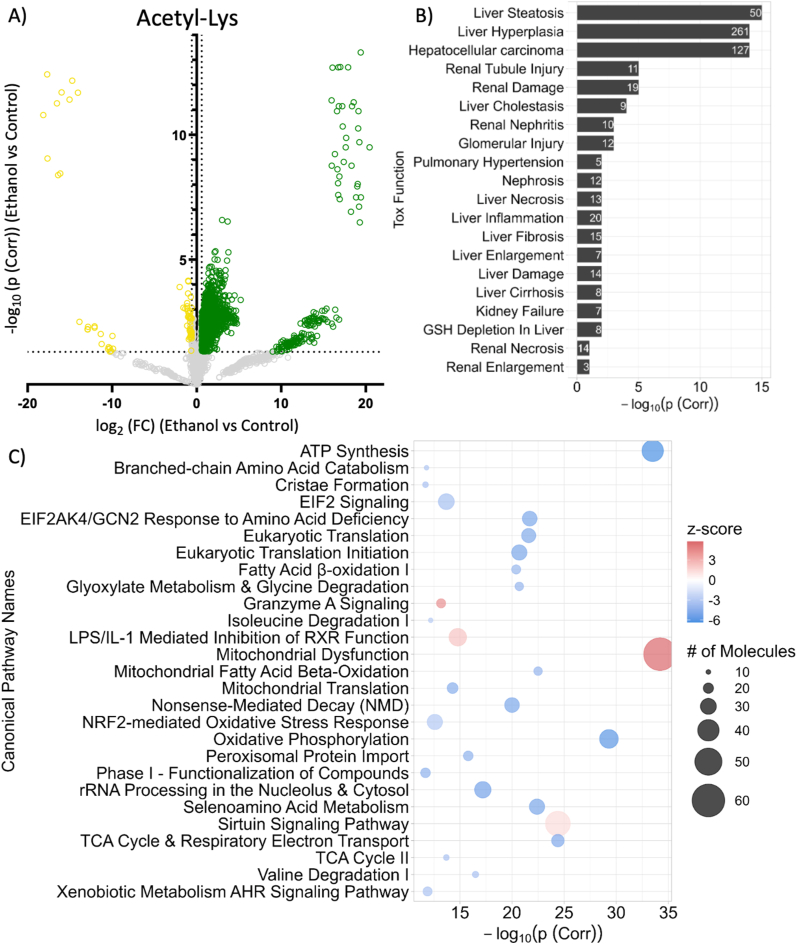
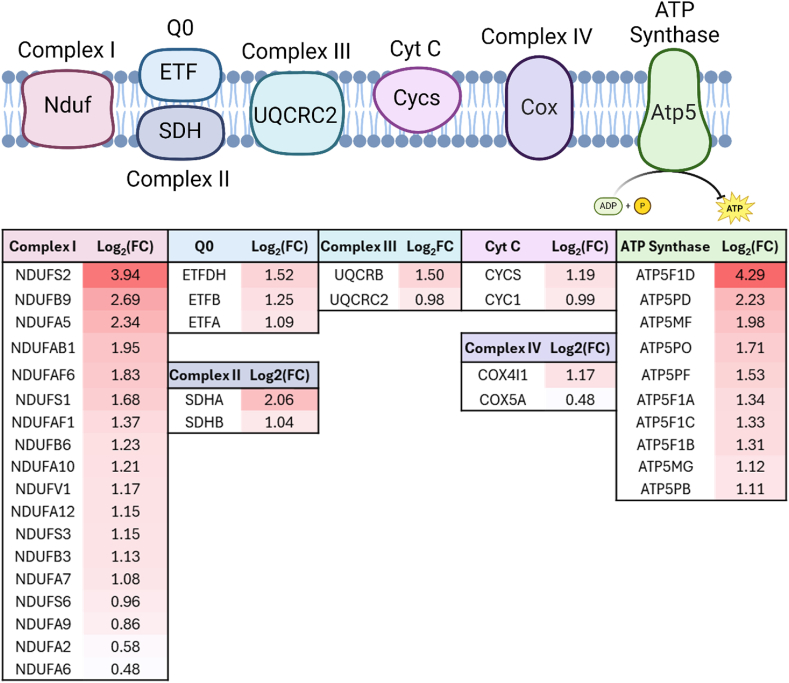
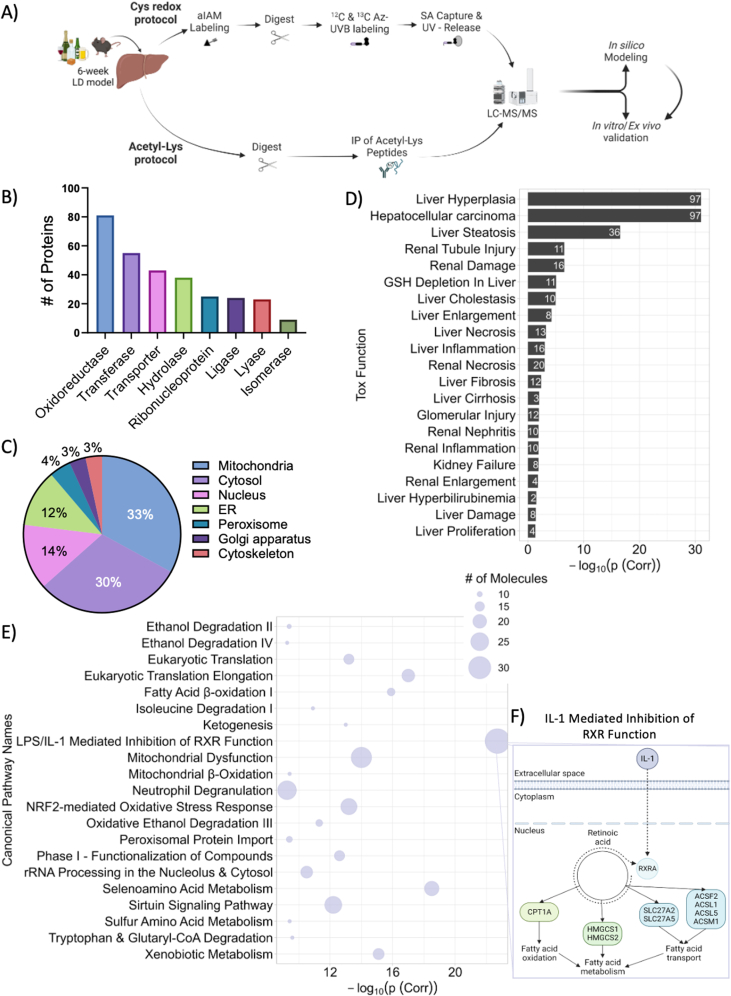
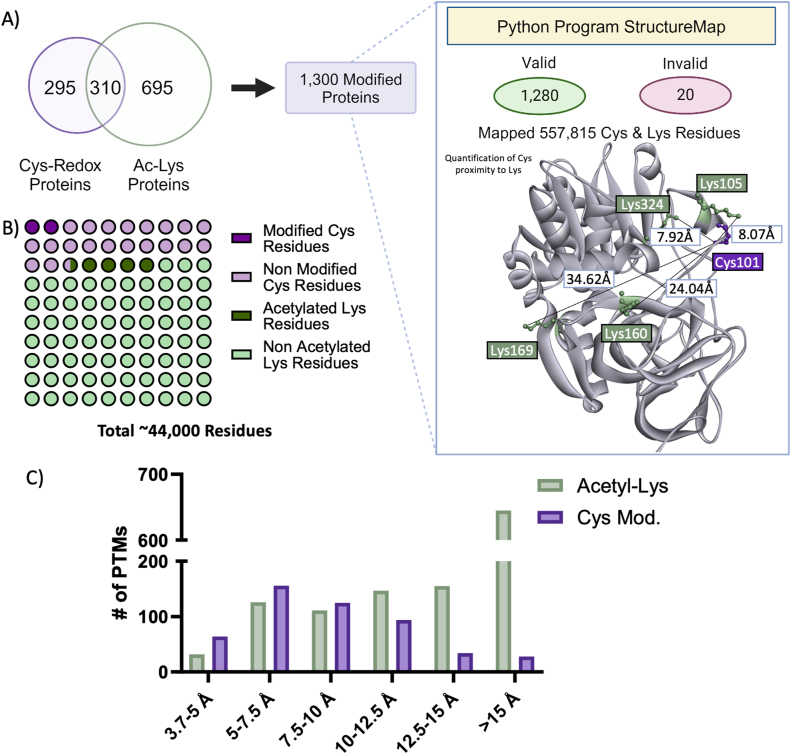
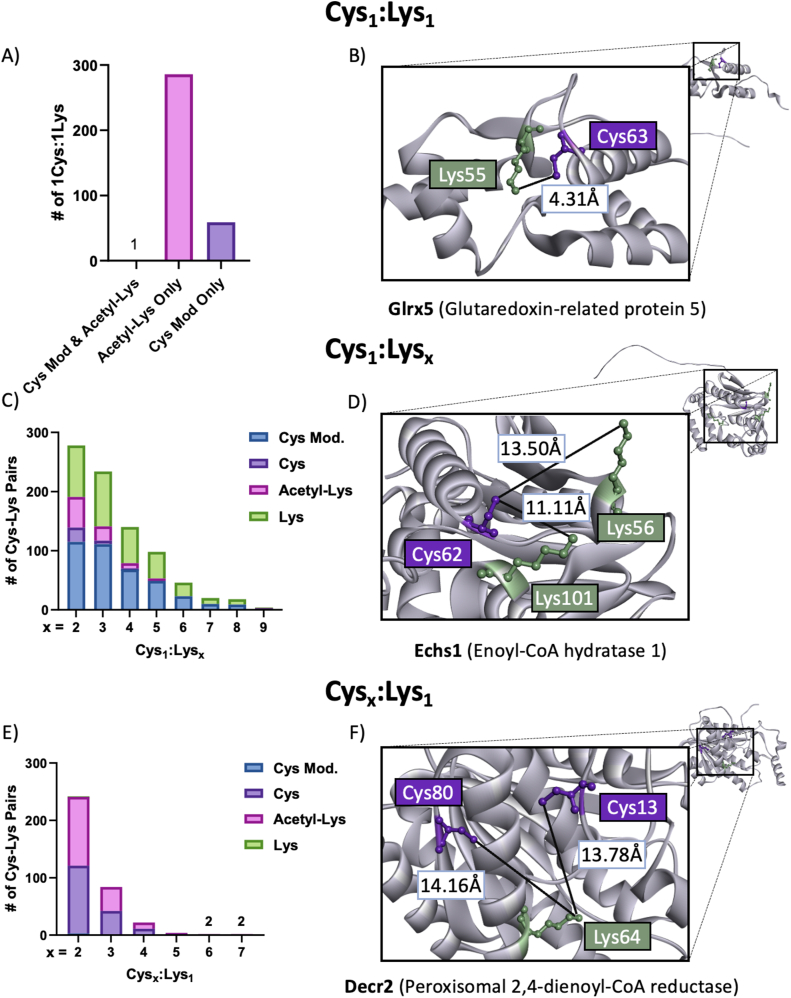
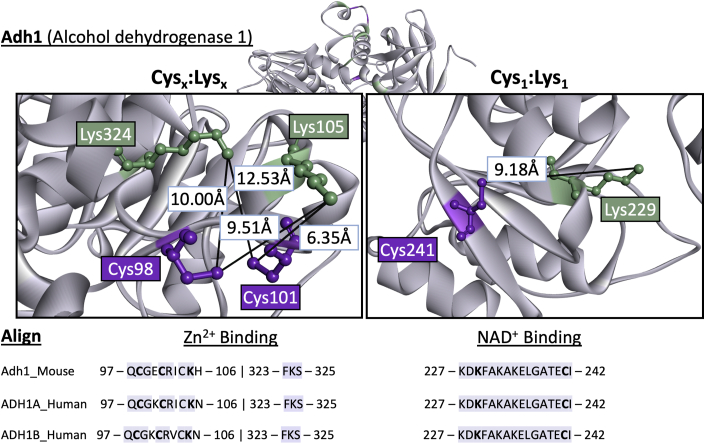
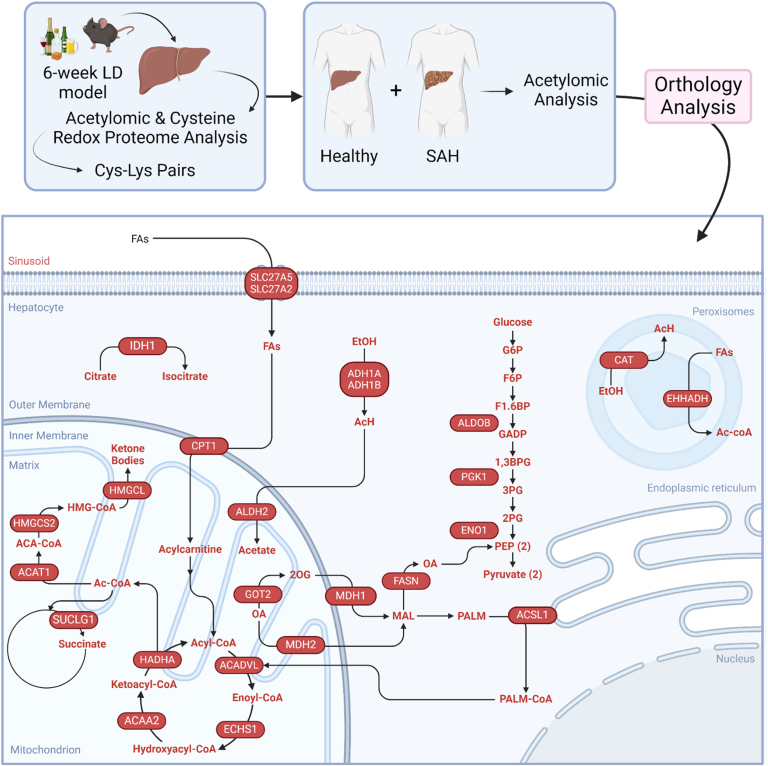
Alcohol consumption induces hepatocyte damage through complex processes involving oxidative stress and disrupted metabolism. These factors alter proteomic and epigenetic marks, including alcohol-induced protein acetylation, which is a key post-translational modification (PTM) that regulates hepatic metabolism and is associated with the pathogenesis of alcohol-associated liver disease (ALD). Recent evidence suggests lysine acetylation occurs when a proximal cysteine residue is within ∼15 Å of a lysine residue, referred to as a cysteine-lysine (Cys-Lys) pair. Here, acetylation can occur through the transfer of an acetyl moiety via an S → N transfer reaction. Alcohol-mediated redox stress is known to occur coincidentally with lysine acetylation, yet the biochemical mechanisms related to cysteine and lysine crosstalk within ALD remain unexplored. A murine model of ALD was employed to quantify hepatic cysteine redox changes and lysine acetylation, revealing that alcohol metabolism significantly reduced the cysteine thiol proteome and increased protein acetylation. Interrogating both cysteine redox and lysine acetylation datasets, 1280 protein structures generated by AlphaFold2 represented by a 3D spatial matrix were used to quantify the distances between 557,815 cysteine and lysine residues. Our analysis revealed that alcohol metabolism induces redox changes and acetylation selectively on proximal Cys-Lys pairs with an odds ratio of 1.88 (p < 0.0001). Key Cys-Lys redox signaling hubs were impacted in metabolic pathways associated with ALD, including lipid metabolism and the electron transport chain. Proximal Cys-Lys pairs exist as sets with four major motifs represented by the number of Cys and Lys residues that are pairing (Cys1:Lys1, Cysx:Lys1, Cys1:Lysx and Cysx:Lysx) each with a unique microenvironment. The motifs are composed of functionally relevant Cys-Ly altered within ALD, identifying potential therapeutic targets. Furthermore, these unique Cys-Lys redox signatures are translationally relevant as revealed by orthologous comparison with severe alcohol-associated hepatitis (SAH) explants, revealing numerous pathogenic thiol redox signals in these patients.

Keywords: Acetylation; Alcohol-associated liver disease; Cysteine proteomics; Mass spectrometry; Protein modeling; Redox.


Conflict of interest statement

Declaration of competing interest The authors declare no conflicts of interest.

Figures

Image 1
Graphical abstract
Fig. 1
Fig. 1
Characterization of alcohol-induced hepatic acetylome modifications. A) This volcano plot depicts acetylated (dark green log2(FC)≥|0.58|, -log10(p (Corr))>1.30) or deacetylated (dark yellow -log2FC≤|0.58|, -log10(p (Corr))≥1.30) peptides due to alcohol exposure. Non-significant peptides that are below the FC threshold are shown in grey. The dashed horizontal line marks the significance threshold (p (Corr) = -log10(0.05)) and vertical marks indicate log2(FC) of |1.5| and -|1.5|. B) Bar plot of whole liver acetylomic pathway enrichment of toxicity endpoints with –log10(p (Corr)) representing enrichment score and values within each bar indicating the number of molecules identified within each pathway. C) Bubble plot of acetylomic canonical pathway enrichment with the -log10(p (Corr)) displaying enrichment score, number of molecules denoted by size, and color representing pathway activation (orange) and inhibition (purple). ALT: Alanine aminotransferase; ATP: Adenosine triphosphate; EIEF2: Eukaryotic initiation factor 2; GCN2: Serine/threonine-protein kinase general control nonderepressible 2; TCA: Tricarboxylic acid cycle.
Fig. 2
Fig. 2
Alcohol induced acetylation of proteins within the electron transport chain. Illustration of proteins containing acetylated lysines significantly changed by multiple comparison-corrected test within the electron transport chain. The data is presented as log2 fold-change of ethanol over control. Figure made in BioRender.com. Atp5: Adenosine triphosphate synthase 5; Cox; Cyclooxygenase, Cyc: Cytochrome subunit; Cyt C; Cytochrome complex, ETF; Electron-transfer flavoprotein, Nduf; NADH:ubiquinone oxidoreductase, SDH; Succinate dehydrogenase complex.
Fig. 3
Fig. 3
Pathway enrichment analysis of proteins identified by the cysteine proteomic and acetylomic analysis. A) Schematic for the development and integration of a cysteine proteomic and acetylomic analysis on 6-week Lieber-DeCarli (LD) mouse tissue. B) Bar plot depicts the number of acetylated and redox changed hepatic proteins within each enzymatic class. C) Pie chart displaying the percentage of acetylated and redox changed hepatic proteins within each subcellular compartment. D) Bar plot of selected toxicity functions identified through of analysis of acetylated and redox modifies hepatic proteins with –log10(p (Corr)) representing enrichment score and values within each bar indicating the number of molecules identified within each pathway. E) Canonical pathway enrichment of acetylated and redox modified hepatic proteins with the -log10(p (Corr)) representing enrichment score and the number of molecules represented by size. F) IL-1 mediated inhibition of RXR function pop-out depicts the fatty acid metabolizing enzymes regulated by RXRA (enrichment by IPA). Figure made in BioRender.com. ACS: Acetyl-CoA synthetase; aIAM: Alkynyl iodoacetamide; Az-UVB: UV cleavable biotin-azide; CPT: Carnitine palmitoyltransferase; ER: Endoplasmic reticulum; HMG: Hydroxymethylglutaryl-CoA synthase; IL-1: Interleukin 1; IP: Immunoprecipitation; LC-MS/MS: Liquid Chromatography tandem mass spectrometry; LD: Lieber-DeCarli; RXRA: Retinoid X receptor alpha; SLC: Solute carrier; SA: Streptavidin.
Fig. 4
Fig. 4
StructureMap was used to determine Cys and Lys proximity of AlphaFold2 predicted protein structures found to be modified by alcohol. A) Proteins found to be modified by alcohol metabolism were used in the Python program StructureMap to evaluate the distance between Cys and Lys residues on predicted protein structures. The program mapped 1281 of the 1300 proteins input and quantified the distance between 557,815 Cys-Lys pairs. Adh1 (AF-P00329-F1) demonstrated the use of AphaFold2 predicted structure to map amino acid residues. B) Breakdown of Cys residues and Lys residues within the proteins mapped by StructureMap either modified or unmodified containing circles representative of approximately 450 amino acids. C) Bar plot depicting number of Cys residues with a redox change and distance to nearest Lys residue and acetylated Lys residue and the distance to nearest Cys residue. Acetyl-Lys: Acetylated Lysine; Adh1: Alcohol dehydrogenase; Cys-Redox: Cysteine redox proteome.
Fig. 5
Fig. 5
CysLys pair motifs. A) Cys1:Lys1. Number of pairs with redox changed or unchanged Cys paired with an acetylated or unmodified Lys. B) AlphaFold2 predicted structure of Glrx5 which contains one Cys-Lys pair with a redox modified cysteine and acetylated Lys. Cys-Lys pairs: Cys63 – Lys55. C) Cys1:Lysx. Bar plot showing the distribution of pairs comprised of a Cys residue proximal to multiple Lys residues, with x representing the number of Lys residues. D) AlphaFold2 predicted structure of Echs1 contains a singular cysteine residue proximal to three lysine residues. Cys-Lys pairs: Cys62 – Lys101, Lys56. E) Cysx:Lys1. Bar plot showing the distribution of pairs comprised of a Lys residue proximal to multiple Cys residues, with x representing the number of Cys residues. F) AlphaFold2 predicted structure of Decr2 which contains two cysteine residues proximal to a singular lysine residue. Cys-Lys pairs: Lys62 – Cys13, Cys80. Cys: Cysteine; Lys: Lysine.
Fig. 6
Fig. 6
CysLys pairs are conserved within the zinc and NAD+ binding sites of Adh1. The panel to the left depicts cysteines that coordinate Adh1 zinc and the proximal lysine residues. The right panel depicts the Lys that binds to NAD+ and its proximal cysteine. Adh1 structure was generated by AlphaFold2. Amino acid sequences between mouse and human Adh1 were aligned. Bolded within the Zn2+ and NAD+ binding region represent the amino acids involved in Zn2+ binding and NAD+ binding. NAD+: Nicotinamide adenine dinucleotide; Zn2+: Zinc.
Fig. 7
Fig. 7
Proteins identified to be deacetylated within severe alcohol-associated hepatitis (SAH) explant tissue containing Cys-Lys pairs separated by subcellular compartments and associated pathways. Depicted are orthologous enzymes of murine proteins containing Cys-Lys pairs and human proteins found deacetylated within SAH explant tissues. All enzymes are represented by red ovals and the substrates they interact with. The pathways that were enriched are placed within their respective subcellular location and include glycolysis/gluconeogenesis, alcohol metabolism, fatty acid metabolism, citric acid cycle and ketogenesis. Figure made in BioRender.com. ACADVL: Very long-chain specific acyl-CoA dehydrogenase; ACA-CoA: Acetoacetyl-CoA; Ac-CoA: Acetyl-CoA; ACAT1: Acetyl-CoA acetyltransferase 1; ACSL1: Acetyl-CoA synthetase 1; SAH: severe alcohol-associated hepatitis; ALDOB: Aldolase fructose-bisphosphate B; CBR1: Carbonyl reductase 1; EHHADH: Enoyl-CoA hydratase and 3-hydroxyacyl CoA dehydrogenase; ENO1: Enolase 1; FAs: Fatty acids, FASN: Fatty acid synthase; HADHA: Hydroxyacyl-CoA dehydrogenase trifunctional protein; HMGCL: 3-hydroxy-3-methylglutaryl-CoA lyase; HMGCS2: Hydroxymethylglutaryl-CoA synthase; GOT2: Glutamic-oxaloacetic transaminase 2; IDH1: Isocitrate dehydrogenase 1; LD: Lieber-DeCarli; MDH1: Malate dehydrogenase 1; MDH2: Malate dehydrogenase 1; PALM-CoA: Palmitoyl-CoA; PEP: Phosphoenolpyruvate; PGK1: Phosphoglycerate kinase 1; SUCLG1: Succinate-CoA ligase.

Similar articles

References

    1. National Survey on Drug Use and Health. 2022. SAMHSA Center for Behavioral Health Statistics and Quality. Alcohol use in past year: among people aged 12 or older; by age group and demographic characteristics, percentages, 2021 and 2022. Table 2.26B.
    1. WHO . World Health Organization; Geneva, Switzerland: 2018. Global Status Report on Alcohol and Health 2018.
    1. Mackowiak B., Fu Y., Maccioni L., Gao B. Alcohol-associated liver disease. J. Clin. Invest. 2024;134(3) - PMC - PubMed
    1. Adekunle A.D., Adejumo A., Singal A.K. Therapeutic targets in alcohol-associated liver disease: progress and challenges. Therapeutic Advances in Gastroenterology. 2023;16 - PMC - PubMed
    1. Shepard B.D., Tuma D.J., Tuma P.L. Chronic ethanol consumption induces global hepatic protein hyperacetylation. Alcohol Clin. Exp. Res. 2010;34(2):280–291. - PMC - PubMed

LinkOut - more resources