Clinical Trial
. 2025 Jan 21;6(1):101881.
doi: 10.1016/j.xcrm.2024.101881. Epub 2024 Dec 26.

Mechanism of enhancing chemotherapy efficacy in pancreatic ductal adenocarcinoma with paricalcitol and hydroxychloroquine

Affiliations
Clinical Trial

Mechanism of enhancing chemotherapy efficacy in pancreatic ductal adenocarcinoma with paricalcitol and hydroxychloroquine

Ganji Purnachandra Nagaraju et al. Cell Rep Med. .

Abstract

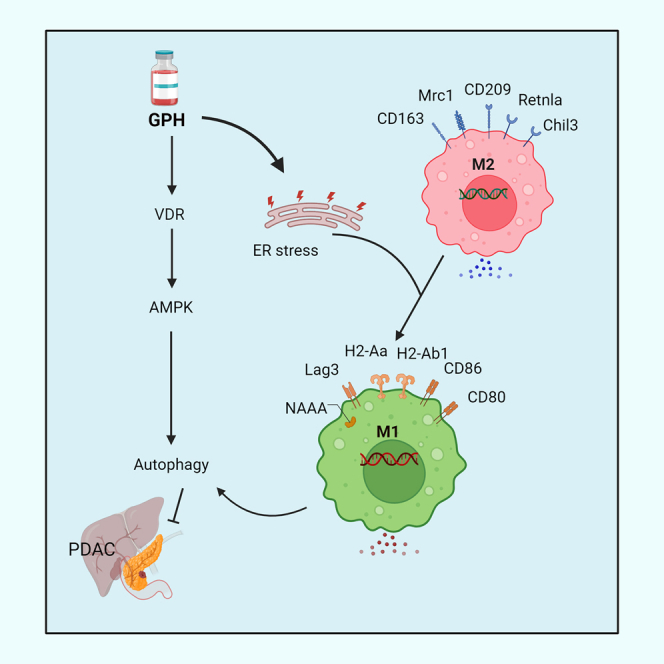
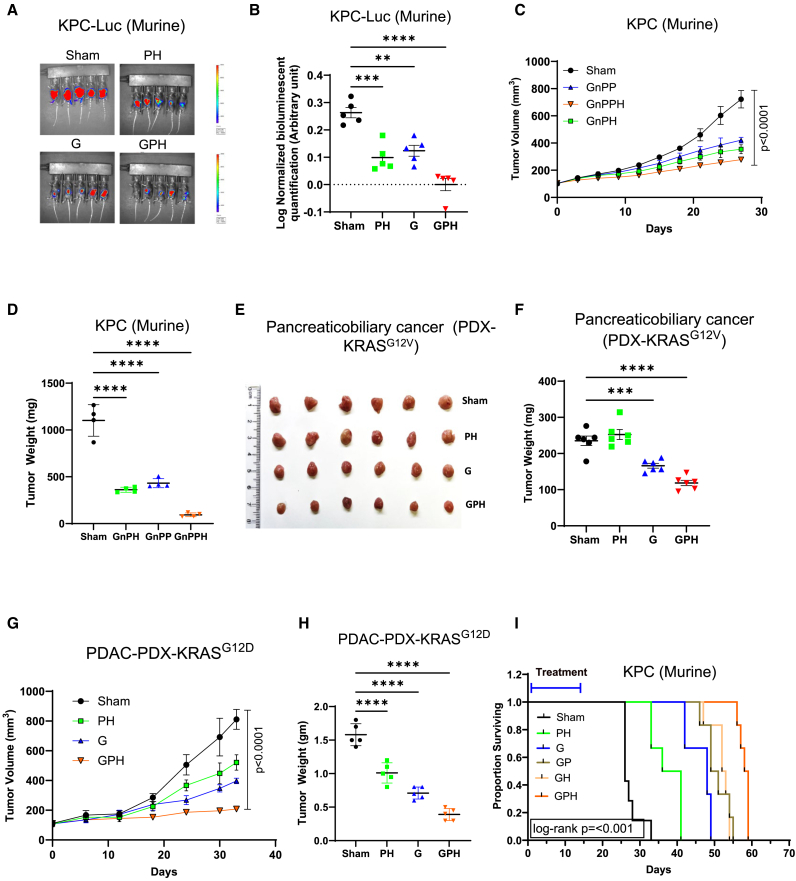
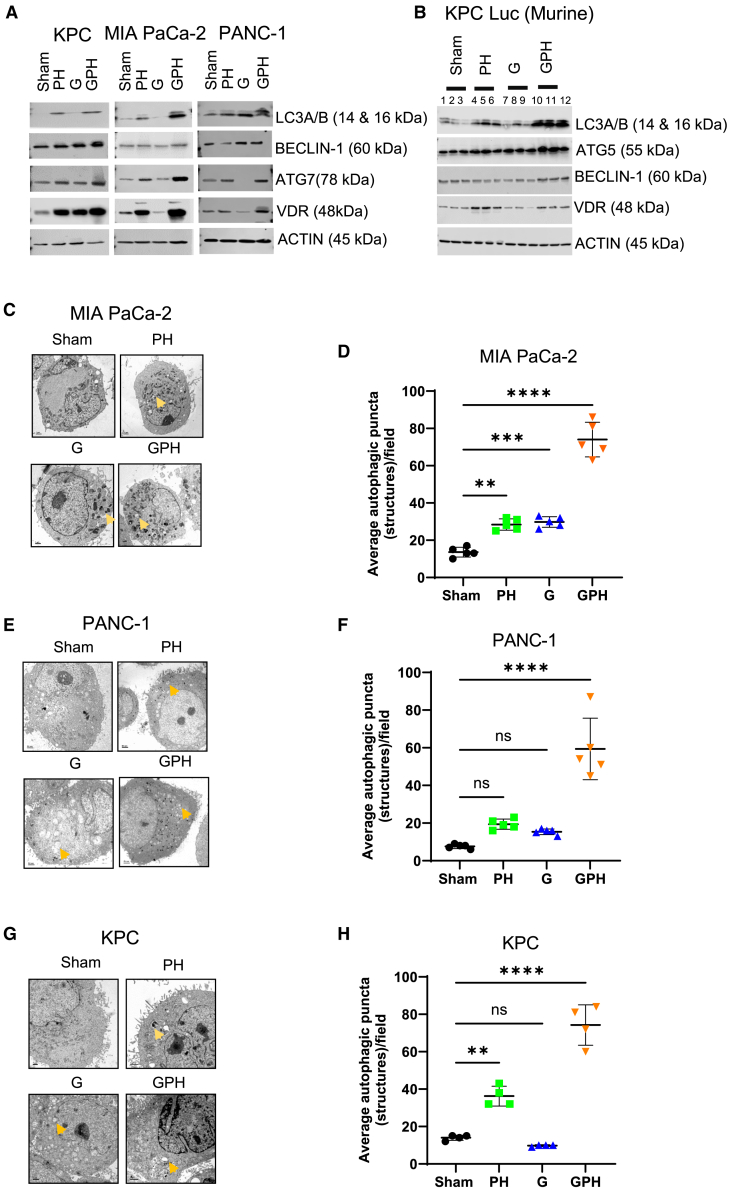
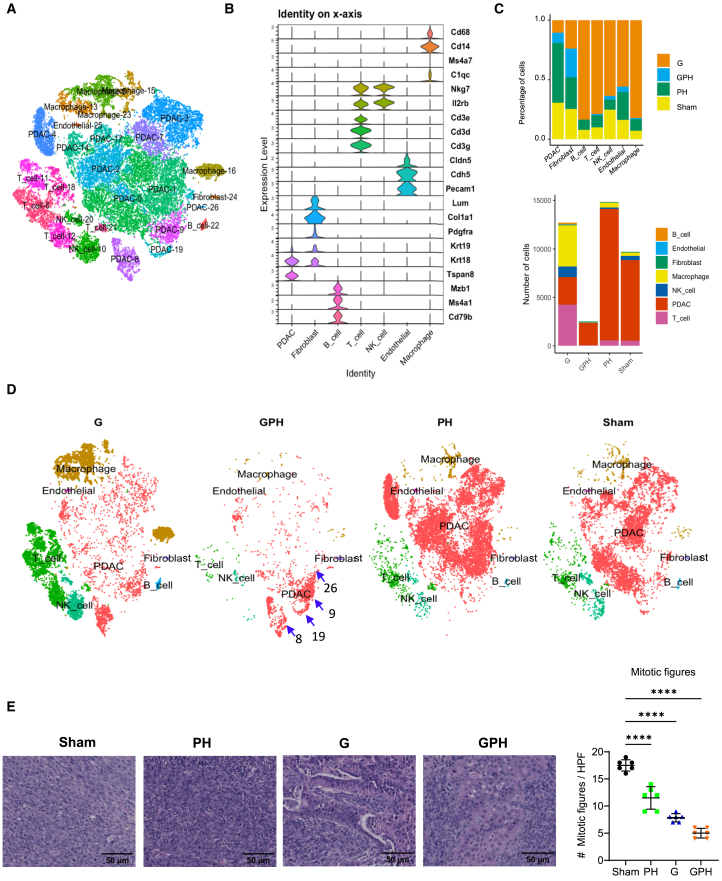
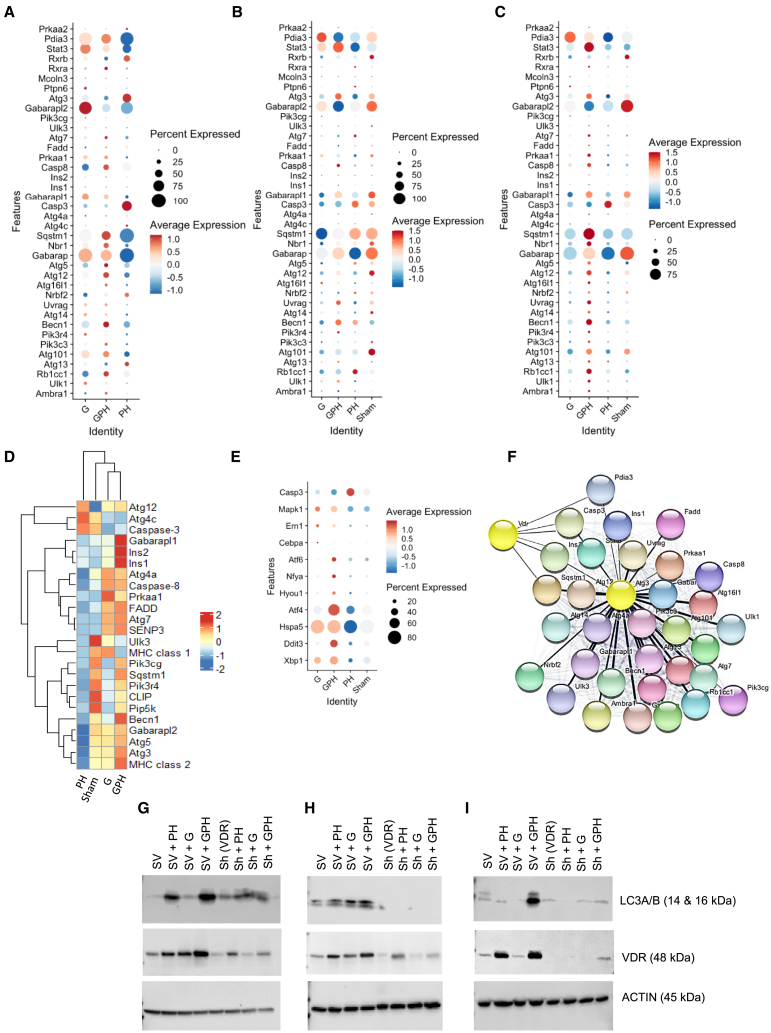
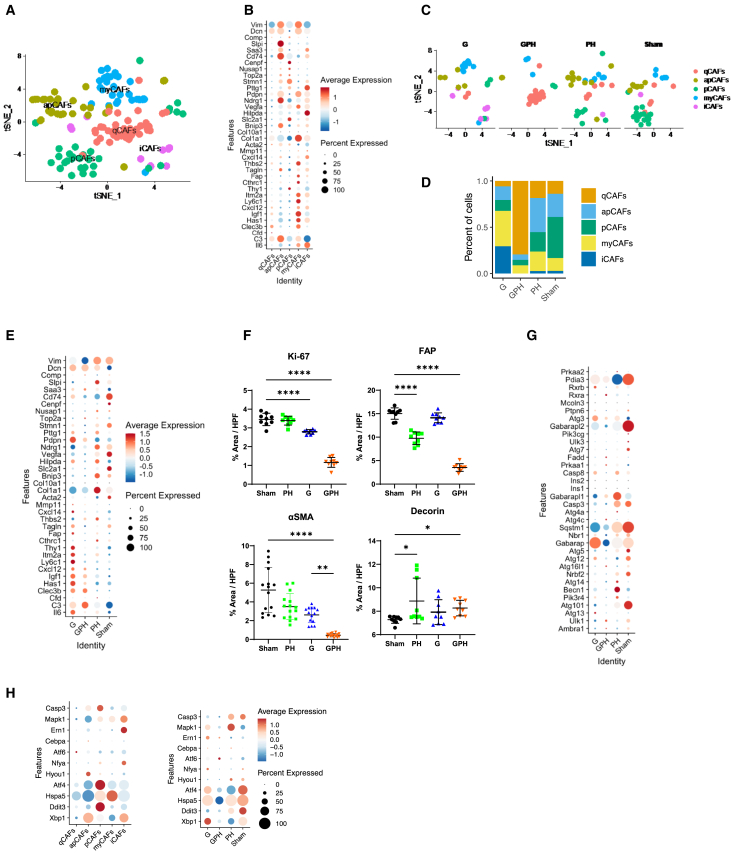
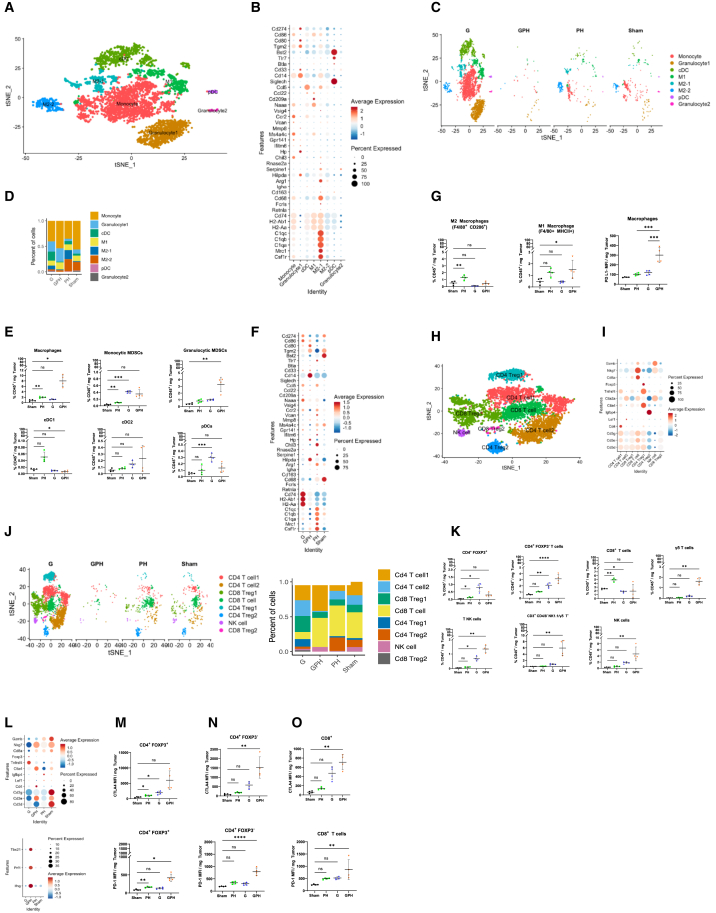
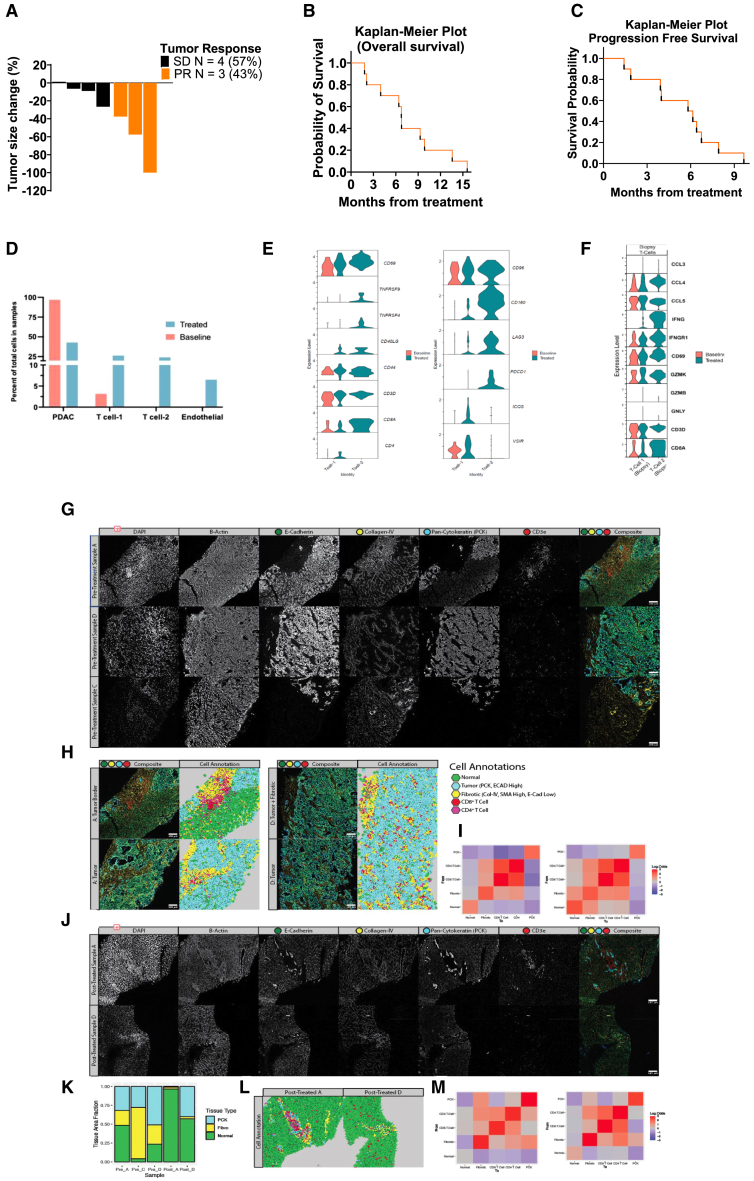
Pancreatic ductal adenocarcinoma (PDAC) has a minimal (<15%) 5-year existence, in part due to resistance to chemoradiotherapy. Previous research reveals the impact of paricalcitol (P) and hydroxychloroquine (H) on altering the lysosomal fusion, decreasing stromal burden, and triggering PDAC to chemotherapies. This investigation aims to elucidate the molecular properties of the H and P combination and their potential in sensitizing PDAC to gemcitabine (G). PH potentiates the effects of G in in vitro, orthotopic mouse models, and a patient-derived xenograft model of PDAC. Proteomic and single-cell RNA sequencing (RNA-seq) analyses reveal that GPH treatment upregulates autophagy and endoplasmic reticulum (ER) stress-related transcripts. GPH treatment decreases the number of Ki67, fibroblast-associated protein (FAP), and alpha-smooth muscle actin (SMA)-expressing fibroblasts with a decrease in autophagy-related transcripts. The GPH treatment increases M1 polarization and CD4+ and CD8+ T cells and reduces CD4+ and CD8+ regulatory T cells (Tregs). These effects of GPH were confirmed in paired biopsies obtained from patients treated in a clinical trial (NCT04524702).

Keywords: autophagy; cancer associated fibroblasts; chemotherapy; hydroxychloroquine; immune cells; pancreatic ductal adenocarcinoma; paricalcitol; proteomics; single-cell RNA-seq analyses; vitamin D receptor.


Conflict of interest statement

Declaration of interests The authors declare no competing interests.

Figures

None
Graphical abstract
Figure 1
Figure 1
Gemcitabine with paricalcitol and hydroxychloroquine increases growth inhibition of mouse and human PDAC cell lines in vivo (A and B) KPC-Luc cells (1 × 105) were injected into the central section of the pancreas of C57BL/6J male mice. Group 1 received PBS and served as a sham; the second group received gemcitabine (G) (60 mg/kg; weekly twice); the third group received paricalcitol (P) (0.3 μg/kg; weekly twice) plus hydroxychloroquine (H) (60 mg/kg; oral daily for 14 days), and the fourth group received GPH. The development of tumors (KPC-Luc cells) was evaluated by the IVIS system (bioluminescent imaging). (C and D) KPC-Luc cells (1 × 105) were administered subcutaneously into male mice (C57BL/6J strain). Group 1 received PBS and served as a sham, the second group received GnPH (G, 60 mg/kg [i.p.]; nP, 10 mg/kg [i.v.] weekly once; H [60 mg/kg; oral daily for 14 days]), the third group received GnPP (P, 0.3 μg/kg; weekly twice), and the fourth group received GnPPH for 4 weeks. Tumor sizes were measured once weekly with digital calipers. Terminal tumor weight of treated and untreated mice was noted. (E and F) PDX mouse model. KRASG12V-mutated pancreaticobiliary-PDX cell suspension was injected into the pancreas of NSG mice. Mice were randomized into four groups and treated as indicated in (A) and (B). Terminal tumor weight and pictures of treated and untreated mice were noted. (G and H) PDX mouse model. KRASG12D-mutated pancreatic cancer-PDX (∼10 mg) was implanted into the subcutaneous NSG mice. Mice were randomized into four groups and treated as indicated in (A) and (B). Terminal tumor volume and weight of treated and untreated mice were noted. (I) Kaplan-Meier survival curves for KPC-Luc cells (1 × 105) were injected into the central section of the pancreas (orthotropic) of C57BL/6J male mice. GPH treatment significantly (p < 0.001) increased the survival of mice as compared to mice receiving the other individual (G) and combination (PH) treatments. One-way ANOVA, followed by Tukey’s multiple comparisons test, considered p values. Asterisks (∗∗p < 0.001, ∗∗∗p < 0.0001, and ∗∗∗∗p < 0.00001) denote the level of significance (between the sham and treatment groups), Error bars designate SD. See also Figures S2 and S3.
Figure 2
Figure 2
The combination of G with P and H enhances autophagy in human and mouse PDAC models (A) Autophagy marker expression in KPC-Luc, PANC-1, and MIA PaCa-2 cells was evaluated using Immunoblot. The expression of autophagy markers LC3A/B, Atg7, Beclin-1, and VDR was examined by western blotting. Results are repeated in three independent experiments. (B) Immunoblot to evaluate the expression of autophagy markers in tumor tissues. β-Actin was used as a loading control. Atg5 indicates autophagy-related 5; Beclin-1 indicates autophagy-related 7; LC3, light chain 3; and VDR, vitamin D receptor. (C–H) The three PDAC (MIA PaCa-2, PANC-1, and KPC-Luc) cell line specimens were examined using a Hitachi H-7500 electron microscope operated at 75 kV. Autophagosomes (indicated “arrow”) are indicated in PH, G, and GPH-treated PDAC cells. Bars, 50 nm (PANC-1 cells) and 1.0 μm (MIA PaCa-2 and KPC-Luc), respectively. (D, F, and H) Quantification of autophagosome puncta. One-way ANOVA, followed by Tukey’s multiple comparisons test, considered p values. Asterisks (∗∗p < 0.001, ∗∗∗p < 0.0001, and ∗∗∗∗p < 0.00001) denote the level of significance (between the sham and treatment groups), ns denote non-significant. Error bars designate SD. See also Figures S4–S6.
Figure 3
Figure 3
Single-cell RNA sequencing analysis reveals a marked reduction in orthotopic KPC-Luc intratumoral cell populations in mice treated with G, P, and H (A) The t-distributed stochastic neighbor embedding (t-SNE) plot showed 0 to 26 clusters (7 identified main cell types in orthotopic KPC-Luc tumors). (B) Violin plots display the well-established 21 gene markers representing seven main cell types. (C) Number and percentage of orthotopic KPC-Luc intratumoral cell populations in sham and GPH or PH or G treatments. (D) The t-SNE plot analysis showed that GPH treatment in orthotopic KPC-Luc tumors decreased all clusters and increased 8, 9, 19, and 26 PDAC clusters. (E) H&E analysis revealed that GPH and other treatments like PH and G decrease the mitotic bodies in KPC-Luc tumors. Bar 50 μm; One-way ANOVA, followed by Tukey’s multiple comparisons test, considered p values. ∗∗∗∗p < 0.00001.
Figure 4
Figure 4
The combination of G with P and H on autophagy and endoplasmic reticulum stress pathways in orthotopic KPC-Luc tumors (A–C) Single-cell RNA sequencing analysis reveals an increase in autophagy markers in GPH-treated orthotopic KPC-Luc tumors compared to PH and sham. Cluster 8 or 9 or all other PDAC subclusters also showed higher expression of autophagy markers in GPH treatment. (D) Proteomics data support a single-cell RNA sequence. GPH treatment enhances the autophagy-associated markers in orthotopic KPC-Luc tumors. (E) Single-cell RNA sequencing analysis reveals an increase in endoplasmic reticulum (ER) stress pathway markers in GPH-treated orthotopic KPC-Luc tumors compared to PH and sham. (F) Gene-gene interaction analysis revealed that VDR is the master regulator for all autophagy-associated markers. VDR is connected to autophagy markers through Ins2, Caspase 3, Pdia3, and Sqstm1. (G–I) VDR knockdown in 3 PDAC cell lines and treated with sham, PH, G, and GPH as indicated in Figure 2A. Knockdown of PDAC cells did not show significant response on LC3A/B and VDR expression when treated with PH, G, and GPH. Results are repeated in three independent experiments. See also Figure S7.
Figure 5
Figure 5
G with P and H modulates the cancer-associated fibroblast phenotype and abundance in the orthotopic KPC-Luc-tumors (A) t-SNE plot analysis showed five subsets of cancer-associated fibroblasts (CAFs): quiescent (qCAF), myofibroblastic (myCAF), inflammatory (iCAF), proliferative (pCAF), and antigen-present (apCAF). (B) Dot plot represents established gene markers for identifying qCAFs, myCAFs, iCAFs, pCAFs, and apCAFs. (C and D) t-SNE plot showed that GPH treatment decreases the percentage of active CAF (iCAF, myCAF, pCAF, and apCAF) population and increases the percentage of qCAF population. (E) Dot plot showed that GPH treatment decreases the active CAF (iCAF, myCAF, pCAF, and apCAF)-associated gene markers and α-smooth muscle actin expression. (F) Immunohistology quantification results showed that GPH treatment decreases the Ki67, fibroblast associated protein (FAP), and α-smooth muscle actin (α-SMA) expression and increases decorin expression in orthotopic KPC-Luc tumors. Bar, 50 μm. One-way ANOVA, followed by Tukey’s multiple comparisons test, considered p values. (∗p < 0.05, ∗∗∗p < 0.0001, ∗∗∗∗p < 0.00001; error bars indicate SD). (G) Dot plot showed that GPH treatment decreases the autophagy gene markers. (H) Dot plot showed ER stress molecules in various types of CAFs. GPH treatment decreases ER stress-associated markers. See also Figure S8.
Figure 6
Figure 6
The combination of G with P and H promotes M1 polarization and T cell activation in the KPC-Luc-TME (A) t-SNE plot analysis showed ten subset clusters representing five major cell types (M1 and M2 macrophages, monocytes, granulocytes, and dendritic cells). (B) Well-established gene markers recognized subclusters for macrophages. (C and D) GPH treatment increases the percentage of M1 macrophages polarization, monocytes, and granulocytes. (E) The percentages of CD45+ CD11b+ Ly6C Ly6G F4/80+ macrophage, CD11b+ Ly6G+ Ly6C+ gMDSC, CD11b+ Ly6G Ly6Chi mMDSC, CD11b CD11chi MHCIIhi XCR1+ cDC1, CD11b+ CD11chi MHCIIhi CD172α+ cDC2, and CD11b CD11cint pDC subsets were evaluated in sham, PH, G, and GPH (N = 4 mice/group). Data are representative of a single experiment. One-way ANOVA run, followed by Tukey’s multiple comparisons test, determined p values. Error bars indicate SD. (F) Dot plot showed that GPH treatment modulate the myeloid population representing gene markers. GPH treatment decreases the expression of M2 markers and increases dendritic cell (DC) markers. (G) The percentages of macrophages CD45+ CD11b+ Ly6G Ly6C F4/80+ macrophage and median fluorescent intensity of MHCII and CD206 were evaluated in sham, PH, G, and GPH (N = 4 mice/group). Data are representative of a single experiment. One-way ANOVA run, followed by Tukey’s multiple comparisons test, determined p values. Error bars indicate SD. (H and I) Well-established gene markers recognized subclusters for T cells. (J) t-SNE plot showed that GPH treatment decreases the percentage of Cd4 and Cd8 Tregs and increases the percentage of Cd4+ and Cd8+ T cells as well as NK cells. (K) Proportions of CD4+ Foxp3, CD4+ Foxp3+, CD8+ T cells, γδ T cells, and NK cells in KPC-Luc-TME were evaluated in sham, PH, G, and GPH (N = 4 mice/group). Data are representative of a single experiment. One-way ANOVA run, followed by Tukey’s multiple comparisons test, determined p values. (L–O) Dot plot showed that GPH treatment increases the expression of the Cd4, Cd3e, Nkg7, Ctla-4, and Pd-1 as well as Ifnγ, Prf1, and Tbx21 and decreases Foxp3. CD4+ FOXP3+ (M), CD4+ Foxp3 (N), and CD8+ T cell (O) subsets from KPC-Luc-TME were graphed as mean fluorescent intensity per mg tumor weight. Data are representative of a single experiment. Welch’s t test determined p values; Asterisks (∗p < 0.01, ∗∗p < 0.001, ∗∗∗p < 0.0001, and ∗∗∗∗p < 0.00001) denote the level of significance (between the sham and treatment groups), ns denote non-significant. Error bars indicate SD. See also Figures S9–S11.
Figure 7
Figure 7
Human PDAC studies (scRNA and spatial studies) (A) The waterfall plot denotes the maximum percentage change in target lesion size from the baseline; PR, partial response; and SD, stable disease (Methods S1). (B) Kaplan-Meier survival curves for enrolled patients. (C) Kaplan-Meier survival curves for progression-free survival. (D) Percentage of cells observed in pre- and post-treatment samples from patient A and D. (E) T cell exhaustion genes expression in the baseline and treated human biopsy samples. (F) Comparison between CD8+ T cells and NK cells from TME (biopsy) and baseline level. (G) Spatial analysis of liver metastases before and after therapy. Immunofluorescent stains of six markers covering various structural or immune characteristics. One region of each pre-treated sample is displayed. Markers displayed include DAPI (nuclear), β-actin (structural), E-cadherin (normal, PDAC tissue), collagen-IV (fibrotic), pan-cytokeratin (PCK, PDAC), and CD3e (T cell). A composite image including E-cadherin (green), collagen-IV (yellow), PCK (cyan), and CD3e (red). (H) Cell annotations for select regions from pretreated samples A (left) and D (right). The left column shows the composite image with the same color scheme from (G). The right column displays the cell classification for each region. (I) Adjacency analysis for the cell types annotated in (H) for pretreated samples A and D. Each square displays the log-odds ratio for finding a cell of one type adjacent to another. Red indicates a higher likelihood of being found near each other than random, and blue indicates a lower probability. (J) Displaying individual fluorescent markers for select regions from post-treated samples A and D. The composite image uses the same color mappings as (G). (K) A stacked barplot displays the percent area coverage of normal, fibrotic, and PCK+ malignant tissue for pre-treatment and post-treatment samples. (L) Cell annotations for select regions from post-treated samples A and D, using the color scheme defined in (H). (M) Adjacency analysis for the cell types annotated in (F) for the post-treated sample A (left) and D (right). See also Figure S12 and Tables S1 and S2.

Similar articles

Cited by

References

    1. Rahib L., Wehner M.R., Matrisian L.M., Nead K.T. Estimated projection of US cancer incidence and death to 2040. JAMA Netw. Open. 2021;4:e214708. doi: 10.1001/jamanetworkopen.2021.4708. - DOI - PMC - PubMed
    1. Siegel R.L., Miller K.D., Wagle N.S., Jemal A. Cancer statistics, 2023. CA. Cancer J. Clin. 2023;73:17–48. doi: 10.3322/caac.21763. - DOI - PubMed
    1. Jiang Y., Sohal D.P.S. Pancreatic adenocarcinoma management. JCO Oncol. Pract. 2023;19:19–32. doi: 10.1200/OP.22.00328. - DOI - PubMed
    1. Di Costanzo F., Di Costanzo F., Antonuzzo L., Mazza E., Giommoni E. Optimizing First-Line Chemotherapy in Metastatic Pancreatic Cancer: Efficacy of FOLFIRINOX versus Nab-Paclitaxel plus Gemcitabine. Cancers. 2023;15:416. doi: 10.3390/cancers15020416. - DOI - PMC - PubMed
    1. Sherman M.H., Beatty G.L. Tumor microenvironment in pancreatic cancer pathogenesis and therapeutic resistance. Annu. Rev. Pathol. 2023;18:123–148. doi: 10.1146/annurev-pathmechdis-031621-024600. - DOI - PMC - PubMed

Publication types

MeSH terms

Associated data