. 2025 Feb;301(2):108137.
doi: 10.1016/j.jbc.2024.108137. Epub 2024 Dec 25.

DNMT3b-mediated CpA methylation facilitates REST binding and gene silencing and exacerbates hippocampal demyelination in diabetic mice

Affiliations

DNMT3b-mediated CpA methylation facilitates REST binding and gene silencing and exacerbates hippocampal demyelination in diabetic mice

Tie-Feng Yao et al. J Biol Chem. 2025 Feb.

Abstract

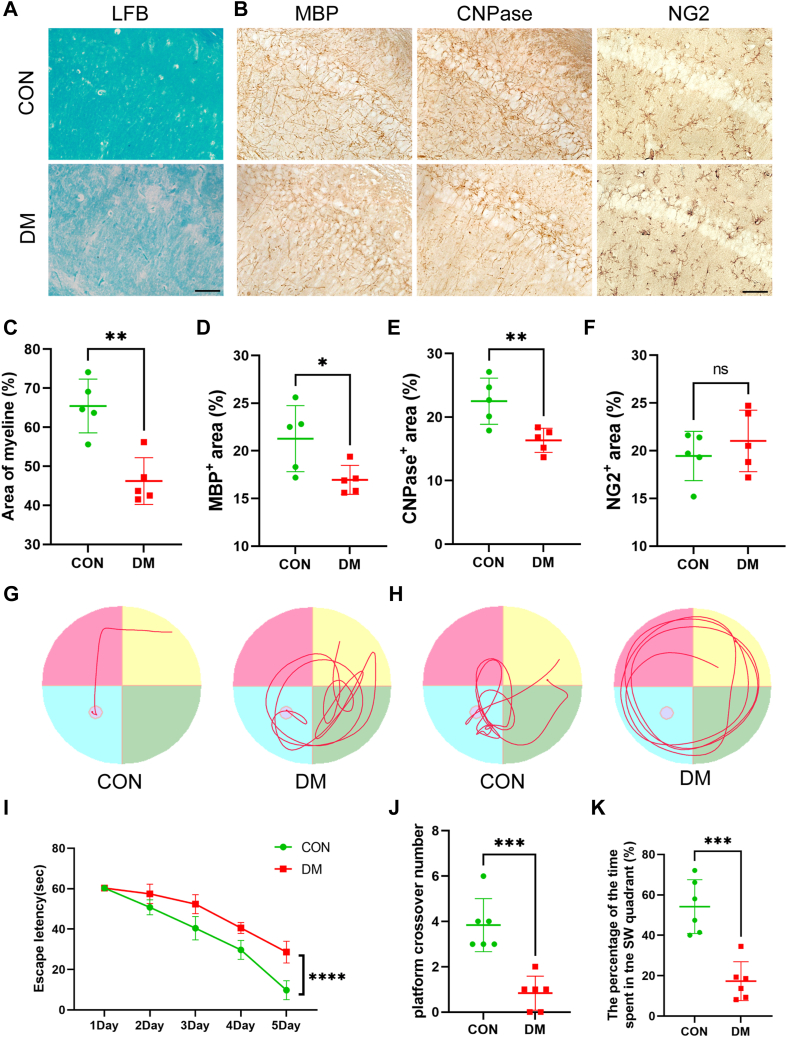
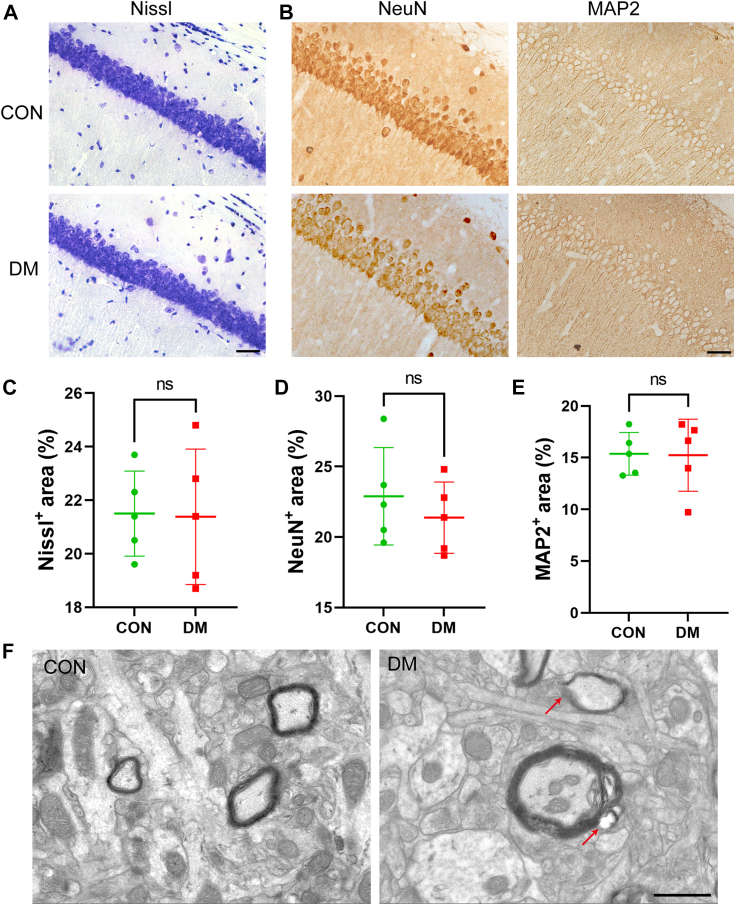
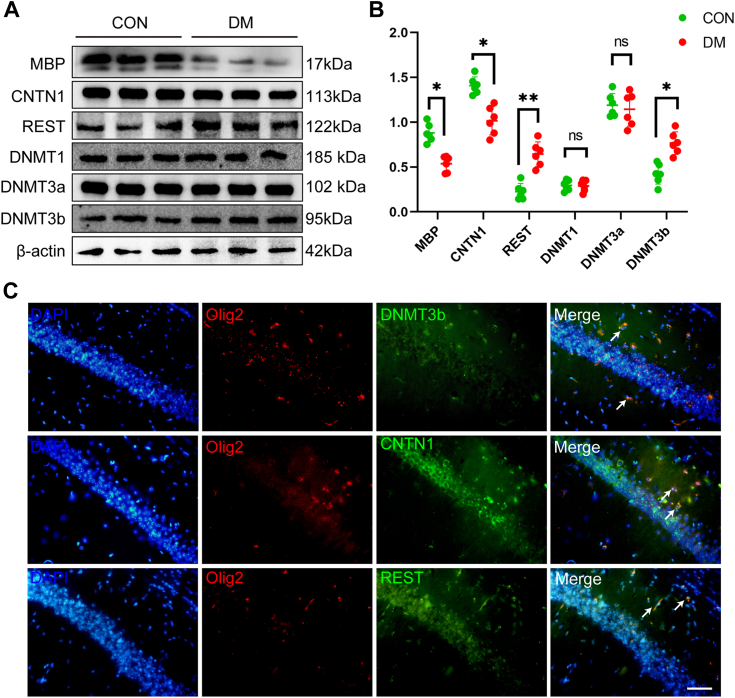
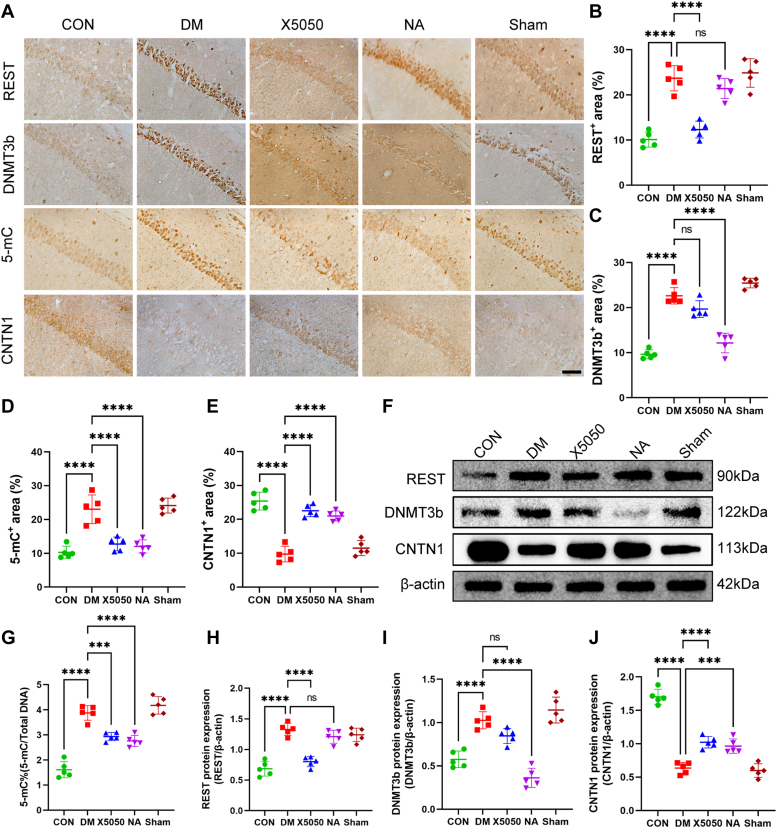
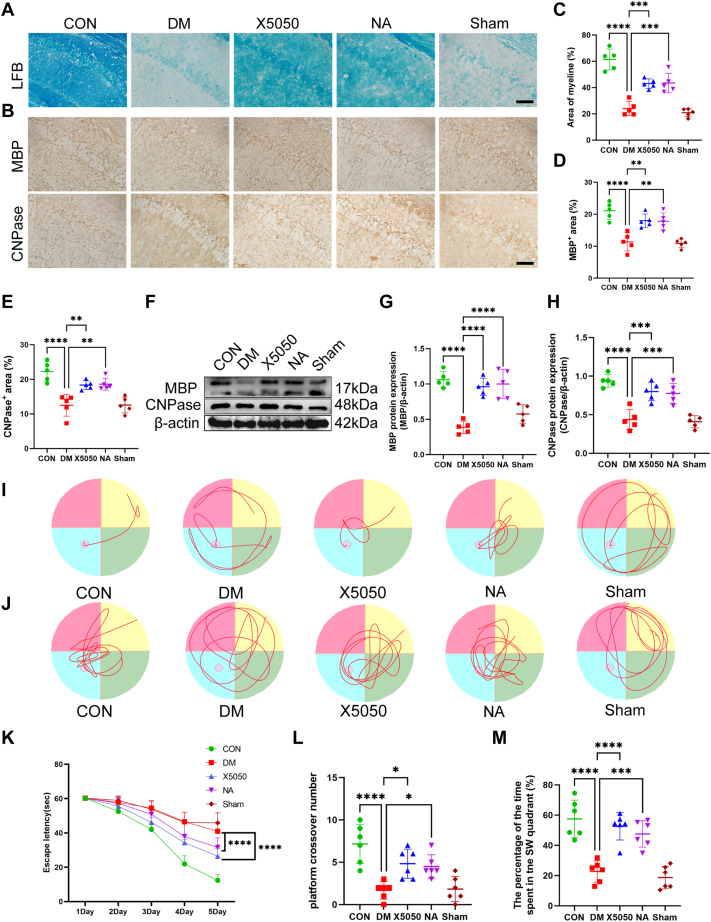
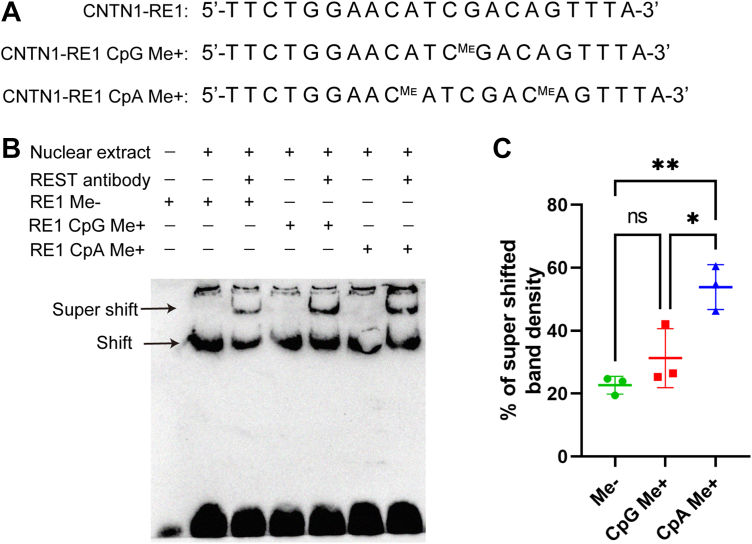
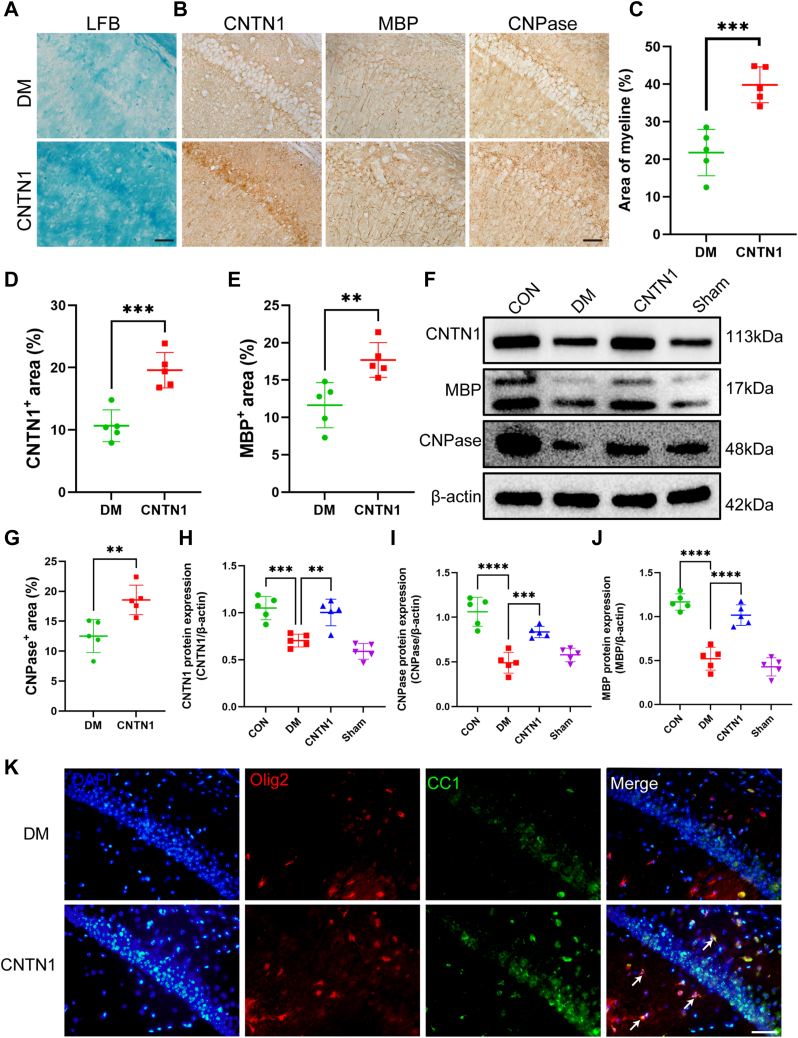
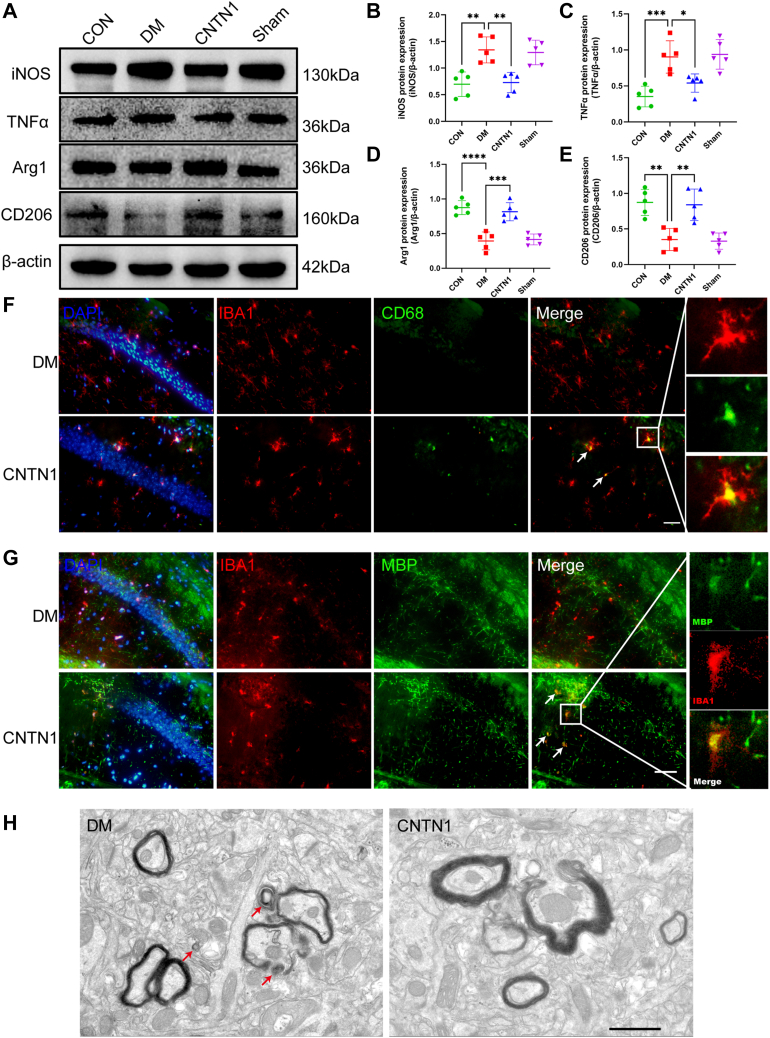
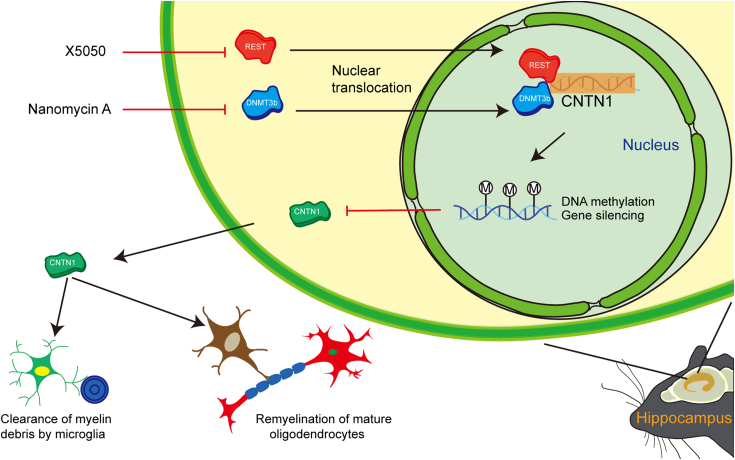
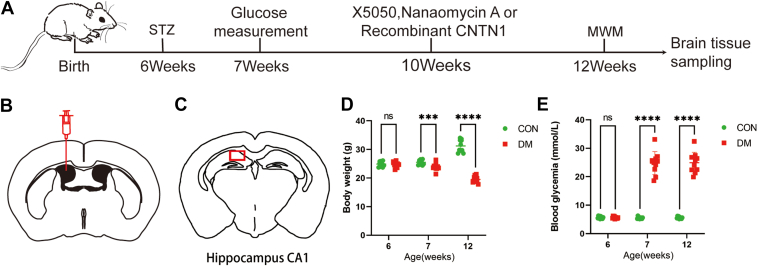
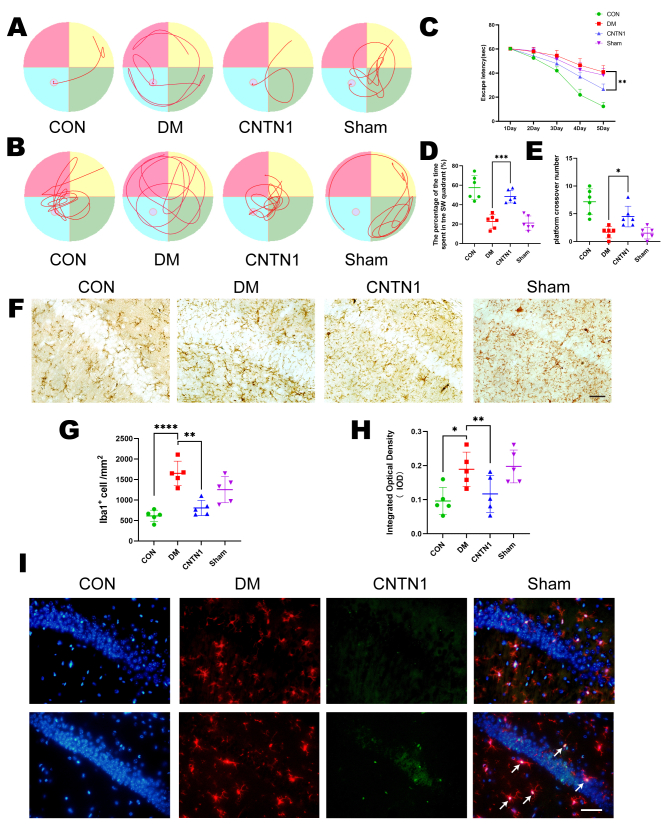
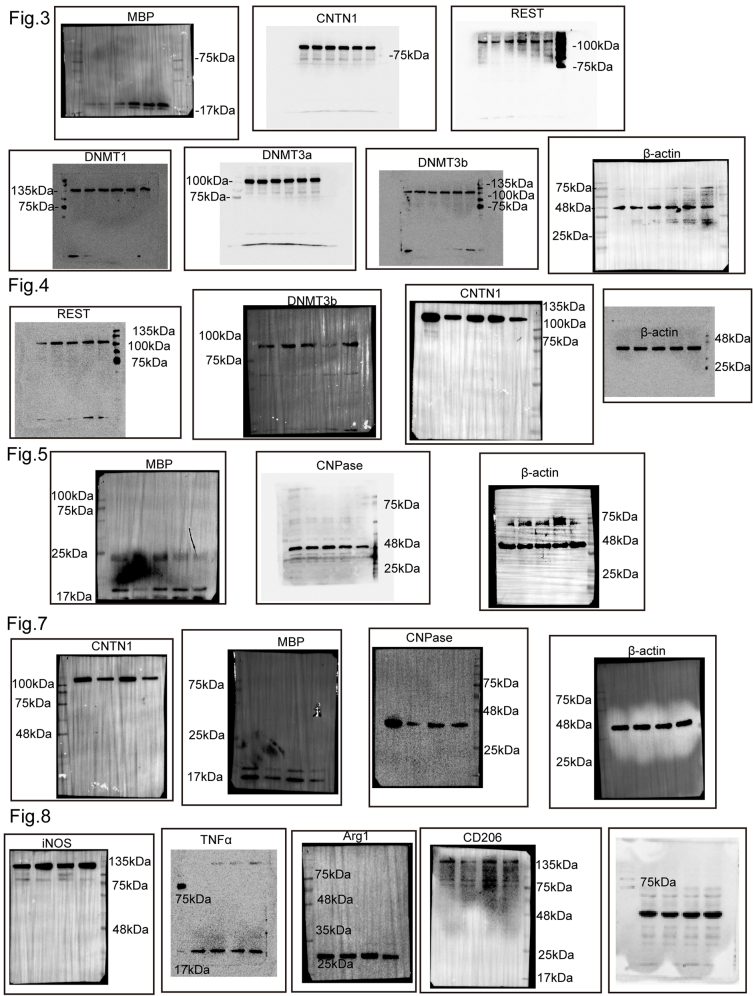
The remyelination process within the diabetes mellitus (DM) brain is inhibited, and dynamic interactions between DNA methylation and transcription factors are critical for this process. Repressor element-1 silencing transcription factor (REST) is a major regulator of oligodendrocyte differentiation, and the role of REST on DM remyelination remains to be investigated. Here, we investigated the effects of REST and DNA methylation on DM remyelination and explored the underlying mechanisms. In this study, using a diabetic mouse model, we found that myelin damage preceded neuronal damage and caused cognitive impairment in DM mice. Inhibition of REST by X5050 and DNMT3b by Naomycin A promoted myelin regeneration in the hippocampus and ameliorated cognitive deficits in DM mice. In addition, CpA methylation of the RE-1 locus of the CNTN1 gene was able to increase the binding capacity of REST. We also observed that CNTN1 promotes oligodendrocyte maturation, facilitates the ratio of microglia to pro-regenerative phenotypes as well as enhances the ability of microglia to remove myelin debris. Our findings suggest that REST and DNMT3b expression inhibit CNTN1 expression and exacerbate myelin damage. This mechanism of gene silencing may be associated with DNMT3b-mediated CpA methylation of the REST binding site in the promoter region of the CNTN1 gene. We also identified the role for CNTN1 in promoting oligodendrocyte precursor cell maturation and myelin debris removal during remyelination.

Keywords: CNTN1; DNA methylation; REST; demyelination; diabetes mellitus; oligodendrocyte.


Conflict of interest statement

Conflict of interest The authors declare that they have no conflicts of interest with the contents of this article.

Figures

Figure 1
Figure 1
DM resulted in cognitive impairment and demyelination in mice.A and C, representative LFB staining in different groups (A) and quantification of myelinated areas (C). Two-tailed Student’s t tests were used for analysis, N = 5/group. Scale bar = 50 μm. B, representative images of MBP, CNPase and NG2 expression in different groups. Two-tailed Student’s t tests were used for analysis, N = 5/group. Scale bar = 50 μm. D–F, quantification of the protein expression of MBP (D), CNPase (E) and NG2 (F) in the different groups. N = 5/group. G, representative swimming route traces of mice from different groups. H, representative images of swimming route traces of mice from different groups after removal of the platform. I, in the MWM experiment, the escape latency of the mice during the acquisition test was recorded (N = 6/group). Two-way ANOVA followed by Tukey’s test was used for analysis. J, quantitative analysis of the original platform location-crossing frequency within 60 s. N = 6/group. K, statistical analysis of the percentage of time spent in the target quadrant during the probe trial across all groups. N = 6/group. One-tailed Student’s t tests were used for analysis. ∗p < 0.05, ∗∗p < 0.01, ∗∗∗p < 0.001.
Figure 2
Figure 2
Disruption of myelin but not axonal nerve structure in DM mice.A and C, representative Nissl staining (A) of the CON and DM groups and quantification of myelinated areas (C). N = 5/group. Scale bar = 50 μm. B, representative images of NeuN and MAP2 expression in the CON and DM groups. Scale bar = 50 μm. D and E, quantification of the protein expression of NeuN (D) and MAP2 (E) in the different groups. Two-tailed Student’s t tests were used for analysis. F, representative cross-sectional EM images of myelinated neurons in the hippocampus. N = 5/group. Scale bar = 1 μm.
Figure 3
Figure 3
Decreased expression of MBP and CNTN1 and increased expression of REST and DNMT3b in the hippocampus of DM mice.A, representative Western blot images of MBP, CNTN1, REST, DNMT1, DNMT3a, DNMT3b, and β-actin protein expression across different groups. B, quantification of the protein expression levels of MBP, CNTN1, REST, DNMT1, DNMT3, and DNMT3b in the CON and DM groups. N = 5/group. One-way ANOVA with Tukey’s post hoc test was used for analysis. C, representative images of immunofluorescence in the CA1 region of the DM mouse hippocampus, where Olig2-labelled OLs were double-labeled using fluorescence to indicate colocalization with CNTN1, REST, and DNMT3b. N = 5/group. Scale bar = 50 μm. ∗p < 0.05, ∗∗p < 0.01.
Figure 4
Figure 4
X5050 administration inhibited REST expression. Nanomycin A administration inhibited the expression of DNMT3b, alleviated the reduction in CNTN1 expression in the brains of DM mice and suppressed the increase in 5 mC levels in DM mice. A, representative images of REST, DNMT3b, 5-mC and CNTN1 expression staining in CA1 from different groups. Scale bar = 50 μm. BE, quantification of REST (B), DNMT3b (C), 5-mC (D), and CNTN1 (E) protein expression in the different groups. N = 5/group. G, total DNA methylation levels in different groups. N = 5/group. F, Representative Western blot images showing REST, DNMT3b, CNTN1, and β-actin expression in the different groups. HJ, quantification of REST (H), DNMT3b (I), and CNTN1 (J) protein expression in the different groups. N = 5/group. Two-way ANOVA with Tukey’s post hoc test was used for analysis. ∗∗∗p < 0.001, ∗∗∗∗p < 0.0001.
Figure 5
Figure 5
Inhibition of REST and DNMT3b expression ameliorates myelin damage and alleviates cognitive dysfunction in DM mice.A and C, representative LFB staining of the CA1 region in different groups (A) and quantification of myelinated areas (C). N = 5/group. Scale bar = 50 μm. B, representative images of MBP and CNPase expression staining in different groups. Scale bar = 50 μm. D and E, quantification of the protein expression of MBP (D) and CNPase (E) in the different groups. N = 5/group. F, Representative Western blot images of MBP, CNPase and β-actin expression staining in the different groups. G and H, quantification of the protein expression of MBP (G) and CNTN1 (H) in the different groups. N = 5/group. Two-way ANOVA with Tukey’s post hoc test was used for analysis. I, representative swimming route traces of mice from different groups. J, representative images of swimming route traces of mice from different groups after removal of the platform. K, in the MWM experiment, the escape latency of the mice during the acquisition test was recorded (N = 6/group). Two-way ANOVA followed by Tukey’s test was used for analysis. L, Quantitative analysis of the frequency of original platform location-crossing within 60 s. N = 6/group. One-way ANOVA with Tukey’s post hoc test was used for analysis. M, Statistical analysis of the percentage of time spent in the target quadrant during the probe trial among the groups. N = 6/group. One-way ANOVA with Tukey’s post hoc test was used for analysis. ∗p < 0.05, ∗∗p < 0.01, ∗∗∗p < 0.001, ∗∗∗∗p < 0.0001.
Figure 6
Figure 6
CpA methylation of the CNTN1-RE1 facilitates REST binding.A, the biotinylated CNTN1-RE1 with varied CpG or CpA methylation (Me+) in probes used for EMSA. B, representative blot of EMSA results using hippocampal nuclear extracts and biotinylated CNTN1-RE1. C, Percentage (%) of supershifted bands/total conjugates (N = 3/group), calculated using Student's t test. ∗p < 0.05, ∗∗p < 0.01.
Figure 7
Figure 7
Injection of CNTN1 recombinant protein promotes OL maturation and improves hippocampal demyelination in DM mice.A and C, representative LFB staining of CA1 in different groups (A) and quantification of myelinated areas (C). N = 5/group. Scale bar = 50 μm. B, representative images of CNTN1, MBP and CNPase expression in different groups. Scale bar = 50 μm. D, E, and G, quantification of the protein expression of CNTN1 (D), MBP (E) and CNPase (G) in the different groups. N = 5/group. F, representative Western blot images showing CNTN1, MBP, CNPase and β-actin expression across the different groups. HJ, quantification of the protein expression of CNTN1 (H), MBP (I), and CNTN1 (J) across the different groups. N = 5/group. Two-way ANOVA with Tukey’s post hoc test was used for analysis. K, immunofluorescence double labelling of Olig2 and CC1 expression across different groups, with arrows indicating Olig2+ and CC1+ cells. N = 5/group. Scale bar = 50 μm. ∗∗p < 0.01, ∗∗∗p < 0.001, ∗∗∗∗p < 0.0001.
Figure 8
Figure 8
Injection of CNTN1 promotes microglial polarization to the M2 phenotype and facilitates myelin fragment clearance in DM mice.A, representative Western blot images showing iNOS, TNFɑ, Arg1, CD206, and β-actin expression across the different groups. D–F, quantification of the protein expression of iNOS (B), TNF-ɑ (C), Arg1 (D), and CD206 (E) across the different groups. N = 5/group. Two-way ANOVA with Tukey’s post hoc test was used for analysis. F, Immunofluorescence double labelling of Iba1 and CD68 across different groups, with arrows indicating Iba1+ and CD68+ cells. N = 5/group. Scale bar = 50 μm. G, Immunofluorescence double labelling of Iba1 and MBP across different groups, with arrows indicating Iba1+ and MBP+ cells. N = 5/group. Scale bar = 50 μm. ∗p < 0.05, ∗∗p < 0.01, ∗∗∗p < 0.001, ∗∗∗∗p < 0.0001. H, representative cross-sectional EM images of myelinated neurons in the hippocampus. N = 5/group. Scale bar = 1 μm.
Figure 9
Figure 9
Graphic Abstract. A proposed mechanism outlines the inhibitory effect of REST and DNMT3b on CNTN1 in the hippocampus of diabetic mice and the role of CNTN1 in myelin regeneration.
Figure 10
Figure 10
The diabetic model was successfully constructed. A, animal experimental design. B, schematic diagram of stereotaxic injections to the lateral ventricles of mice. C, locations of pathological and immunohistochemical staining. D, changes in body weights of the mice. N = 10/group. E, changes in blood glucose levels in mice. N = 10/group. ∗∗∗p < 0.001, ∗∗∗∗p < 0.0001.
Figure S1
Figure S1
Figure S2
Figure S2

Similar articles

Cited by

  • Spinal Cord Injury Remyelination: Pathways to Therapies.
    Kaniuk JK, Kumar D, Tennyson J, Hurka KL, Margolis A, Bucaloiu A, Selner A, Ahuja CS. Kaniuk JK, et al. Int J Mol Sci. 2025 Jul 26;26(15):7249. doi: 10.3390/ijms26157249. Int J Mol Sci. 2025. PMID: 40806380 Free PMC article. Review.

References

    1. Saeedi P., Petersohn I., Salpea P., Malanda B., Karuranga S., Unwin N., et al. Global and regional diabetes prevalence estimates for 2019 and projections for 2030 and 2045: results from the International Diabetes Federation Diabetes Atlas, 9(th) edition. Diabetes Res. Clin. Pract. 2019;157 - PubMed
    1. Grunblatt E., Bartl J., Riederer P. The link between iron, metabolic syndrome, and Alzheimer's disease. J. Neural. Transm. (Vienna) 2011;118:371–379. - PubMed
    1. Biessels G.J., Staekenborg S., Brunner E., Brayne C., Scheltens P. Risk of dementia in diabetes mellitus: a systematic review. Lancet Neurol. 2006;5:64–74. - PubMed
    1. Wong R.H., Scholey A., Howe P.R. Assessing premorbid cognitive ability in adults with type 2 diabetes mellitus--a review with implications for future intervention studies. Curr. Diab. Rep. 2014;14:547. - PubMed
    1. Bellia C., Lombardo M., Meloni M., Della-Morte D., Bellia A., Lauro D. Diabetes and cognitive decline. Adv. Clin. Chem. 2022;108:37–71. - PubMed

MeSH terms

Substances

LinkOut - more resources