. 2025 Feb;48(2):100173.
doi: 10.1016/j.mocell.2024.100173. Epub 2024 Dec 25.

Autophagic signatures in peripheral blood mononuclear cells from Parkinson's disease patients

Affiliations

Autophagic signatures in peripheral blood mononuclear cells from Parkinson's disease patients

Myung Shin Lee et al. Mol Cells. 2025 Feb.

Abstract

Parkinson's disease (PD) is a progressive neurodegenerative disorder characterized by motor impairments and the accumulation of misfolded α-synuclein. Dysregulation of the autophagy-lysosomal pathway (ALP), responsible for degrading misfolded proteins, has been implicated in PD pathogenesis. However, current diagnostic approaches rely heavily on motor symptoms, which occur due to substantial neurodegeneration, limiting early detection and intervention. This study investigated the potential of ALP-associated proteins in peripheral blood mononuclear cells (PBMCs) as diagnostic biomarkers for early-stage PD. Quantitative analysis revealed a significant reduction in optineurin levels in PBMCs from PD patients, and the expression levels of various ALP-associated proteins were tightly correlated, suggesting a coordinated dysregulation of the pathway. Correlation analyses revealed associations between ALP-associated features and clinical characteristics, such as age of onset and motor impairment. Furthermore, the study identified multiple positive correlations among ALP-associated proteins and functional readouts, highlighting the interconnectivity within the pathway. Notably, a PBMC biomarker model incorporating lysosomal-associated membrane protein 1 and optineurin exhibited high diagnostic accuracy (86%) in distinguishing PD patients from controls. These findings highlight the potential of ALP-associated protein signatures in PBMCs as novel diagnostic biomarkers for early detection and intervention in PD, offering insights into the systemic manifestations of the disease.

Keywords: Autophagy-lysosomal pathway; Biomarkers; Lysosomal-associated membrane protein 1; Optineurin; Parkinson’s disease.


Conflict of interest statement

DECLARATION OF COMPETING INTERESTS The authors declare that they have no known competing financial interests or personal relationships that could have appeared to influence the work reported in this paper.

Figures
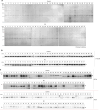
Fig. 1
Fig. 1
Dysregulated expression of OPTN in PBMCs from PD patients. (A) Total proteins present in the PBMC lysates derived from controls (n = 36) and PD patients (n = 33) were separated by SDS-PAGE and subsequently stained with Ponceau S. (B and C) The PBMC proteins were analyzed by immunoblotting with the indicated antibodies. Arrowheads indicate specific protein bands. (D-I) Band intensities for OPTN (D), ATG5 (E), ATP13A2 (F), BAG3 (G), LAMP1 (H), and p62 (I) were measured and normalized to the mean intensity of the control group. Solid lines indicate median values, and dotted lines denote quartiles (Q1, Q3) for each group. *P < .05, Mann-Whitney U test.
Fig. 1
Fig. 1
Dysregulated expression of OPTN in PBMCs from PD patients. (A) Total proteins present in the PBMC lysates derived from controls (n = 36) and PD patients (n = 33) were separated by SDS-PAGE and subsequently stained with Ponceau S. (B and C) The PBMC proteins were analyzed by immunoblotting with the indicated antibodies. Arrowheads indicate specific protein bands. (D-I) Band intensities for OPTN (D), ATG5 (E), ATP13A2 (F), BAG3 (G), LAMP1 (H), and p62 (I) were measured and normalized to the mean intensity of the control group. Solid lines indicate median values, and dotted lines denote quartiles (Q1, Q3) for each group. *P < .05, Mann-Whitney U test.
Fig. 2
Fig. 2
Assessment of autophagic activity in PBMCs from PD patients. (A) PBMCs from controls (n = 40) and PD patients (n = 36) were treated with DMSO or chloroquine (CQ) for 6 h and then analyzed via immunoblotting with the indicated antibodies. (B) Band intensities for LC3A/B-II were measured, and autophagic flux was calculated by quantifying the ratio of LC3A/B-II levels in CQ-treated cells over DMSO-treated cells. Solid lines indicate median values, and dotted lines denote quartiles (Q1, Q3) for each group. (C) Intensities in PBMCs from controls (n = 40) and PD patients (n = 37) stained with LysoTracker Red DND-99 were analyzed using flow cytometry. The LysoTracker intensity determined by the median value of the intensities were quantitatively analyzed. Solid lines indicate median values, and dotted lines denote quartiles (Q1, Q3) for each group. Mann-Whitney U test.
Fig. 3
Fig. 3
Correlation analysis of ALP-associated features in PBMCs. (A) Spearman’s rank correlation matrix among ALP-associated proteins. (B-N) Scatter plots illustrating correlations between levels of ATG5 and ATP13A2 (B), BAG3 (C), LAMP1 (D), OPTN (E), p62 (F); ATP13A2 and BAG3 (G), p62 (H); BAG3 and LAMP1 (I), OPTN (J), p62 (K); LAMP1 and OPTN (L), p62 (M); and OPTN and p62 (N) in PBMCs. Gray and orange circles represent individual control and PD samples, respectively. Spearman's rank correlation coefficient (r) and P-values are shown for each correlation.
Fig. 4
Fig. 4
Correlation analysis between ALP-associated features in PBMCs and clinical/demographic data. (A) Spearman's rank correlation matrix among ALP-associated proteins and clinical/demographic features. (B-D) Scatter plots illustrating correlations between ATP13A2 levels and UPDRS-III scores (B), autophagic flux and age of onset (C), and autophagic flux and duration of education (D) in PBMCs. Gray and orange circles represent individual control and PD samples, respectively. Spearman's rank correlation coefficient (r) and p-values are shown for each correlation.
Fig. 5
Fig. 5
Diagnostic performance of the PBMC biomarker model. (A) ROC curves comparing the diagnostic accuracy of individual biomarkers (LAMP1 and OPTN) and their combination in distinguishing PD patients from controls. Additional details are provided in Table 4. (B) PBMCs were isolated from blood samples of PD patients and age-matched controls. The expression levels of ALP-associated proteins were quantified, and autophagic flux and lysosomal pH were assessed in PBMCs. Correlation analysis was performed among ALP-associated proteins, autophagic activity, and clinical data. The diagnostic accuracy of the PBMC biomarker model incorporating LAMP1 and OPTN was evaluated using ROC curve analysis.

References

    1. Athauda D., Foltynie T. The ongoing pursuit of neuroprotective therapies in Parkinson disease. Nat Rev Neurol. 2015;11:25–40. - PubMed
    1. Balducci C., Pierguidi L., Persichetti E., Parnetti L., Sbaragli M., Tassi C., Orlacchio A., Calabresi P., Beccari T., Rossi A. Lysosomal hydrolases in cerebrospinal fluid from subjects with Parkinson's disease. Mov Disord. 2007;22:1481–1484. - PubMed
    1. Balestrino R., Schapira A.H.V. Parkinson disease. Eur J Neurol. 2020;27:27–42. - PubMed
    1. Braak H., Del Tredici K., Rub U., de Vos R.A., Jansen Steur E.N., Braak E. Staging of brain pathology related to sporadic Parkinson's disease. Neurobiol Aging. 2003;24:197–211. - PubMed
    1. Cheng H.C., Ulane C.M., Burke R.E. Clinical progression in Parkinson disease and the neurobiology of axons. Ann Neurol. 2010;67:715–725. - PMC - PubMed