. 2024 Dec 27;15(1):10726.
doi: 10.1038/s41467-024-55388-3.

A conserved pilin from uncultured gut bacterial clade TANB77 enhances cancer immunotherapy

Affiliations

A conserved pilin from uncultured gut bacterial clade TANB77 enhances cancer immunotherapy

Chan Yeong Kim et al. Nat Commun. .

Abstract

Immune checkpoint blockade (ICB) has become a standard anti-cancer treatment, offering durable clinical benefits. However, the limited response rate of ICB necessitates biomarkers to predict and modulate the efficacy of the therapy. The gut microbiome's influence on ICB efficacy is of particular interest due to its modifiability through various interventions. However, gut microbiome biomarkers for ICB response have been inconsistent across different studies. Here, we identify TANB77, an uncultured and distinct bacterial clade, as the most consistent responder-enriched taxon through meta-analysis of ten independent ICB recipient cohorts. Traditional taxonomy fails to distinguish TANB77 from unrelated taxa, leading to its oversight. Mice with higher gut TANB77 abundance, either naturally or through transplantation, show improved response to anti-PD-1 therapy. Additionally, mice injected with TANB77-derived pilin-like protein exhibit improved anti-PD-1 therapy response, providing in vivo evidence for the beneficial role of the pilin-like protein. These findings suggest that pilins from the TANB77 order may enhance responses to ICB therapy across diverse cohorts of cancer patients.


Conflict of interest statement

Competing interests: I.L., S-J.H., H.R.K., C.Y.K., and B.C.A. are inventors of the patent (PCT/KR2021/008284) relevant to this work (Patent Applicant(s): Industry-academic cooperation foundation, Yonsei University; Inventors: Insuk Lee, Sang Jun Ha, Chan Yeong Kim, Hye Ryun Kim, Beung Chul Ahn). The remaining authors declare no competing interests.

Figures

Fig. 1
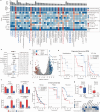
Fig. 1. Abundance of the TANB77 order in the gut microbiome is predictive of immunotherapy response and prognosis in a cohort of non-small cell lung cancer patients recruited at the Yonsei Cancer Center (YCC_1st).
a Volcano plot showing taxa enriched in responders (R, n = 18) or non-responders (NR, n = 31) in the YCC_1st cohort, produced by MaAsLin2 multivariable analysis. The horizontal dashed line indicates the unadjusted two-sided MaAsLin2 P = 0.05 threshold, and the vertical dashed line indicates the |MaAsLin2 coefficient | = 2 threshold. A positive MaAsLin2 coefficient means taxa are enriched in responders. TANB77 and its sub-taxa are highlighted in red. b Relative abundance of TANB77 in R and NR patients. Significance was evaluated by a two-tailed Mann-Whitney U test. The center line of the boxplot represents the median, the bounds of the box represent the 25th, and 75th percentiles, and the whiskers represent the minimum and maximum values within the 1.5 interquartile range from the lower and upper quartiles. c Receiver operating characteristic (ROC) curve illustrating the retrieval of responders based on the relative abundance of TANB77, with the area under the ROC curve (AUROC) indicated. d, e Kaplan-Meier plots representing progression-free survival (PFS, d) and overall survival (OS, e) of high- and low-TANB77 groups. Significance was evaluated by a two-tailed log-rank test. f, g Multivariate Cox regression models of PFS (f) and OS (g) in the YCC_1st cohort. Horizontal bars denote the 95% confidence interval (CI) of the hazard ratio (HR) for each category. Vertical marks indicate the HR. Significant categories are depicted by blue (decreasing HR) and red (increasing HR) bars, with their two-sided Cox regression test unadjusted P-values indicated (*P < 0.05, **P < 0.01, ***P < 0.001).
Fig. 2
Fig. 2. Higher abundance of TANB77 consistently correlates with improved clinical outcomes across diverse cohorts of ICB recipients.
a Gut microbial taxa showing consistent associations with ICB response in ten cohorts of immunotherapy recipients. The 50 taxa with the highest absolute consensus scores are shown, along with their consensus scores and unadjusted meta-analysis P-values (by MMUPHin, two-sided). Taxa are sorted by absolute consensus score. Taxa within the TANB77 and Hungatella clades are highlighted in blue and red, respectively. b MaAsLin2 effect size of TANB77 abundance as a predictor of immunotherapy response in individual cohorts and pooled samples. Center circle and horizontal line denote the MaAsLin2 coefficient and 95% confidence interval (CI), respectively. Statistically significant (two-sided unadjusted MaAsLin2 P < 0.05) cohorts are highlighted in blue. c Volcano plot representing MMUPHin coefficients and two-sided unadjusted P-values. A positive coefficient represents responder-enriched taxa. The x-axis scale was calculated using a symmetric log function. d Kaplan-Meier (KM) plots representing progression-free survival (PFS) of high- and low-TANB77 groups in the Gopalakrishnan, Peters, and YCC_2nd cohorts. Significance was evaluated by a one-tailed log-rank test. e Number of patients with PFS above or below certain months in the Routy, Lee-PRIMM-UK, and Lee-PRIMM-NL cohorts. Patients were categorized into high- and low-TANB77 groups. Significance was evaluated by a one-tailed Fisher’s exact test. f KM plots representing overall survival (OS) of high- and low-TANB77 groups in the Derosa, Peters, and YCC_2nd cohorts. Significance was evaluated by a one-tailed log-rank test. g Change in the tumor size after immunotherapy treatment in the Frankel and Matson cohorts. Significance was evaluated by a one-tailed Mann-Whitney U test. The center line of the boxplot represents the median, the bounds of the box represent the 25th, and 75th percentiles, and the whiskers represent the minimum and maximum values within the 1.5 interquartile range from the lower and upper quartiles. h Summary of the association between high TANB77 abundance in the gut and ICB therapy outcome in ten cohorts. Source data are provided as a Source Data file. (*P < 0.05, **P < 0.01, ***P < 0.001).
Fig. 3
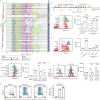
Fig. 3. TANB77 is a distinct bacterial clade that is misclassified in the NCBI taxonomy system.
a Comparative taxonomic classification of TANB77 genomes. TANB77 genomes are classified into seven NCBI families shown on the right (the relationship is highlighted in red lines), and the genomes within these NCBI clades are classified into multiple GTDB orders on the left. b Comparison of GC content between genomes classified as TANB77 and non-TANB77 genomes within the top three NCBI families containing the most TANB77 genomes. Significance was evaluated by a two-tailed Mann-Whitney U test. (**P < 0.01, ***P < 0.001).
Fig. 4
Fig. 4. TANB77 abundance in the murine gut microbiome correlates with anti-PD-1 (aPD-1) therapy response.
a TANB77 abundance in JAX and TAC phenotype mice. Significance was evaluated by a two-tailed Mann Whitney U test. The center line of the boxplot represents the median, the bounds of the box represent the 25th, and 75th percentiles, and the whiskers represent the minimum and maximum values within the 1.5 interquartile range from the lower and upper quartiles. b Changes of TANB77 abundance in guts of “JAX to TAC” (blue, n = 6) and “TAC to TAC” (red, n = 6) mice after transplantation. The plot denotes average TANB77 abundance ± SEM. Statistical significance was calculated by a two-tailed Mann-Whitney U test. c Relative abundance of TANB77 in JAX donor (navy, n = 4) and TAC recipient mice on day 14 (D + 14). The plot denotes average TANB77 abundance ± SEM. Statistical significance was calculated by a two-tailed Mann-Whitney U test. d Schematic timeline of the mouse experiment relative to the tumor injection date. e Tumor growth curve of high- and low-TANB77 mice subjected to aPD-1 or isotype treatment. Data points and error bars represent the mean ± SEM of tumor volume from two independent experiments (aPD1 high-TANB77 = 9, aPD1 low-TANB77 = 12, Isotype high-TANB77 = 12, Isotype low-TANB77 = 9). Significance was evaluated by two-way ANOVA using Tukey’s multiple comparison post hoc test (all significant comparisons are shown). f Correlation between normalized tumor growth and relative abundance of the UMGS1663 genus in aPD-1 treated mice from day 11 (D + 11) to D + 14 (left), from D + 14 to D + 17 (center), and from D + 17 to D + 20 (right). The plots share y-axis. Solid lines denote linear regression. Source data are provided as a Source Data file. (n.s.: not significant, *P < 0.05, **P < 0.01, ***P < 0.001, ****P < 0.0001).
Fig. 5
Fig. 5. FMT from a high-TANB77 human donor to mice improves the efficacy of anti-PD-1 treatment.
a Timeline of human-to-mice FMT experiments. b Relative abundance of TANB77 in high- and low-TANB77 donors compared to global population (n = 20,900) and ICB recipients (n = 660). Blue and red horizontal lines indicate the relative abundance of high-TANB77 and low-TANB77 donor, respectively. c Tumor growth curve of high- and low-TANB77 FMT recipient mice subjected to anti-PD-1 or isotype treatment. Each treatment group had six to eight mice allocated per group (aPD1 high-TANB77 = 7, aPD1 low-TANB77 = 8, Isotype high-TANB77 = 6, Isotype low-TANB77 = 8). Data points and error bars represent the mean ± SEM. Significance was evaluated by two-way ANOVA using Tukey’s multiple comparison post hoc test (all significant comparisons are shown). d Survival curve for high- and low-TANB77 FMT recipient mice. Significance was evaluated by the pairwise two-tailed log-rank test (all significant comparisons are shown). e Proportion of Ki-67+ PD-1+ CD8+ T cells in mice PBMCs on D + 15. Significance was evaluated by a two-tailed Mann-Whitney U test and the error bars represent mean ± SEM f Schematic diagram of sequential filtration steps to identify candidate taxa responsible for improving the ICB response in high-TANB77 FMT recipient mice. g Relative abundance of the CAG-245 genus in high- (n = 13) and low-TANB77 (n = 16) FMT recipient mice feces. Significance was evaluated by two-tailed Mann-Whitney U test. b, g The center line of the boxplot represents the median, the bounds of the box represent the 25th, and 75th percentiles, and the whiskers represent the minimum and maximum values within the 1.5 interquartile range from the lower and upper quartiles. Source data are provided as a Source Data file. (n.s.: not significant, *P < 0.05, **P < 0.01, ***P < 0.001, ****P < 0.0001).
Fig. 6
Fig. 6. Pilin-like proteins exclusively conserved among TANB77 order augments responsiveness of adaptive immunity through TLR4 signaling in antigen presenting cells.
a Diagram of a pilus gene cluster conserved in TANB77. The tree on the left represents the maximum likelihood phylogenetic tree of 129 representative MAGs of TANB77 species. The center plot illustrates the length and relative location of genes. The arrows represent coding sequences, and arrows with the same color indicate homologous sequences, while gray arrows represent non-conserved genes. The black lines represent contigs. The ‘x’ mark represents the end of the contig. The heatmap on the right provides information on the source of the genome and family. b A representative gene cluster derived from HRGM_Genome_2725, which is highlighted in red (a). The arrows represent coding sequences. The products of genes 927 to 932 are potentially involved in assembly machinery, and products of genes 932 to 938 are pilin-like proteins. Black triangles indicate the predicted promoters. c, d Mouse BMDCs (c) and human monocyte derived dendritic cells (d) were stimulated with indicated agonists targeting TLR2 and TLR4 and pilin 938 at indicated concentration for 24 hours. e After an hour of pre-treatment with TAK-242 inhibitors, BMDC were stimulated for 24 hours with TLR agonists and pilin 938 at the indicated concentration. f BMDC created from WT and TLR4 knockout (KO) bone marrow were stimulated with LPS and pilin 938 to see the TLR4 dependency of pilin 938 activation. g BMDCs were activated with either LPS or pilin 938 before being pulsed with GP33-41, then, these cells were co-cultured with P14 CD8+ T cells. cg The in vitro experiments were conducted in triplet (n = 3) and the error bars represent mean ± SEM. The data are representative of two independent experiments except for (d) and (f) which were conducted once. The statistical analysis was conducted using One-Way ANOVA Tukey’s multiple comparisons test other than (e) and (f) where student t-test was used for analysis. Source data are provided as a Source Data file. (*P < 0.05, **P < 0.01, ***P < 0.001, ****P < 0.0001).
Fig. 7
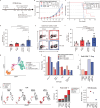
Fig. 7. In vivo administration of pilin 938 increases the proliferative and functional ability of tumor-infiltrated CD8+ T cell in combined with anti-PD-1 (aPD-1) treatment.
a Schematic timeline of the mouse experiment relative to the tumor injection date. b, c MC38 tumor growth of mice injected with or without pilin 938 along with aPD-1 treatment (b) and its corresponding survival curves (c). The significance between each group was calculated using the Mantel-Cox test. Each treatment group had seven mice (n = 7) allocated per group. d Frequency of Ki67+ PD-1+ CD8+ T cells from peripheral blood mononuclear cell (PBMC). (aPD1+Pilin 938 = 9, aPD1+PBS = 10, Isotype+Pilin938 = 9, Isotype+PBS = 10) e, f Flow cytometry plot (e) and bar graph (f) showing the cytokine expression frequency of tumor infiltrated CD8+ T cells stimulated ex vivo with PMA. Each treatment group had five mice (n = 5) per group. be Data points and error bars represent mean ± SEM. g UMAP plot showing subclusters of T cells integrated from all treatment types. h Proportions of T cell subclusters in T cells for each treatment group. i Ratios of proliferating CD8+ T cells to Treg. j UMAP plots of T cells colored with TCR clonal expansion status. k Cell count of clonal types from proliferating CD8+ T cell subsets. l Shannon index for indicating TCR diversity for T cells. For (b), the significance was calculated using Two-Way ANOVA with Tukey’s multiple comparisons test (all significant comparisons are shown), and for (c), the indicated significance was calculated using pairwise two-tailed log-rank test (all significant comparisons are shown). The significance shown in (d) and (f) were calculated using One-Way ANOVA Tukey’s multiple comparisons test. Except for FACS and sequencing data of tumor infiltrated CD8+ T cells (el), which were conducted once, all other data (ad) are representative of two independent experiments. Source data are provided as a Source Data file. (*P < 0.05, **P < 0.01, ***P < 0.001, ****P < 0.0001).

References

    1. Pardoll, D. M. The blockade of immune checkpoints in cancer immunotherapy. Nat Rev Cancer12, 252–264 (2012). - PMC - PubMed
    1. Waldman, A. D., Fritz, J. M. & Lenardo, M. J. A guide to cancer immunotherapy: from T cell basic science to clinical practice. Nat Rev Immunol20, 651–668 (2020). - PMC - PubMed
    1. Robert, C. et al. Pembrolizumab versus Ipilimumab in Advanced Melanoma. N Engl J Med372, 2521–2532 (2015). - PubMed
    1. Garon, E. B. et al. Pembrolizumab for the treatment of non–small-cell lung cancer. N Engl J Med372, 2018–2028 (2015). - PubMed
    1. Frankel, A. E. et al. Metagenomic shotgun sequencing and unbiased metabolomic profiling identify specific human gut microbiota and metabolites associated with immune checkpoint therapy efficacy in melanoma patients. Neoplasia19, 848–855 (2017). - PMC - PubMed

Publication types

MeSH terms

Substances

LinkOut - more resources