

Identification of Anoikis-related potential biomarkers and therapeutic drugs in chronic thromboembolic pulmonary hypertension via bioinformatics analysis and in vitro experiment
- PMID: 39730379
- PMCID: PMC11680802
- DOI: 10.1038/s41598-024-75251-1
Identification of Anoikis-related potential biomarkers and therapeutic drugs in chronic thromboembolic pulmonary hypertension via bioinformatics analysis and in vitro experiment
Abstract
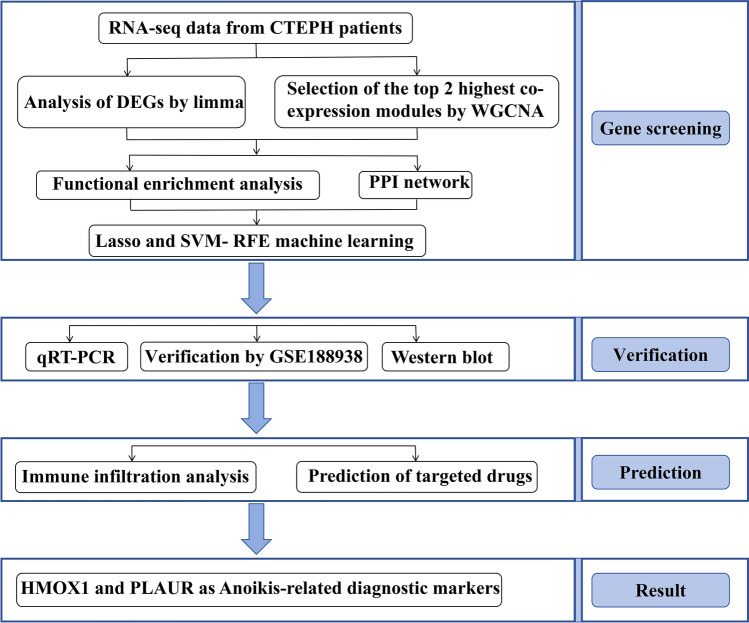
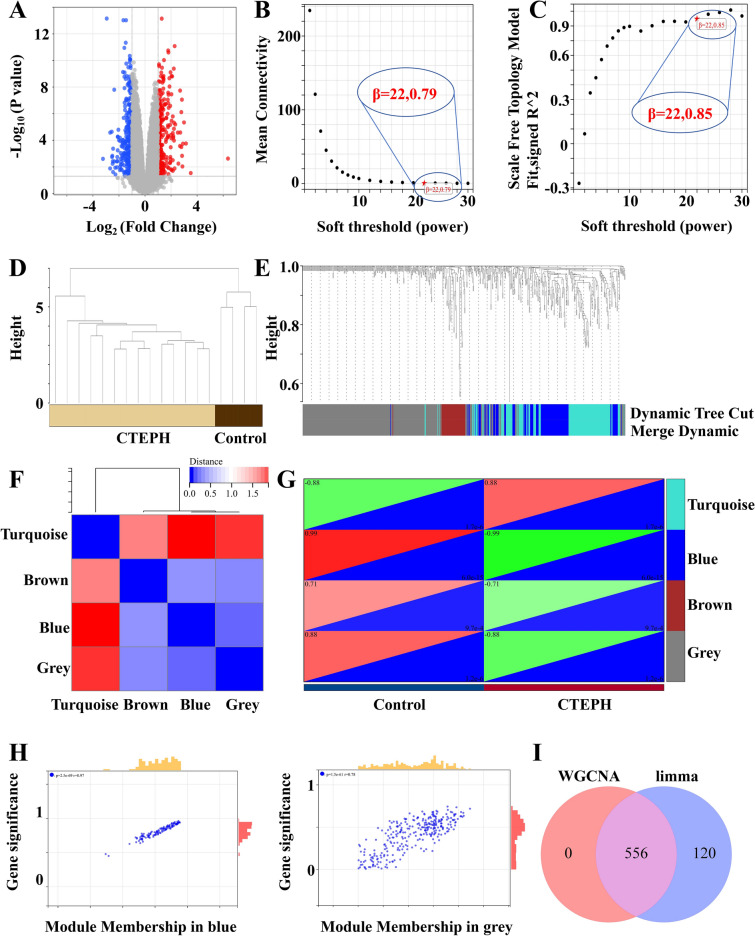
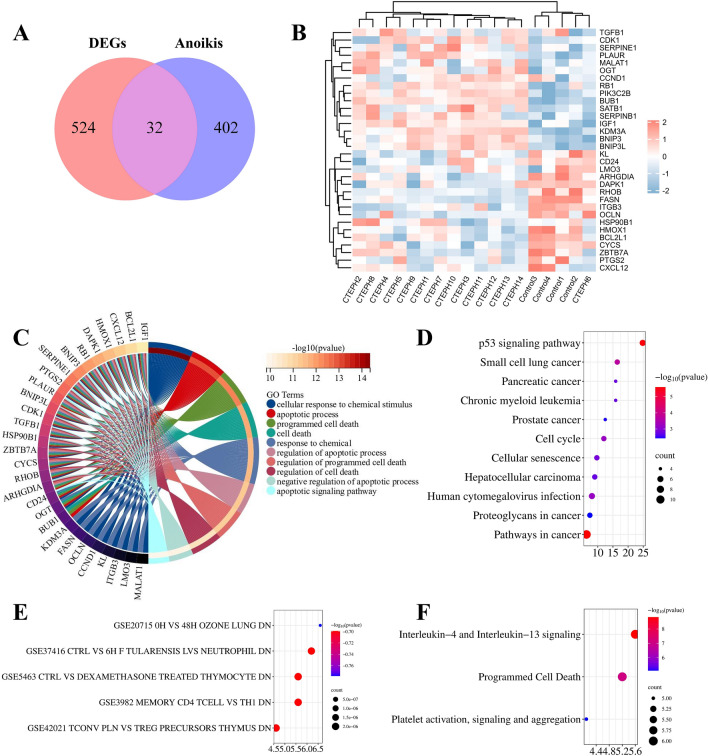
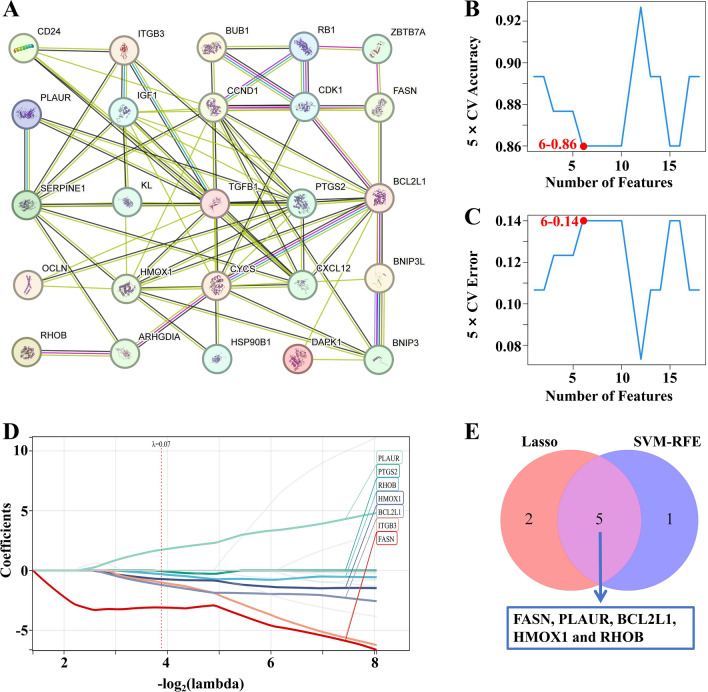
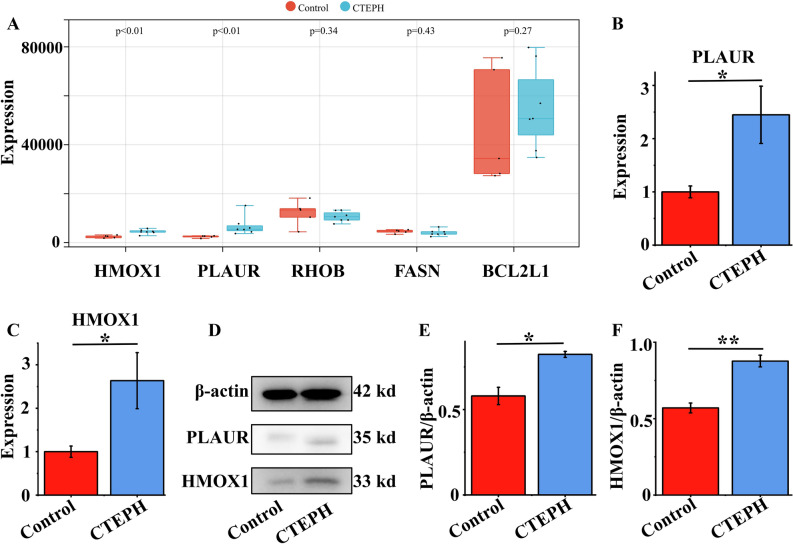
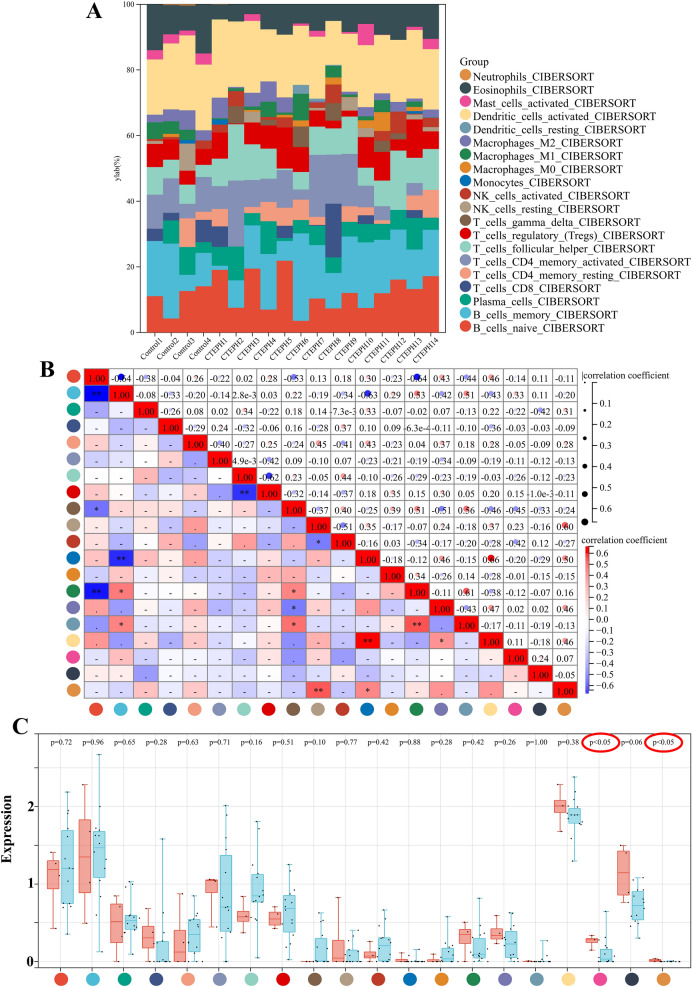
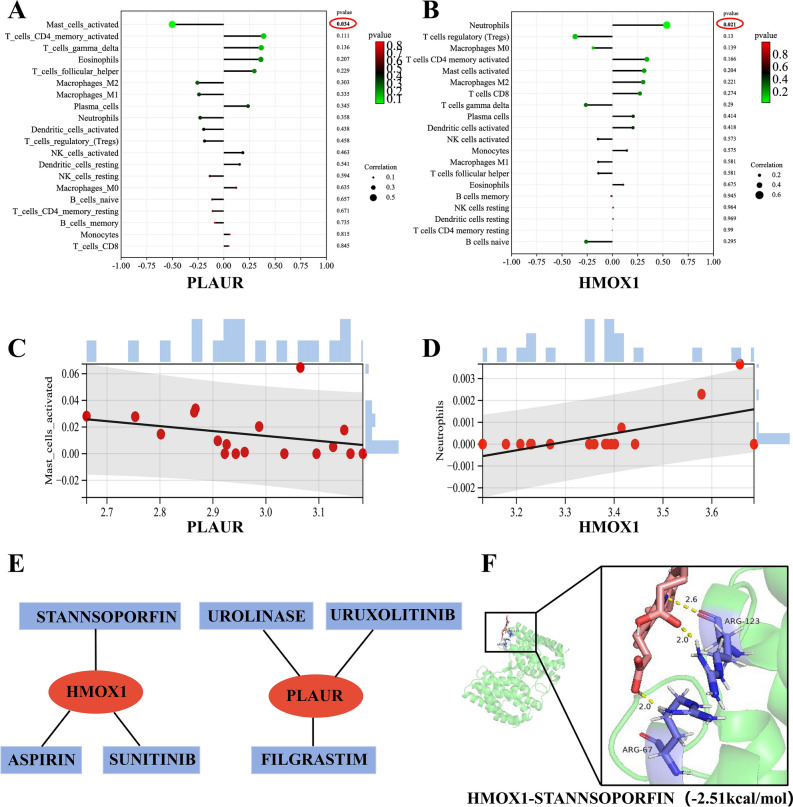
There is growing evidence that programmed cell death plays a significant role in the pathogenesis of chronic thromboembolic pulmonary hypertension (CTEPH). Anoikis is a newly discovered type of programmed death and has garnered great attention. However, the precise involvement of Anoikis in the progression of CTEPH remains poorly understood. The goal of this study was to identify Anoikis-related genes (ARGs) and explore potential therapeutic drugs for CTEPH. Differentially expressed genes were identified by limma and weighted gene co-expression network analysis (WGCNA) packages, and functional analyses were conducted based on the differentially expressed genes. Subsequently, a combination of protein-protein interaction (PPI), Least Absolute Shrinkage and Selection Operator (LASSO), and Support Vector Machine Recursive Feature Elimination (SVM-RFE) methodologies was employed to screen hub genes associated with CTEPH, which were further verified by dataset GSE188938, quantitative real-time polymerase chain reaction (qRT-PCR) and Western blot. CIBERSORT was utilized to evaluate the infiltration of immune cells and the relationship between infiltration-related immune cells and ARGs. Finally, targeted drug analysis and molecular docking were used to predict drugs targeting Anoikis process to treat CTEPH. Thirty-two differentially expressed genes related to Anoikis and CTEPH were screened through WGCNA analysis. Then, the key ARGs FASN, PLAUR, BCL2L1, HMOX1 and RHOB were screened by PPI, Lasso and SVM-RFE machine learning. Validation through dataset GSE188938, qRT-PCR, and Western blot analyses confirmed HMOX1 and PLAUR as powerful and promising biomarkers in CTEPH. In addition, CIBERSORT immunoinfiltration revealed that Mast_cells_activated and Neutrophils were involved in the pathological regulation of CTEPH. Correlation analysis indicated that HMOX1 was positively correlated with Neutrophils, while PLAUR was negatively correlated with Mast_cells_activated. Finally we used targeted drug analysis and molecular docking to identify that STANNSOPORFIN as a potential drug targeting HMOX1 for the treatment of CTEPH. HMOX1 and PLAUR emerge as potential biomarkers for CTEPH and may influence the development of CTEPH by regulating Anoikis. Mast_cells_activated and Neutrophils may be involved in Anoikis resistance in CTEPH patients, presenting novel insights into CTEPH therapeutic targets. STANNSOPORFIN is a potential agents targeting Anoikis process therapy for CTEPH.
Keywords: Anoikis; CTEPH; Diagnostic markers; Immune infiltration; Machine learning; Therapeutic drugs.
© 2024. The Author(s).
Conflict of interest statement
Declarations. Competing interests: The authors declare no competing interests. Informed consent: Informed Consent was obtained from patients and volunteers for the study. The study was approved by the institutional review board and the ethics committee of Henan Provincial People’s Hospital (Ethical Review No.: 2020-158). And we confirmed that the authors strictly complied with the Declaration of Helsinki.
Figures
Similar articles
-
Identification of Ferroptosis-related potential biomarkers and immunocyte characteristics in Chronic Thromboembolic Pulmonary Hypertension via bioinformatics analysis.BMC Cardiovasc Disord. 2023 Oct 11;23(1):504. doi: 10.1186/s12872-023-03511-5. BMC Cardiovasc Disord. 2023. PMID: 37821869 Free PMC article.
-
Machine learning based identification of anoikis related gene classification patterns and immunoinfiltration characteristics in diabetic nephropathy.Sci Rep. 2025 May 1;15(1):15271. doi: 10.1038/s41598-025-99395-w. Sci Rep. 2025. PMID: 40312440 Free PMC article.
-
Identification of a Novel Diagnosis Model based on 5 Hub Genes for Chronic Thromboembolic Pulmonary Hypertension.Curr Med Chem. 2024;31(13):1754-1768. doi: 10.2174/0929867330666230605125512. Curr Med Chem. 2024. PMID: 37282570
-
Identification of immune-related mitochondrial metabolic disorder genes in septic shock using bioinformatics and machine learning.Hereditas. 2024 Nov 28;161(1):49. doi: 10.1186/s41065-024-00350-y. Hereditas. 2024. PMID: 39609718 Free PMC article.
-
[Exploration of key ferroptosis-related genes as therapeutic targets for sepsis based on bioinformatics and the depiction of their immune profiles characterization].Zhonghua Wei Zhong Bing Ji Jiu Yi Xue. 2024 Oct;36(10):1025-1032. doi: 10.3760/cma.j.cn121430-20240524-00457. Zhonghua Wei Zhong Bing Ji Jiu Yi Xue. 2024. PMID: 39586719 Chinese.
References
-
- Yandrapalli, S. et al. Chronic thromboembolic pulmonary hypertension: Epidemiology, diagnosis, and management. Cardiol. Rev.26(2), 62–72 (2018). - PubMed
-
- Mullin, C. J. & Klinger, J. R. Chronic thromboembolic pulmonary hypertension. Heart Fail. Clin.14(3), 339–351 (2018). - PubMed
-
- Taddei, M. L., Giannoni, E., Fiaschi, T. & Chiarugi, P. Anoikis: An emerging hallmark in health and diseases. J. Pathol.226(2), 380–393 (2012). - PubMed
MeSH terms
Substances
Grants and funding
LinkOut - more resources
Full Text Sources
Medical
Research Materials
Miscellaneous
