. 2024 Dec 28;14(1):30726.
doi: 10.1038/s41598-024-80510-2.

Emergence of multiple spontaneous coherent subnetworks from a single configuration of human connectome coupled oscillators model

Affiliations

Emergence of multiple spontaneous coherent subnetworks from a single configuration of human connectome coupled oscillators model

Felipe A Torres et al. Sci Rep. .

Abstract

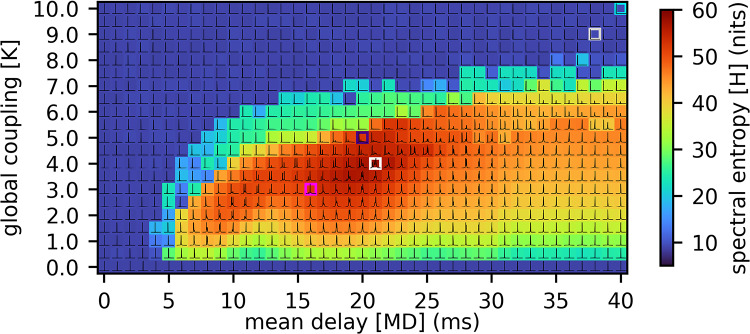
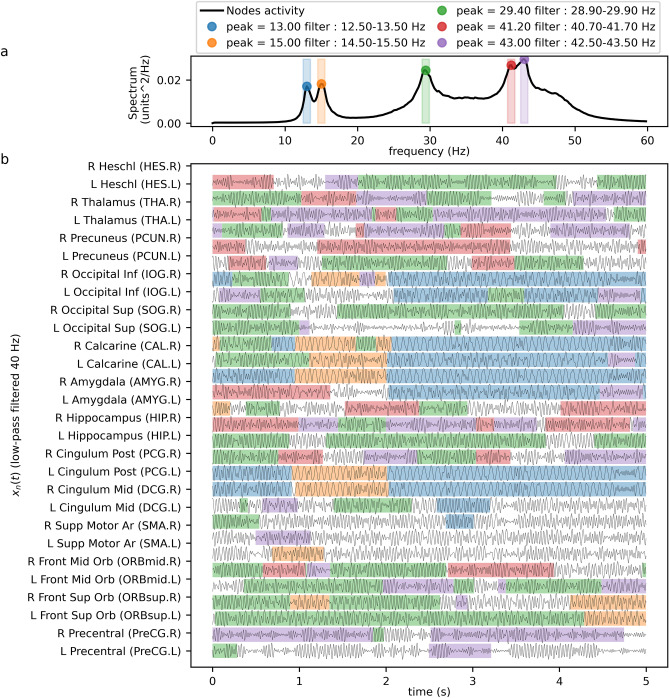
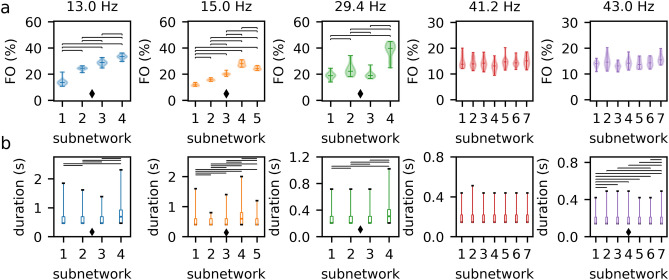
Multi-state metastability in neuroimaging signals reflects the brain's flexibility to transition between network configurations in response to changing environments or tasks. We modeled these dynamics with a Kuramoto network of 90 nodes oscillating at an intrinsic frequency of 40 Hz, interconnected using human brain structural connectivity strengths and delays. We simulated this model for 30 min to generate multi-state metastability. We identified global coupling and delay parameters that maximize spectral entropy, a proxy for multi-state metastability. At this operational point, multiple frequency-specific coherent sub-networks spontaneously emerge across oscillatory modes, persisting for periods between 140 and 4300 ms, reflecting flexible and sustained dynamic states. The topography of these sub-networks aligns with empirical resting-state neuroimaging data. Additionally, periodic components of the EEG spectra from young healthy participants correlate with maximal multi-state metastability, while dynamics away from this point correlate with sleep and anesthesia spectra. Our findings suggest that multi-state metastable functional dynamics observed in empirical data emerge from specific interactions of structural topography and connection delays, providing a platform to study mechanisms underlying flexible dynamics of cognition.


Conflict of interest statement

Declarations. Competing interests: The authors declare that they not have competing financial interests or personal relationships that could have appeared to influence this work.

Figures

Fig. 1
Fig. 1
Spectral entropy heatmap. Spectral entropy as a metric of metastability from the parameters space exploration of global coupling, K, and mean delay formula image. The white square marks the maximum value obtained for the spectral entropy at formula image and formula image ms. The dark-blue square marks the best correlation fit with resting-state EEG spectrum at formula image and formula image ms, and the magenta square marks the best fit from Cabral et al.  at formula image and formula image ms. The cyan square marks the best fit with anesthesia EEG at formula image and formula image ms. The grey square marks the best fit with slow-wave sleep EEG at formula image and formula image ms.
Fig. 2
Fig. 2
Model dynamics at the maximum metastability set of parameters. (a) The average spectrum of the ninety nodes with formula image and formula image ms. (b) Time-series of the nodes’ activity filtered below 50 Hz. The shaded regions highlight when the nodes’ envelopes pass a threshold = 0.232 for each frequency band. As the maximum possible envelope amplitude is 1, the selected threshold (for threshold selection details, see "Selection of envelopes threshold" section in Methods) indicates when at least 5.3% of the node’s instantaneous power is present at each narrow frequency band.
Fig. 3
Fig. 3
Functional emerging subnetworks. Functional subnetworks with the maximal fractional occupancy for each frequency peak (ae). The average spectral coherence FC matrix of each cluster is masked by the structural connectivity matrix, and only the highest 10% of the connections are shown. The color of the brain regions corresponds to the colors previously used for each frequency band. The color of the edges in the circular network plot indicates the imaginary part of the coherence (icoh). Supplementary Fig. S7 shows the real part of the coherence. Brain plots were generated using adapted code from the repository “PyBP” available at https://github.com/alexandershaw4/PyBP-Py-BrainPlotter-for-AAL90. The circular networks were generated using the Python library “MNE-connectivity 0.7.0” available at https://mne.tools/mne-connectivity/stable/index.html.
Fig. 4
Fig. 4
Subnetworks’ fractional occupancy and duration. (a) Fractional occupancy of the spectral coherence FC sub-networks. (b) Duration distributions of the coherent sub-networks. Each vertical panel corresponds to the previously defined frequency bands. A diamond below the distributions indicates multi-group statistical difference (Kruskal–Wallis H-test formula image0.05 in (a), formula image0.01 in (b), p-values are corrected for multiple comparisons). The horizontal lines above the distributions indicate a statistically significant difference between the indicated pairs (formula image0.01 Wilcoxon t-test).

Similar articles

References

    1. Cabral, J., Hugues, E., Sporns, O. & Deco, G. Role of local network oscillations in resting-state functional connectivity. NeuroImage57, 130–139. 10.1016/j.neuroimage.2011.04.010 (2011). - PubMed
    1. Breakspear, M. Dynamic models of large-scale brain activity. Nat. Neurosci.20, 340–352. 10.1038/nn.4497 (2017). - PubMed
    1. Menon, V. Large-scale brain networks and psychopathology: A unifying triple network model. Trends Cognit. Sci.15, 483–506. 10.1016/j.tics.2011.08.003 (2011). - PubMed
    1. Black, R. D. & Rogers, L. L. Sensory neuromodulation. Front. Syst. Neurosci.14, 1–20. 10.3389/fnsys.2020.00012 (2020). - PMC - PubMed
    1. Bullmore, E. & Sporns, O. Complex brain networks: Graph theoretical analysis of structural and functional systems. Nat. Rev. Neurosci.10, 186–198. 10.1038/nrn2575 (2009). - PubMed

LinkOut - more resources