. 2024 Dec 28;14(1):30779.
doi: 10.1038/s41598-024-80971-5.

SLAMF7 defines subsets of human effector CD8 T cells

Affiliations

SLAMF7 defines subsets of human effector CD8 T cells

Hassen Kared et al. Sci Rep. .

Abstract

Long-term control of viral replication relies on the efficient differentiation of memory T cells into effector T cells during secondary immune responses. Recent findings have identified T cell precursors for both memory and exhausted T cells, suggesting the existence of progenitor-like effector T cells. These cells can persist without antigenic challenge but expand and acquire effector functions upon recall immune responses. In this study, we demonstrate that the combination of SLAMF7 with either CD27 or TCF-1 effectively identifies progenitor-like effector CD8 T cells, while SLAMF7 with GPR56 or TOX defines effector CD8 T cells. These markers allow for the clear segregation of these distinct cell subsets. SLAMF7+ CD8T cells are dynamically modulated during viral infections, including HIV, HCV, CMV, and SARS-CoV-2, as well as during aging. We further characterize the SLAMF7 signature at both phenotypic and transcriptional levels. Notably, during aging, the SLAMF7 pathway becomes dysregulated, resulting in persistent phosphorylation of STAT1. Additionally, SLAMF7 ligation in the presence of IL-15 induces TCF-1 expression, which promotes the homeostatic proliferation of progenitor-like effector CD8 T cells.


Conflict of interest statement

Declarations. Competing interests: The authors declare no competing interests.

Figures
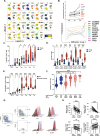
Fig. 1
Fig. 1
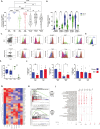
Heterogeneity of SLAMF7 expressing T cells. (A) Heterogeneity of T cells by high-dimensional single-cell flow cytometry staining. Frozen PBMCs were thawed and stained for flow cytometry. T cells of 20 donors (n = 10 each for young and older donors, all CMV seropositive) were concatenated. T cells were visualized by UMAP and a cold to hot heat map was used to represent the intensity of each marker. (B) Characterization of human CD8 T cell maturation. The mRNA fold change expression in comparison to naïve CD8 T cells was calculated in sorted populations of T Stem Cell Memory (TSCM), Central Memory (TCM), and Effector Memory (TEM), top. The mRNA coding for transcription factors is labelled in red and surface molecules in black. The cellular progression according to the diffusion map was visualized by the expression profile of CD45RO, SLAMF7, CX3CR1, KLRG1, GPR56, CD27, CD57, T-bet, RunX3, and HOBIT in CMV seropositive donors, bottom. (C) SLAMF7 expression in CD8 T cell subsets during aging. The frequency of SLAMF7 was evaluated in naïve (CD45RO-CCR7+CD27+CD95-), TSCM (CD45RO-CCR7+CD27+CD95+), TCM (CD45RO+CCR7+CD27+CD95+), TTM (CD45RO+CCR7-CD27+CD95+), TEM (CD45RO+CCR7-CD27-CD95+), and TTE (CD45RO-CCR7-CD27-CD95+) of frozen PBMCs from young and older donors (n = 10 and n = 11 respectively). The statistical analysis was performed on unpaired samples (U Mann–Whitney test) (** and **** for p < 0.01 and p < 0.0001, respectively). (D) Heterogeneity of SLAMF7 expressing T cells during aging. Staining was performed on frozen PBMCs of young (n = 10) and elderly donors (n = 10). The statistical analysis was performed on unpaired samples (U Mann–Whitney test; *, **, ***, and **** for p < 0.05, p < 0.01, p < 0.001, and p < 0.0001, respectively). (E) SLAMF7 expression in CD8 T cell subsets during untreated HIV infection. The median intensity of SLAMF7 expression was evaluated in subsets (as defined in Fig. 1C) of frozen PBMCs from PLWH and healthy donors (n = 15 and n = 12 respectively). The statistical analysis was performed on unpaired samples (U Mann–Whitney test) (** and **** for p < 0.01 and p < 0.0001, respectively). (F) SLAMF7 expression in CD8 T cell subsets during chronic viral infections and aging. The frequencies of SLAMF7 expression were evaluated in total CD8 T cells from frozen PBMCs of PLWH under anti-retroviral therapy and co-infected or not with CMV. Patients have been stratified by age (< 40, 40–65, > 65 years old as young, middle age, and old with n = 42, n = 43, and n = 11 respectively) and compared to healthy donors (n = 20). The statistical analysis was performed on unpaired samples (U Mann–Whitney test) (** and **** for p < 0.01 and p < 0.0001, respectively). (G) Identification of progenitor-like and terminal effector CD8 T cells based on SLAMF7 expression. Description of the gating strategy used to identify SLAMF7+-progenitor-like (CD27+GPR56-) and terminal effector (CD27-GPR56+) population in total CD8 T cells. The histograms represented the overlaid intensity of TCF-1, CD127, SLAMF6, and CD5 in SLAMF7 subsets in comparison to Naïve/ Central Memory (CD27+CCR7+) CD8 T cells. (H) Characterization of progenitor-like and terminal effector CD8 T cells. The median intensity of fluorescence was compared between progenitor-like and terminal effector CD8 T cell populations. The statistical analysis was performed on paired samples (n = 20, Wilcoxon signed-rank test), (** and **** for p < 0.01 and p < 0.0001, respectively).
Fig. 2
Fig. 2
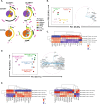
Multiomic signature of SLAMF7 expressing T cells. (A) Poly-functionality of SLAMF7+ T cells. Functional heterogeneity of T cells revealed by Flow Cytometry analysis after PMA/Ionomycin stimulation. Poly-functionality of T cells was analyzed by SPICE and compared SLAMF7+ with SLAMF7- CD4 (CD154+) and CD8 (CD154-) T cells. The pies represented the frequencies of T cells with a defined combination of effector molecules. The arcs above the pie indicate which cytokines or cytolytic molecules are expressed by each slice of the pie. (B) Effector signature of SLAMF7+ T cells during aging. Effector Memory (CD45RO+CD27-) T cells from young (n = 5) and older donors (n = 3) were sorted and stimulated overnight with PMA/Ionomycin. Supernatants were analyzed by Luminex and visualized by PCA. The contribution of individual cytokines to the main components was also indicated. (C) Effector signature of SLAMF7+ T cells during aging. Sorted SLAMF7+ T cell subsets were directly lysed ex-vivo. Gene expression was quantified by customized senescence Nanostring, normalized by Z-score calculation, and represented by a cold-to-hot heat map. (D) Transcriptional signature of SLAMF7+ T cells during aging. Top50 of differentially expressed genes between SLAMF7-expressing EM T cells was visualized by PCA. The contribution of individual genes to the main principal components was also indicated. (E) Exhaustion and transcription factors profile of SLAMF7+ T cells during aging. The SLAMF7-specific gene expression assessed as in (D), was represented by a cold to hot heat map for genes associated with activation/inhibitory molecules (left) and TF/signaling pathways (right).
Fig. 3
Fig. 3
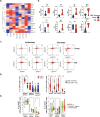
SLAMF7 expressions in virus-specific T cells during aging. (A) SLAMF7 expression in virus-specific CD8 T cells. The expression of SLAMF7 was compared between virus-specific CD8 T cells in HD during aging (n = 8 for young and n = 11 for elderly), in PLWH (n = 17, including 10 non-treated and 7 under HAART), after SARS-CoV-2 vaccination (n = 14, 5 months post dose 2) and after SARS-CoV-2 breakthrough infection (n = 37, 3 weeks post-infection). The statistical analysis was performed on unpaired samples (U Mann–Whitney test) (*, **, ***, **** for p < 0.05, p < 0.01, p < 0.001, and p < 0.0001 respectively). (B) Specific SLAMF7 signature in virus-specific CD8 T cells. CMV- and EBV-specific CD8 T cells were statistically analyzed on unpaired samples (U Mann–Whitney test) (** for p < 0.01). (C) TOX expression in CD8 T cells. A zebra plot according to TOX and PD-1 or pp65-specific tetramer expressions represented CD8 T cells from an old donor. Gates were defined according to PD-1 and TOX expression as PD-1-TOX- (grey), PD-1-TOX+ (green), PD-1dimTOX+ (blue), and PD-1+TOX+ (red). The respective expressions of surface and intracellular markers were overlaid on histograms. (D) Specific TOX expression in CMV-specific CD8 T cells. The representative expression of TOX in CMV- and EBV-specific CD8 T cells from the same donor was overlaid on the histogram and the frequencies of TOX expressing were represented. (E) Quantification of TOX expression in virus-specific CD8 T cells. (F) Transcription factors signature of CMV-specific CD8 T cells during aging. The frequencies of CMV-specific CD8 T cells expressing TOX with and without TCF-1/7, Eomes, and T-bet were evaluated and compared in young (n = 9) and older donors (n = 10) (Mann–Whitney test, with * and ** for p < 0.05 and p < 0.01 respectively). (G) Transcriptional signature of CMV-specific CD8 T cells during aging. Total and subsets of CMV-specific CD8 T cells were sorted from 10 young and 3 old healthy donors. The extracted transcripts were analyzed by RNA sequencing. The differentially expressed genes were clustered and visualized by a cold-to-hot heat map representing the gene expression intensity. Naïve and Terminal effector T cells were used as internal controls. (H) Non-exhaustion T cell signature of CMV-specific CD8 T cells. The enrichment of gene expression detected in CMV-specific CD8 T cells was calculated in comparison to the naïve T cell signature. Enrichment plot of the gene set reported by GSEA as most enriched among PD-1low gene sets (GO: 26,495). The profile shows the enrichment score (green curve) and positions of gene set members (black vertical bars) rank-ordered list of differential gene expression. (I) Transcriptional pathway analysis of virus-specific CD8 T cells during aging. Ingenuity pathway analysis of bulk RNASeq data from virus-specific CD8 T cells. The enrichment of a specific pathway is proportional to the bubble size and the significance is associated with the different shades of red (from p < 10–2 to p < 10–6).
Fig. 4
Fig. 4
SLAMF7 signaling during aging. (A) SLAM signaling pathway in CMV-specific CD8 T cells. RNA Sequencing was used to evaluate the mRNA expression of constituent molecules of this pathway. The scaled gene expression intensity was visualized by a cold-to-hot heat map. (B) Modulation of the SLAM signaling pathway in CMV-specific CD8 T cells during aging. The gene expression was quantified by bulk RNA Sequencing in total or CD27 subsets of CMV-specific CD8 T cells from young or older donors (n = 10 and n = 3 respectively) and expressed as transcript per Million. (C) STAT1/3 signaling pathway in CMV-specific CD8 T cells. Flow cytometry was used to evaluate the constitutive (unstimulated) and IFNγ/IL-6-induced phosphorylation of STAT1 and STAT3 in CMV-specific CD8 T cells (red) and total CD8 T cells (grey) from young and older donors. Dot plots from four representative patients are described. (D) Quantification of STAT1/3 phosphorylation in CMV-specific CD8 T cells. The combination of phosphoSTAT1 (pSTAT1) and pSTAT3 was compared between total and CMV-specific CD8 T cells, left. The co-expression of pSTAT1 with phenotypic markers such as SLAMF7, CD27, GPR56, and CD126 was evaluated for total and CMV-specific CD8 T cells, right. The statistical analysis was performed on paired samples (n = 16, Wilcoxon signed-rank test), (*, **, and **** for p < 0.05, p < 0.01, and p < 0.0001, respectively). (E) SLAMF7 and STAT1 signaling in CMV-specific CD8 T cells. The pSTAT1 and pSTAT3 were evaluated after SLAMF7 ligation in CMV-specific CD8 T cells. The co-expression of pSTAT1 and pSTAT3 or pSTAT1 with phenotypic markers were analyzed as in (D).
Fig. 5
Fig. 5
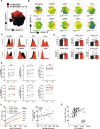
Homeostatic regulation of SLAMF7+ CD8 T cells. (A) Distribution of IL-15/ TCR stimulated CD8 T cells. Total CD8 T cells from stimulated PBMCs (n = 12) were concatenated and visualized by UMAP. The phenotype was measured after 4 days of stimulation in the presence of anti-CD3 microbeads with and without IL-15 (10 ng/mL). TCR-stimulated and TCR/IL-15-stimulated CD8 T cells were overlaid on the UMAP representation in black and red respectively. (B) Phenotype of IL-15/ TCR stimulated CD8 T cells. UMAP visualized the phenotype of activated CD8 T cells as in (A). Clusters were automatically determined by phenograph. A cold-to-hot heatmap represented the scaled intensity of each marker. (C) SLAMF7-associated phenotype of IL-15/ TCR stimulated CD8 T cells. The fluorescence intensity expression of each marker was overlaid for both conditions. (D) Acquisition of SLAMF7 and inhibitory receptors in response to IL-15/ TCR stimulation. The frequency of total and SLAMF7 expressing CD8 T cells was measured after 4 days of in vitro stimulation. The statistical analysis was performed on paired samples (Wilcoxon signed-rank test) (n = 12 and *, **, *** for p < 0.05, p < 0.01 and p < 0.001 respectively). (E) SLAMF7 signaling and T cell proliferation. The proliferation was measured by the dilution of Cell Trace Violet (CTV) after 4 days of IL-15/ TCR stimulation with and without SLAMF7 ligation. The expression of CD27, TCF-1, and TOX were quantified on proliferating T cells, defined as CTVlow. The statistical analysis was performed on paired samples (Wilcoxon signed-rank test) (n = 8 and *, ** for p < 0.05, and p < 0.01 respectively). (F) Accumulation of SLAMF7+ CD8 T cells during aging. The correlations between the frequencies of CD8 T cell populations and the chronological age were evaluated by the Spearman test, left. The IMM Age was calculated according to the expression of 57 pre-determined genes detected by RNA-Seq and correlated to the frequencies of SLAMF7 expressing CD8 T cells in the ATTRACT cohort (n = 27, r = 0.42 and p < 0.05). (G) Accumulation of SLAMF7+ CD8 T cells during inflammation. The quantification of sCD14 was performed by Elisa to measure the systemic inflammation in the plasma of PLWH. The correlation between the frequency of SLAMF7+CD8 T cells and the concentration of sCD14 was evaluated by a Spearman test.

Similar articles

Cited by

References

    1. Brenchley, J. M. et al. Expression of CD57 defines replicative senescence and antigen-induced apoptotic death of CD8+ T cells. Blood101(7), 2711–2720 (2003). - PubMed
    1. Kared, H., Martelli, S., Ng, T. P., Pender, S. L. & Larbi, A. CD57 in human natural killer cells and T-lymphocytes. Cancer Immunol. Immunother.65(4), 441–452 (2016). - PMC - PubMed
    1. Ouyang, Q. et al. Age-associated accumulation of CMV-specific CD8+ T cells expressing the inhibitory killer cell lectin-like receptor G1 (KLRG1). Exp. Gerontol.38(8), 911–920 (2003). - PubMed
    1. Voehringer, D. et al. Viral infections induce abundant numbers of senescent CD8 T cells. J. Immunol.167(9), 4838–4843 (2001). - PubMed
    1. Henson, S. M., Macaulay, R., Riddell, N. E., Nunn, C. J. & Akbar, A. N. Blockade of PD-1 or p38 MAP kinase signaling enhances senescent human CD8(+) T-cell proliferation by distinct pathways. Eur. J. Immunol.45(5), 1441–1451 (2015). - PubMed

MeSH terms

Substances

LinkOut - more resources