. 2024 Dec 28;14(1):30836.
doi: 10.1038/s41598-024-81665-8.

Appnome analysis reveals small or no associations between social media app-specific usage and adolescent well-being

Affiliations

Appnome analysis reveals small or no associations between social media app-specific usage and adolescent well-being

Yuning Liu et al. Sci Rep. .

Abstract

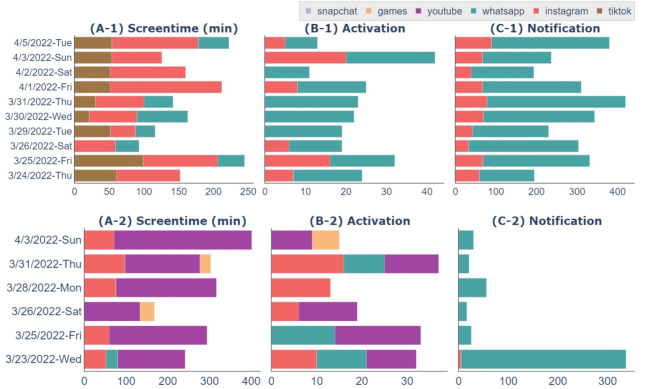
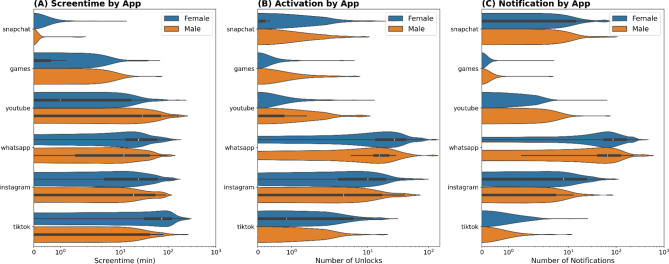
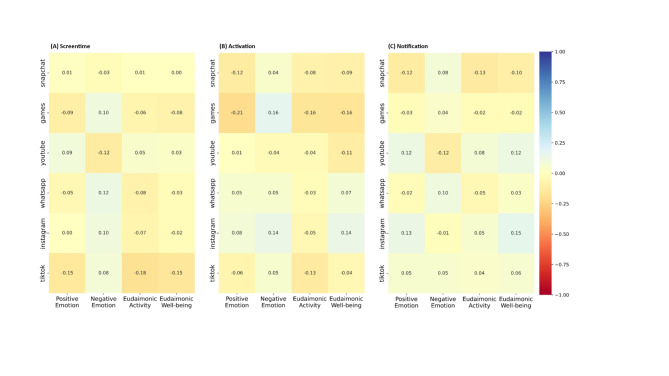
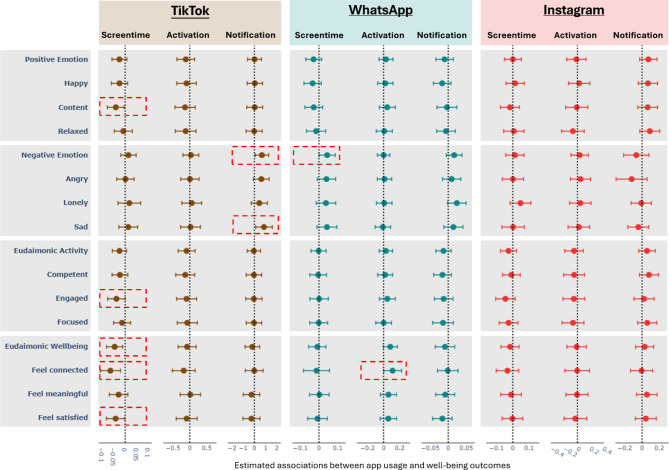
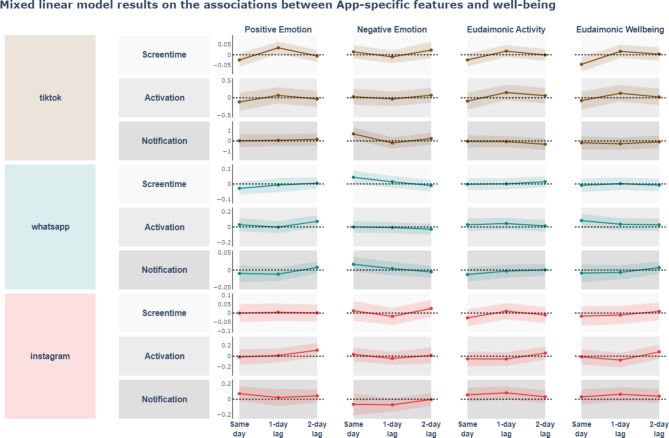
The debate on how social media use (SMU) influences adolescent well-being is mostly based on self-reports of SMU. By collecting data and screenshots donated from 374 Swiss adolescents (Meanage = 15.71; SDage = 0.82) over 2 weeks, we created "Appnomes"-app-specific usage metrics on screentime, number of activations, and number of notifications per participant per day derived, and associated them with daily hedonic and eudaimonic well-being. Longer TikTok time predicted lower eudaimonic well-being (β = - 0.08) daily but higher positive emotions (β = 0.06) the next day; longer use of WhatsApp predicted negative emotions (β = 0.06) while more screen activations for WhatsApp predicted greater feelings of connection (β = 0.08). Instagram notification was positively related to increased feeling of focused (β = 0.06) the next day. YouTube screen unlocks predicted more feeling of meaning (β = 0.07) the next day. More Snapchat screentime predicted less relaxed, less competent, and less positive emotions (with - 0.07 < β < - 0.06). Results pointed towards minimal or no effects, challenging the moral panic on the detrimental impact of SMU on teen well-being.

Keywords: Adolescents; Longitudinal; Screenshot; Social media use; Temporality; Well-being.


Conflict of interest statement

Declarations. Competing interests: The authors declare no competing interests.

Figures

Fig. 1
Fig. 1
An example of Appnome on the screentime (A), number of activations (B), and number of notifications (C), of one female (1) and one male (2) study participant. The figure shows the App-use features of one female adolescent and one male adolescent in the study. Study participants uploaded daily screenshots from their cellphone settings, detailing App-specific screen time, unlocks, and notifications throughout the study period. Image processing and OCR techniques were employed to extract text from these screenshots. As shown in (A-1), the female adolescent spent most of the screen time on TikTok and Instagram in almost the entire study period. As shown in (B-1), most of the screen unlocks comes from activating WhatsApp. As shown in (C-1), the adolescent received more than 150 notifications from WhatsApp daily and less than 100 notifications from Instagram daily in the study period. The male adolescent has a different app-use feature compared to the female participant. As shown in (A-2), the male adolescent spent more than 1000 min using YouTube in the observed days. The adolescent also spent some time on Instagram and Game Apps. As shown in (B-2), most of the screen unlocks comes from activating Instagram, WhatsApp, and YouTube. As shown in (C-2), the adolescent received notifications mainly from WhatsApp in the study period.
Fig. 2
Fig. 2
The distribution of person-level average screentime (A), number of activations (B), and number of notifications (C) by gender in the << blinded for review>> study. The figure presents the distribution of the person-level average App-use features. Study participants uploaded daily screenshots from their cellphone settings, detailing app-specific screen time, unlocks, and notifications throughout the study period. OCR techniques were employed to extract text from these screenshots. Utilizing the extracted text, we calculated the average app-use features for each participant and depicted the distribution of these averages among the study participants in a violin plot.
Fig. 3
Fig. 3
Correlation between average screentime (A), number of activations (B), and number of notifications (C) of selected Apps and average hedonic and eudaimonic well-being in the between-person level, in the << blinded for review>> study. The figure presents the partial correlation of the between-person level well-being outcomes (Y) and App-use features (X) adjusting for age and gender. For instance, the average score of positive emotion (y1) and screentime on Snapchat (x1) are calculated for each person. The partial correlation coefficient between y1 and x1 is then estimated among the study participants. Bonferroni correction is conducted to correct for multiple testing (adjusted P value threshold = 0.05/#=0.0083, where #=6). None of the correlation coefficients are significant statistically after the correction.
Fig. 4
Fig. 4
Forest plot of the mixed linear models results on the associations between TikTok, WhatsApp, and Instagram screentime, number of activations, and number of notifications and hedonic/eudaimonic well-being. Figure shows the unstandardized coefficients and confidence interval between well-being outcomes (Y) and App-specific features (X) of the same day from mixed linear models, adjusting for well-being outcome of the previous day, age, gender, and school in each model, with time (each day) as level one, and adolescents as level two. Well-being outcomes are collected from self-reported questionnaires, and App-specific features are derived using text extraction pipeline from the cellphone screenshots of the setting pages uploaded by users, both within the same EMA study. For example, happy (y1)—screentime of Instagram (x1) is one pair of well-being outcomes—App-use feature predictors. We have 288 pairs of such outcomes (12 individual outcomes and 4 aggregated outcomes) and predictors (3 features per App for 6 Apps). Figure shows the results for TikTok, WhatsApp, and Instagram. The results for Game Apps, YouTube, and Snapchat are presented in S-Fig. 4. For each pair of well-being outcomes—App-use feature predictors, we fit a random intercept model and random slope model. We apply the likelihood ratio test to select the best model following the parsimonious rule. Bonferroni correction is applied to the confidence interval to account for multiple testing. For each well-being outcome and App-use feature, we adjust the level of significance by 0.05/# of tests (# = 6) and the confidence interval based on the adjusted level of significance. The confidence interval is adjusted by formula image, where # = 6. The interactive Plotly version of this plot is available in OSF project in path “/code_and_data_for_replication /within_level”.
Fig. 5
Fig. 5
Associations of TikTok, WhatsApp, and Instagram usage with hedonic and eudaimonic well-being outcomes on the same day, the following day (1-day lag), and two days later (2-day lag), results from mixed linear models. Figure shows the unstandardized coefficients and confidence interval between well-being outcomes (Y) and App-specific features (X) of the same day, the following day (1-day lag), and two days later (2-day lag) from mixed linear models, adjusting for well-being outcome of the previous day, age, gender, and school in each model, with time (each day) as level one, and adolescents as level two. Well-being outcomes are collected from self-reported questionnaires, and App-specific features are derived using text extraction pipeline from the cellphone screenshots of the setting pages uploaded by users, both within the same EMA study. Figure shows the results for TikTok, WhatsApp, and Instagram. The results for Game Apps, YouTube, and Snapchat are presented in S-Fig. 5. For each pair of well-being outcomes – App-use feature predictors, we fit a random intercept model and random slope model. We apply the likelihood ratio test to select the best model following the parsimonious rule. Bonferroni correction is applied to the confidence interval to account for multiple testing. For each well-being outcome and App-use feature, we adjust the level of significance by 0.05/# of tests (# = 6) and the confidence interval based on the adjusted level of significance. The confidence interval is adjusted by formula image, where # = 6. The interactive Plotly version of this plot is available in OSF project in path “/code_and_data_for_replication /within_level”.

Similar articles

References

    1. Massarat, E. A. V., Risa Gelles Watnick and Navid, Teens & Social Media and Technology. Pew Research Center: Internet, Science & Tech. August 10, 2022. Accessed March 23, 2024. https://www.pewresearch.org/internet/2022/08/10/teens-social-media-and-t... (2022).
    1. Külling, C. et al. JAMES: Jugend, Aktivitäten, Medien – Erhebung Schweiz. Published online 2022. 10.21256/zhaw-26216.
    1. Handa, S., Pereira, A. & Holmqvist, G. The Rapid decline of happiness: exploring life satisfaction among Young people across the World. Appl. Res. Qual. Life. 18(3), 1549–1579. 10.1007/s11482-023-10153-4 (2023).
    1. CDC. Youth Risk Behavior Surveillance Data Summary & Trends Report: 2011–2021. Published online 2021. https://www.cdc.gov/healthyyouth/data/yrbs/pdf/YRBS_Data-Summary-Trends_....
    1. UNICEF. Youth Mental Health, Study on the situation in Switzerland and Liechtenstein. Accessed May 20, 2024. https://www.unicef.ch/en/our-work/switzerland-liechtenstein/mental-health (2022).

LinkOut - more resources