

Direct detection of 4-dimensions of SARS-CoV-2: infection (vRNA), infectivity (antigen), binding antibody, and functional neutralizing antibody in saliva
- PMID: 39730575
- PMCID: PMC11681011
- DOI: 10.1038/s41598-024-81019-4
Direct detection of 4-dimensions of SARS-CoV-2: infection (vRNA), infectivity (antigen), binding antibody, and functional neutralizing antibody in saliva
Abstract
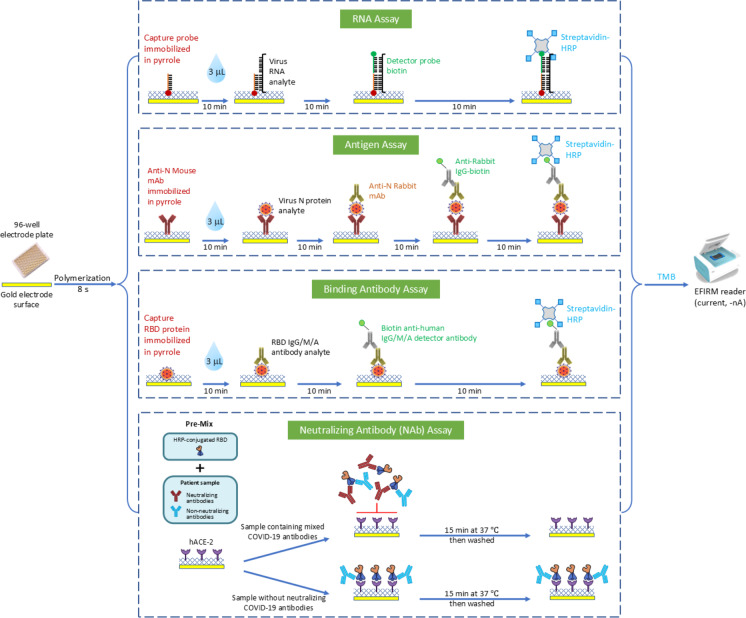
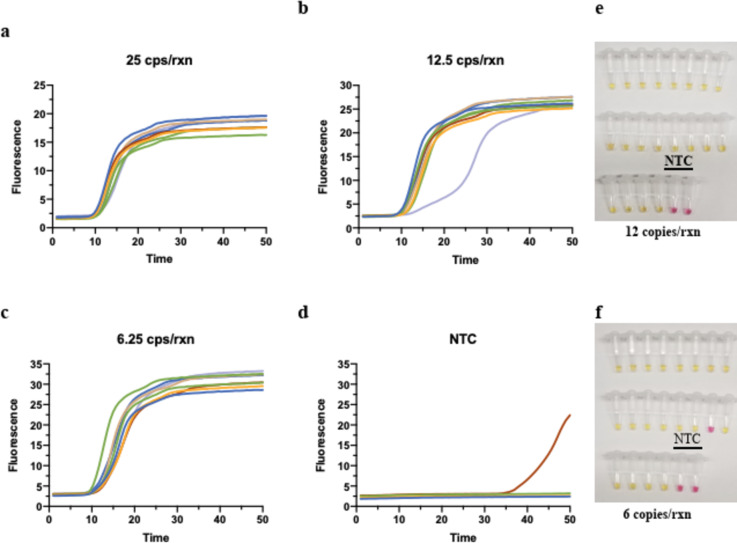
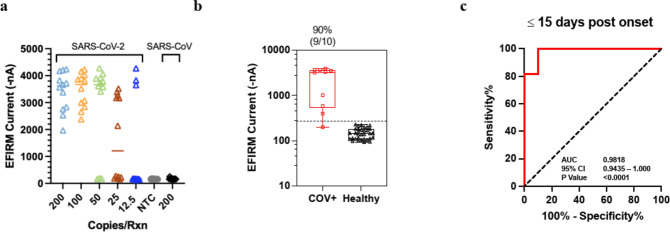
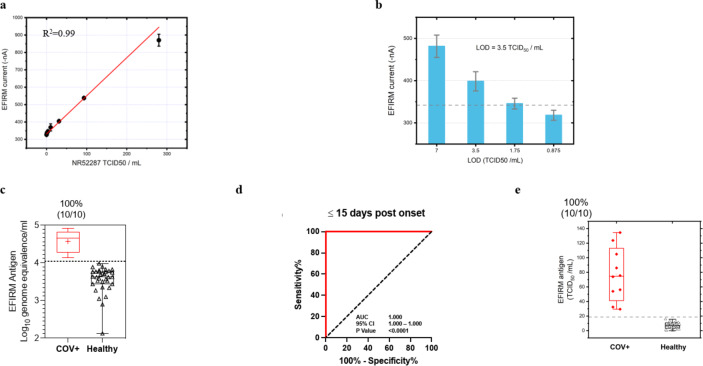
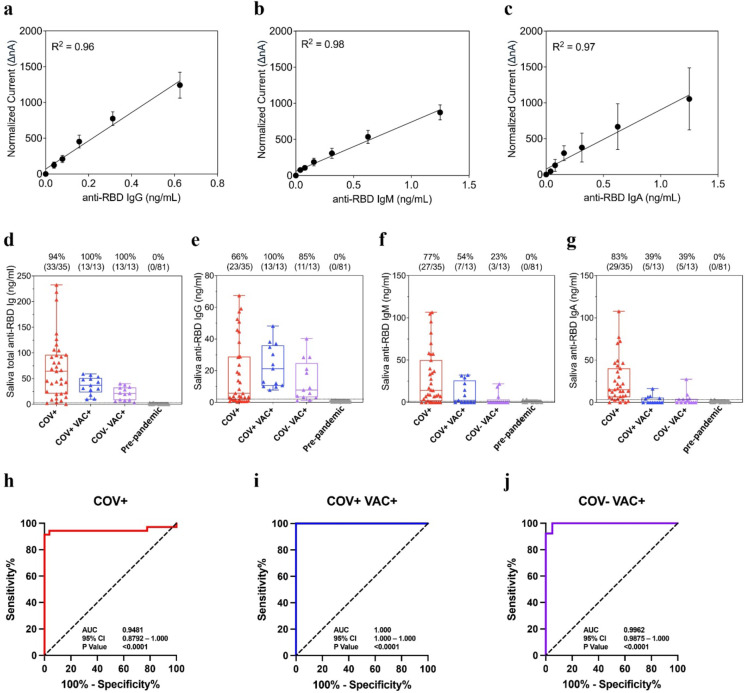
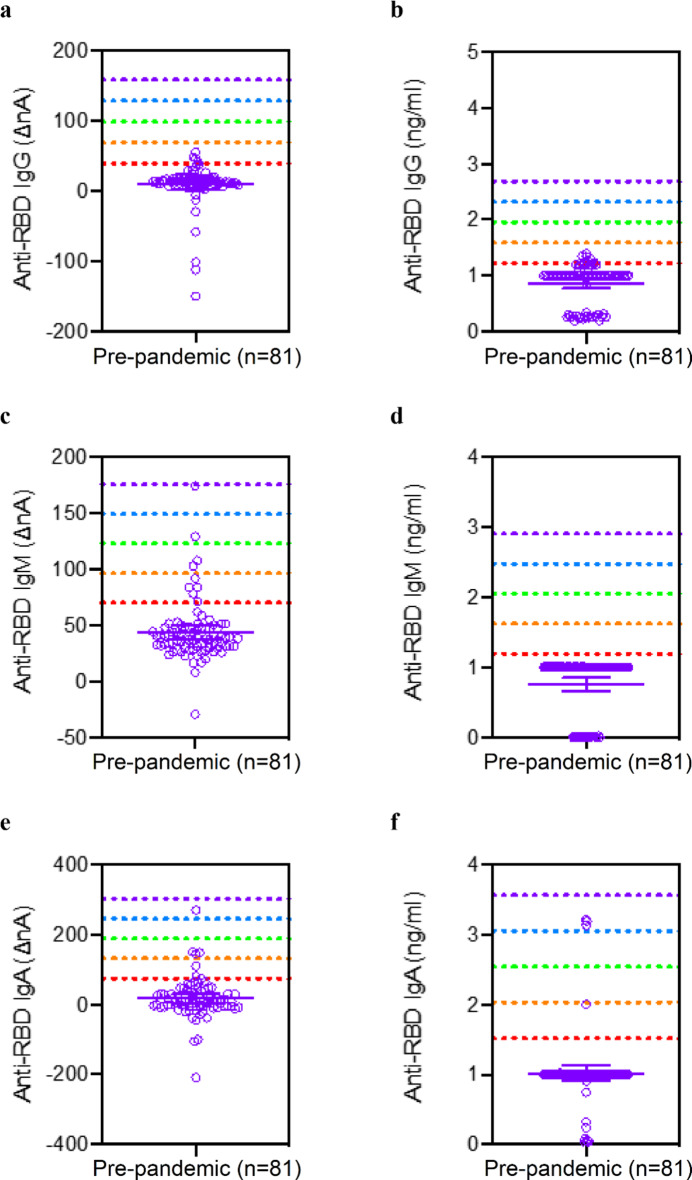
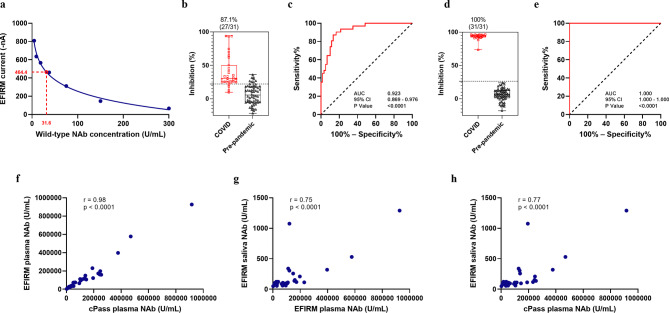
We developed a 4-parameter clinical assay using Electric Field Induced Release and Measurement (EFIRM) technology to simultaneously assess SARS-CoV-2 RNA (vRNA), nucleocapsid antigen, host binding (BAb) and neutralizing antibody (NAb) levels from a drop of saliva with performance that equals or surpasses current EUA-approved tests. The vRNA and antigen assays achieved lower limit of detection (LOD) of 100 copies/reaction and 3.5 TCID₅₀/mL, respectively. The vRNA assay differentiated between acutely infected (n = 10) and infection-naïve patients (n = 33) with an AUC of 0.9818, sensitivity of 90%, and specificity of 100%. The antigen assay similarly differentiated these patient populations with an AUC of 1.000. The BAb assay detected BAbs with an LOD of 39 pg/mL and distinguished acutely infected (n = 35), vaccinated with prior infection (n = 13), and vaccinated infection-naïve patients (n = 13) from pre-pandemic (n = 81) with AUC of 0.9481, 1.000, and 0.9962, respectively. The NAb assay detected NAbs with a LOD of 31.6 Unit/mL and differentiated between COVID-19 recovered or vaccinated patients (n = 31) and pre-pandemic controls (n = 60) with an AUC 0.923, sensitivity of 87.10%, and specificity of 86.67%. Our combo assay represents a significant technological advancement to simultaneously address SARS-CoV-2 infection and immunity, and it lays the foundation for tackling potential future pandemics.
© 2024. The Author(s).
Conflict of interest statement
Declarations. Competing interests: O.Y. is the scientific advisory board for CytoDyn (stock options and cash) and board of directors for Applied Medical (stock and cash). D.W. is a consultant for AIONCO/Avellino and has stock options in AIONCO/Avellino. Other authors declared no conflict of interests.
Figures
Update of
-
Direct Detection of 4-Dimensions of SARS-CoV-2: Infection (vRNA), Infectivity (Antigen), Binding Antibody, and Functional Neutralizing Antibody in Saliva.Res Sq [Preprint]. 2023 Dec 28:rs.3.rs-3745787. doi: 10.21203/rs.3.rs-3745787/v1. Res Sq. 2023. Update in: Sci Rep. 2024 Dec 28;14(1):30792. doi: 10.1038/s41598-024-81019-4. PMID: 38234820 Free PMC article. Updated. Preprint.
Similar articles
-
Direct Detection of 4-Dimensions of SARS-CoV-2: Infection (vRNA), Infectivity (Antigen), Binding Antibody, and Functional Neutralizing Antibody in Saliva.Res Sq [Preprint]. 2023 Dec 28:rs.3.rs-3745787. doi: 10.21203/rs.3.rs-3745787/v1. Res Sq. 2023. Update in: Sci Rep. 2024 Dec 28;14(1):30792. doi: 10.1038/s41598-024-81019-4. PMID: 38234820 Free PMC article. Updated. Preprint.
-
Anti-SARS-CoV-2 serology based on ancestral RBD antigens does not correlate with the presence of neutralizing antibodies against Omicron variants.Microbiol Spectr. 2025 Jan 7;13(1):e0156824. doi: 10.1128/spectrum.01568-24. Epub 2024 Nov 20. Microbiol Spectr. 2025. PMID: 39565133 Free PMC article.
-
Detection of Antibody Responses Against SARS-CoV-2 in Plasma and Saliva From Vaccinated and Infected Individuals.Front Immunol. 2021 Dec 20;12:759688. doi: 10.3389/fimmu.2021.759688. eCollection 2021. Front Immunol. 2021. PMID: 34987505 Free PMC article.
-
Saliva-Based ELISAs for Effective SARS-CoV-2 Antibody Monitoring in Vaccinated Individuals.Front Immunol. 2021 Sep 3;12:701411. doi: 10.3389/fimmu.2021.701411. eCollection 2021. Front Immunol. 2021. PMID: 34539632 Free PMC article. Review.
-
Rapid lateral flow tests for the detection of SARS-CoV-2 neutralizing antibodies.Expert Rev Mol Diagn. 2021 Apr;21(4):363-370. doi: 10.1080/14737159.2021.1913123. Epub 2021 Apr 12. Expert Rev Mol Diagn. 2021. PMID: 33840347 Free PMC article. Review.
References
MeSH terms
Substances
Grants and funding
LinkOut - more resources
Full Text Sources
Medical
Miscellaneous
