. 2024 Dec 28;14(1):30880.
doi: 10.1038/s41598-024-81869-y.

Interruption of the visual cycle in a novel animal model induces progressive vision loss resembling Stargardts Disease

Affiliations

Interruption of the visual cycle in a novel animal model induces progressive vision loss resembling Stargardts Disease

Fabiana Sassone et al. Sci Rep. .

Abstract

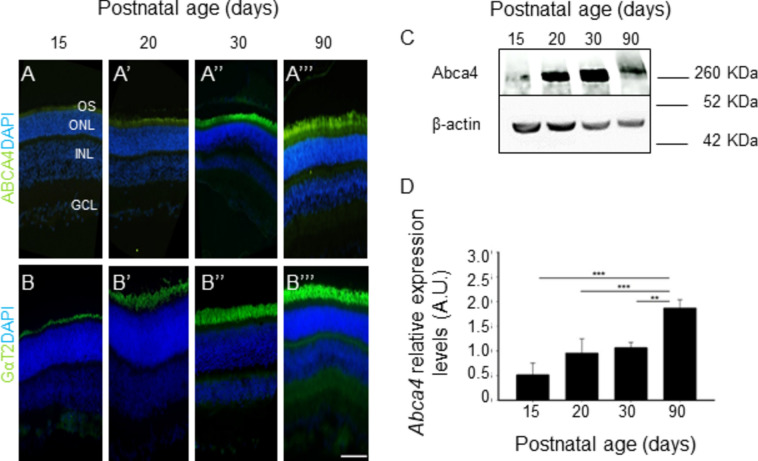
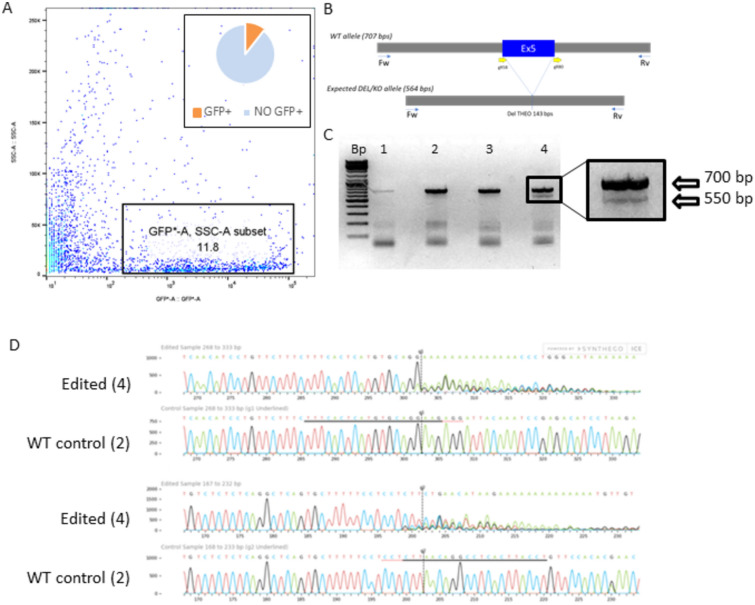
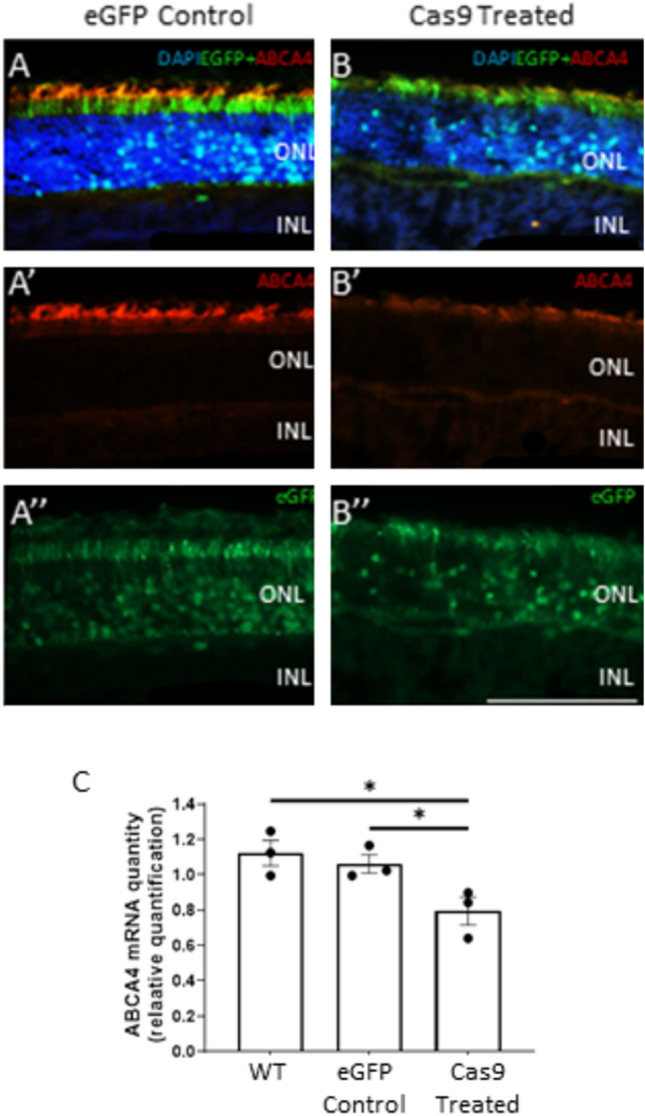
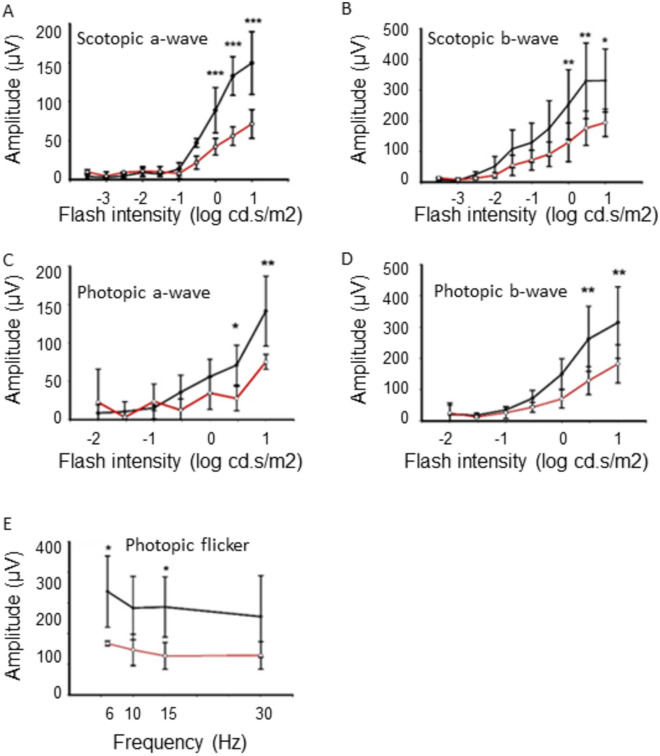
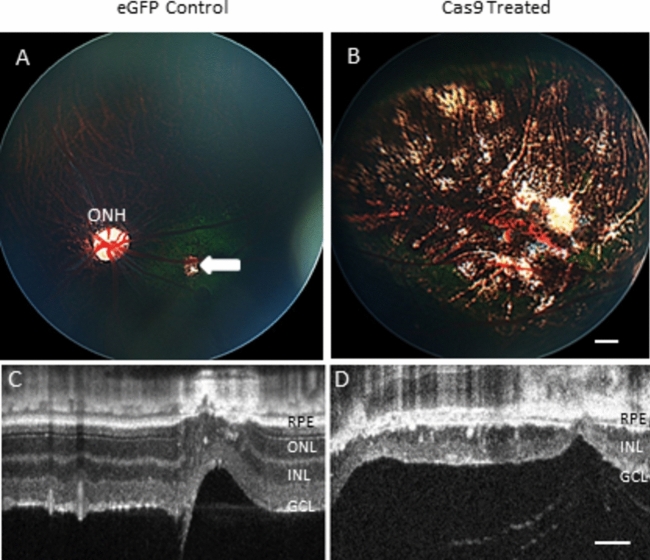
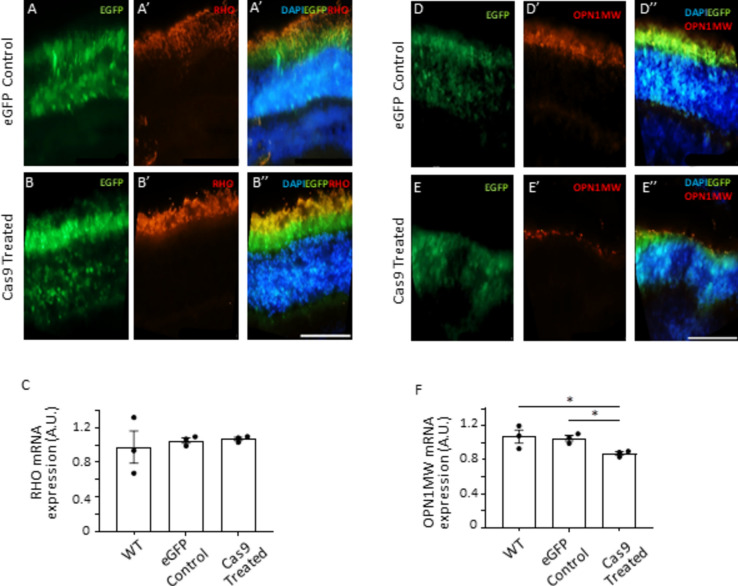
Mutations in the gene ABCA4 coding for photoreceptor-specific ATP-binding cassette subfamily A member 4, are responsible for Stargardts Disease type 1 (STGD1), the most common form of inherited macular degeneration. STGD1 typically declares early in life and leads to severe visual handicap. Abca4 gene-deletion mouse models of STGD1 accumulate lipofuscin, a hallmark of the disease, but unlike the human disease show no or only moderate structural changes and no functional decline. The human macula is highly enriched in cones, and reasoning that the low cone percentage in mice retinas (< 3%) might compromise faithful modelling of human maculopathies, we performed sub-retinal injections of CRISPR/Cas9-abca4 Adeno-Associated Virus constructs into young Sand Rats (Psammomys obesus), a diurnal rodent containing > 30% cones. Compared to control injections of AAV-abca4-GFP, treated eyes exhibited extensive retinal degeneration by two months. Sanger sequencing of the CRISPR targeted sequence show a clear edition of Abca4 gene. Non-invasive fundus imaging showed widespread photoreceptor loss, confirmed by ocular coherence tomography. Functional recording by single flash and flicker electroretinography showed significant decline in photopic (cone) light responses. Post-mortem real-time PCR, immunohistochemistry and western blotting showed significant decrease of cone-specific (MW cone opsin) but not rod-specific (rhodopsin) markers. Transmission electron microscopy showed large numbers of lipid inclusions in treated but not control retinal pigmented epithelium. Finally, ultra-high performance liquid chromatography analysis of whole P. obesus eyes showed the presence of all-trans retinal-dimer, not detected in rod-rich rat eyes. In conclusion, Abca4 knockout in P. obesus results in a predominantly cone degeneration phenotype, more accurately reflecting the etiology of human STGD1, and should be valuable for characterizing pathogenic pathways and exploring treatment options.

Keywords: Animal model; Cone photoreceptors; Electrophysiology; Gene editing; Retinal degeneration; Stargardt’s disease.


Conflict of interest statement

Declarations. Competing interests: The authors declare no competing interests.

Figures

Fig. 1
Fig. 1
Abca4 expression in Psammomys obesus retinal development. (A,B) Immunostaining of Abca4 (A-A′′′, green) and cone transducin (GαT2) (B-B′′′, green) in retinal tissues collected from Psammomys obesus aged postnatal day P15, P20, P30 and P90. At all ages, whereas GαT2 labelling is already strong in the outer segments (OS), Abca4 is only faintly visible at P15 and 20, becoming more intense by P30. Other abbreviations: DAPI, 4′,6-diamidino-2-phenylindole; GCL ganglion cell layer; INL inner nuclear layer; ONL outer nuclear layer. Scale bar in B’’’ = 40 µm for all panels. (C) Western blotting of Abca4 in P15-90 P. obesus retina. Compared to the housekeeping gene β-actin, Abca4 immunoreactivity increased with postnatal age. (D) Quantification of Abca4 immunoreactivity in P15-90 P. obesus. Densitometric scanning of Abca4 immunostained bands, normalized to β-actin, showed significant increases in expression levels with increasing age, n = 3 independent experiments. One-way ANOVA: *p < 0.05, **p < 0.01, ***p < 0.001 in all figures.
Fig. 2
Fig. 2
Rod- and cone-specific transfection by AAV2/8. (A) Representative retinal whole-mounts (top panel, insert shown as white box at higher magnification in (A′) and sections (A′′) of an injected animal 7 days post-injection. EGFP expression (green) indicates transcription by the rAAV-sgRNA vector in the PR layer. IS inner segments, ONL outer nuclear layer. Scale bars = 100 µm for panels A and A′, 40 µm for panel A′′. (B) Timeline for the Abca4 knockdown experiments. Psammomys obesus received subretinal co-delivery of 1.4 × 110 vector genomes (vg) AAV-Cas9 and 1.4 × 110 vg AAV-sgRNAAbca4-eGFP per eye at P14-P17. Same doses of AAV-sgRNAAbca4-eGFP were injected in fellow eyes as controls. (C) Schematic representation of the AAV vectors delivering SpCas9 and sgRNAs. Abca4 locus showing the location of the sgRNA targets (gR58, gR80). The targeted genomic site is Exon 5 in black. Protospacer adjacent motif (PAM) sequence is marked in red.
Fig. 3
Fig. 3
Abca4 knockdown in Psammomys obesus photoreceptors by AAV-CRISPR-Cas9. (A) Representative FACS plots of dissociated cells from retinas receiving AAV-sgRNAAbac4-eGFP/Cas9 vectors. EGFP-positive population represents 11.8% of total retinal cells. (B) scheme of the PCR performed with position of the guide RNAs and primers; (C) Electrophoresis of Abca4 genomic DNA following PCR amplification (~ 700 bp around exon 5): Bp, base pair ladder; 1, negative control (water only), no amplification; 2, positive control, P. obesus whole retina, expected band ~ 700 bp; 3, P. obesus retina transfected with rAAV-sgRNAAbca4-eGFP only, FACS-sorted cells show single band ~ 700 bp; 4, P. obesus retina transfected with AAV-sgRNAAbca4-eGFP/Cas9, FACS-sorted cells show two amplicons, one with edited Abca4 (~ 550 bp) (lower arrow beside inset) and the other with wild type Abca4 (~ 700 bp) (upper arrow beside inset). (D) Sanger sequencing chromatograms from forward primer (top panel) and reverse primer (bottom panel). In each condition there is flattening of peaks and loss of correlation with DNA sequence in FACS-sorted cells starting from nucleotide ~ 200–300 up to nucleotide ~ 300–400, ie. the exon 5 region targetted by sgRNAAbca4-eGFP/Cas9, compared to FACS-sorted control cells with a normal chromatogram profile, shown in the lower traces of each panel.
Fig. 4
Fig. 4
Abca4 knockdown in Psammomys obesus photoreceptors. (A,B) Immunostaining of Abca4 in retinal tissues collected from Psammomys obesus retina, AAV-sgRNAAbca4-eGFP (“eGFP Control”, left) (D-D′′′) and AAV-sgRNAAbca4-eGFP/Cas9 (“Cas9 treated”, right), 8 weeks post-injection. (A,B) merged images of DAPI staining, abca4 immunostaining and eGFP. (A′, B′) Substantial reduction of Abca4 immunostaining was observed in the Cas9-treated retina compared to eGFP alone. (A′′, B′′) eGFP signal in transduced PR. Scale bar in (A′′) = 80 µm for all panels. NL inner nuclear layer, ONL outer nuclear layer. (C) Quantitative real-time RT–PCR analysis of Abca4 mRNA expression in Psammomys obesus retinas 8 weeks post-injection: unoperated (WT) (n = 3), AAV-sgRNAAbca4-eGFP (eGFP control) (n = 4), and AAV-sgRNAAbca4-eGFP/Cas9 (Cas9-treated) (n = 3) retinas. The mRNA expression values were determined after normalization to internal control GAPDH and RPLP0 mRNA levels. Cas9-treated vs. eGFP-control, p = 0.024; Cas9-treated vs. WT, p = 0.011, one-way ANOVA. Data represented as mean ± SEM. *p < 0.05.
Fig. 5
Fig. 5
Functional changes in Psammomys obesus retina following Abca4 knockdown. (AD) Mean full-field Ganzfeld ERG amplitudes were recorded across a range of light flash intensities under scotopic or photopic conditions. Values from sgRNAAbca4-eGFP/Cas9-treated eyes (red trace) were compared to sgRNAAbca4-eGFP alone (control eyes, black trace). Statistically significant lower amplitudes of scotopic a- and b-wave respectively (A,B) (n = 6), and photopic a- and b- wave respectively (C,D) (n = 3) were observed in Cas9-treated compared to GFP-alone control eyes. There were significant differences at light flash intensities of ~ 0.5–1 log.cd .s/m2 for scotopic conditions, intensities at which a mixed rod-cone response is present. Significant differences between Cas9-treated and eGFP-control eyes in photopic conditions were seen for light flash intensities 0.5–1 log.cd .s/m2. Data represented as mean ± SEM. *p < 0.05; **p < 0.01; ***p < 0.001. Significance values between sgRNAAbca4-eGFP/Cas9-treated and control sgRNAAbca4-eGFP eyes were calculated using two-way ANOVA. (E) Photopic light-adapted flicker recordings were made from 6 to 30 Hz, and also showed reduced signals in sgRNAAbca4-eGFP/Cas9-treated eyes (red trace) compared to sgRNAAbca4-eGFP controls (black trace). Statistical analysis performed as for single flash experiments.
Fig. 6
Fig. 6
Fundus changes in Psammomys obesus retina following Abca4 knockdown. Fundus imaging of sgRNAAbca4-eGFP-injected (eGFP control) and sgRNAAbca4-eGFP/Cas9-injected (Cas9 treated) eyes at 8 weeks post-injection. (A) Control eyes showed a small lesion corresponding to the injection site (white arrow), but otherwise showed a smooth uniform bluish retina with blood vessels emanating from the optic nerve head (ONH); (B) Fundus imaging of sgRNAAbca4-eGFP/Cas9-treated eyes showed extensive loss of retina with alternating pigmented and depigmented patches, and blood vessels visible across the retinal surface; (C) optical coherence tomography (OCT) imaging of control retinas showing normal laminated retinal structure, with a brightly reflective retinal pigmented epithelium (RPE) and darker cell layers (ONL outer nuclear layer, INL inner nuclear layer, GCL ganglion cell layer) separated by plexiform layers; (D) OCT imaging of sgRNAAbca4-eGFP/Cas9-treated eyes showed complete disappearance of the ONL within the central lesion, while vestigial inner retina was still present. Scale bar in panel B = 500 µm for (A,B); scale bar in panel D = 100 µm for (C,D).
Fig. 7
Fig. 7
Immunohistochemical changes in rods and cones following Abca4 knockdown in Psammomys obesus. (A,B) Immunostaining of rhodopsin (RHO) in retinal tissues collected from Psammomys obesus, sgRNAAbca4-eGFP (eGFP control) (A-A′′) and sgRNAAbca4-eGFP/Cas9 (Cas9 treated) (B-B′′) at 8 weeks post-injection. Sections were made close to lesion edges, where residual retina was still present. (A,B) images of eGFP fluorescence showing transfected rods and cones (green); (A′, B′) RHO immunostaining of same fields (red), and (A′′, B′′) merged images of eGFP, RHO and DAPI (blue). Comparison of RHO staining in control and treated retinas appears similar in intensity. Scale bar in B’’ = 40 µm for all panels. (C) Quantitative real-time PCR analysis of rho mRNA expression in Psammomys obesus retinas 8 weeks post-injection: WT un-injected retinas (n = 3), sgRNAAbca4-eGFP (eGFP control) and sgRNAAbca4-eGFP/Cas9 (Cas9 treated) (n = 4) retinas. The mRNA expression values were determined after normalization to internal control GAPDH and RPLP0 mRNA levels. There is no statistically significant difference between treated and either sgRNAAbca4-eGFP control or WT un-injected retina (p = 0.915, one-way ANOVA). (D,E) images of eGFP fluorescence showing transfected rods and cones (green); (D′, E′) OPN1MW immunostaining of same fields (red), and (D′′, E′′) merged images of eGFP, OPN1MW and DAPI (blue). Comparison of OPN1MW staining in control and treated retinas reveals a large decline in teated retinas. Scale bar in (E″) = 40 µm for all panels. (F) Quantitative real-time PCR analysis of opn1mw mRNA expression in Psammomys obesus retinas 8 weeks post-injection: WT un-injected retinas (n = 3), sgRNAAbca4-eGFP (eGFP control) and sgRNAAbca4-eGFP/Cas9 (Cas9 treated) (n = 4) retinas. The mRNA expression values were determined after normalization to internal control GAPDH and RPLP0 mRNA levels. Cas9-treated vs. eGFP-control, p = 0.036, Cas9-treated vs. WT, p = 0.027, one-way ANOVA. Data represented as mean ± SEM. *p < 0.05.
Fig. 8
Fig. 8
Transmission electron microscopy of the RPE/PR interface following Abca4 knockdown in Psammomys obesus. (A) Low magnification images taken from sgRNAAbca4-eGFP (eGFP control) eyes showed normal ultrastructural features: Retinal pigmented epithelium (RPE) contained elongated melanosomes closely adjacent to PR outer segments (OS), rod OS appearing cylindrical, more darkly staining and closer to the RPE microvilli, whereas cone OS were more deeply embedded and more lightly stained (open arrow). The inner segments (IS) were distinct from the underlying cell bodies in the outer nuclear layer (ONL) by the outer limiting membrane (arrow). (B) Higher power image of RPE/OS interface, again showing numerous elongated melanosomes within the RPE, as well as occasional phagosomes (Ph). The rod OS show normal stacked discs. (C) Higher power image of OS/IS junction, again the OS are intact and neatly aligned, the cones OS showing a more tapered aspect (*). (D) Low power images taken from sgRNAAbca4-eGFP/Cas9 treated eyes. The RPE contains numerous electron-dense inclusions packed into the apical cytoplasm, and many holes and damaged cells are seen in the OS layer, particularly at the level of the cone OS (red arrows); (E) Higher power images of RPE/OS interface, highlighting the abundant small round lipid deposits packing the RPE (red arrows), as well as several phagosomes (Ph). These deposits form a dense layer between the deeper RPE containing melanosomes and the abutting OS; F: Higher power images of the OS/IS region, showing the scattered free cytoplasm from dying cells (red arrows) and spaces between OS. Again, the rod OS appear less damaged than the cone OS, which are no longer easily recognisable. Scale bar in panel A = 10 µm (A,D), or 2 µm (B,C,E,F).
Fig. 9
Fig. 9
Quantification of bisretinoids from whole eyes of Psammomys obesus and albino Wistar rats Rattus norvegicus. Whole P. obesus eyes were removed 2 months post-injection from either sgRNAAbca4-eGFP (eGFP control, n = 4 each), or sgRNAAbca4-eGFP/Cas9 (Cas9 treated, n = 4 each) animals; and whole eyes were removed from young (40 days) or old (200 days) Wistar rats (n = 4 each), represented as mean ± SEM. Ultrahigh performance liquid chromatography (UPLC) was performed on samples to quantify two bisretinoids, A2E (A) and all-trans Retinal dimer (atRal-dimer) (B). (A) High levels of A2E were detected in both control and treated eyes of P. obesus (~ 40 pmol) compared to both young (~ 10 pmol) and old (~ 30 pmol) Wistar rats. (B) UPLC quantification of atRal-dimer from the same samples showed that both control and treated P. obesus eyes contained significant amounts of this molecule, whereas it was undetectable in Wistar rats.

Similar articles

Cited by

References

    1. Baylor, D. A. Photoreceptor signals and vision. Investig. Ophthalmol. Vis. Sci.2, 34–49 (1987). - PubMed
    1. Allikmets, R. A photoreceptor cell-specific ATP-binding transporter gene (ABCR) is mutated in recessive Stargardt macular dystrophy. Nat. Genet.17, 122 (1997). - PubMed
    1. Cremers, F. P. M., Lee, W., Collin, R. W. J. & Allikmets, R. Clinical spectrum, genetic complexity and therapeutic approaches for retinal disease caused by ABCA4 mutations. Prog. Retin. Eye Res.79, 100861 (2020). - PMC - PubMed
    1. Rotenstreich, Y., Fishman, G. A. & Anderson, R. J. Visual acuity loss and clinical observations in a large series of patients with Stargardt disease. Ophthalmology110, 1151–1158 (2003). - PubMed
    1. Fujinami, K. et al. A longitudinal study of Stargardt disease: clinical and electrophysiologic assessment, progression, and genotype correlations. Am. J. Ophthalmol.155, 1075–1088 (2013). - PubMed

MeSH terms

Substances

LinkOut - more resources