

Evaluation of metabolite stability in dried blood spot stored at different temperatures and times
- PMID: 39730629
- PMCID: PMC11680943
- DOI: 10.1038/s41598-024-82041-2
Evaluation of metabolite stability in dried blood spot stored at different temperatures and times
Abstract
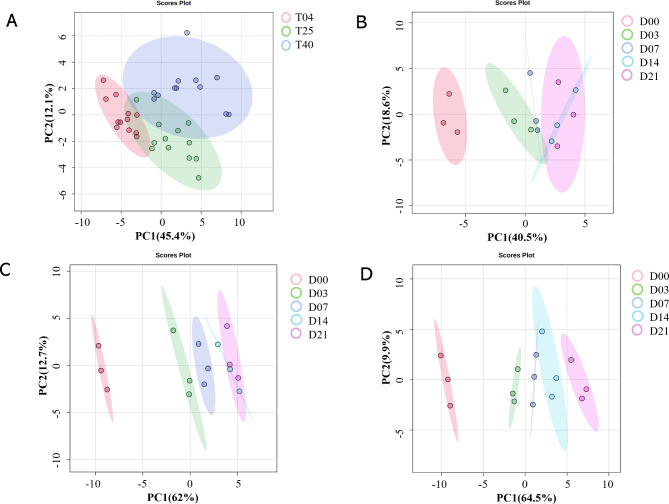
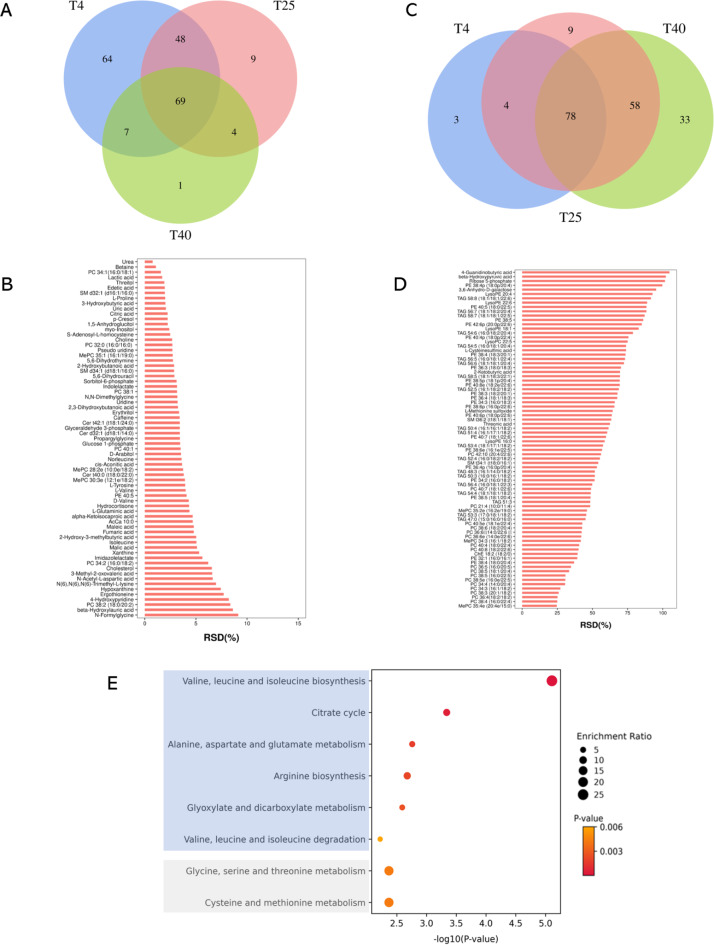
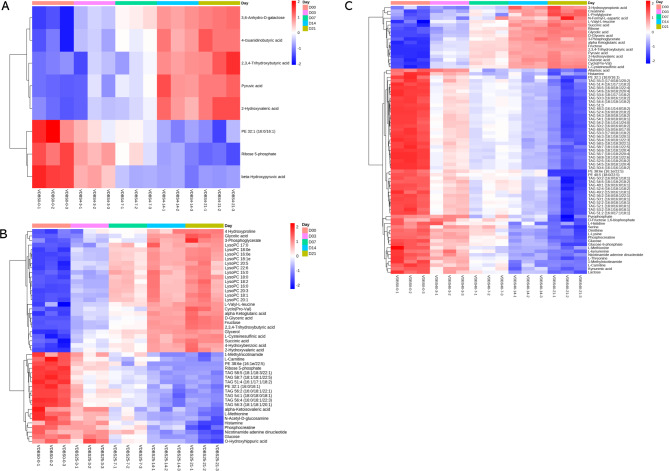
Dried blood spot (DBS) sampling offers significant advantages over conventional blood collection methods, such as reduced sample volume, minimal invasiveness, suitability for home-based sampling, and ease of transport. However, understanding the effects of variable storage temperatures and times on metabolite stability is crucial due to varying intervals and delivery conditions between sample collection and metabolomics analysis. To minimize biological variances, all samples were collected from the same individual simultaneously and stored at three different temperatures (4 °C, 25 °C, and 40 °C) for diverse time points (3, 7, 14, and 21 days). Metabolic profiling was conducted an untargeted gas chromatography-mass spectrometry (GC-MS) and ultra-high performance liquid chromatography-mass spectrometry (UHPLC-MS)-based multi-platform metabolomics. Principal component analysis (PCA) showed alterations in metabolite stability at different temperatures, with phosphatidylcholines (PCs) and triglycerides (TAGs) as the first principal component (PC1). Specifically, we identified 69 metabolites that remained stable across all three temperatures over the 21-day period, while 78 metabolites exhibited instability. Furthermore, linear correlations between metabolite intensity and storage time were observed. Overall, our study elucidated the influence of storage temperature and time on specific metabolite stability in DBS samples, providing valuable insights for study design, biomarker selection, and data improvement.
Keywords: DBS; Metabolite stability; Metabolomics; Storage temperature and time.
© 2024. The Author(s).
Conflict of interest statement
Declarations. Competing interests: The authors declare no competing interests. Ethics approval and consent to participate: This study was approved by the Research Ethics Committee and the informed consents were obtained from the participant. The study was conducted in accordance with the guidelines of the International Conference on Harmonization for Good Clinical Practice and the Declaration of Helsinki.
Figures
Similar articles
-
Investigation of the 12-Month Stability of Dried Blood and Urine Spots Applying Untargeted UHPLC-MS Metabolomic Assays.Anal Chem. 2019 Nov 19;91(22):14306-14313. doi: 10.1021/acs.analchem.9b02577. Epub 2019 Oct 29. Anal Chem. 2019. PMID: 31618007
-
Effects of Long-Term Storage on the Biobanked Neonatal Dried Blood Spot Metabolome.J Am Soc Mass Spectrom. 2023 Apr 5;34(4):685-694. doi: 10.1021/jasms.2c00358. Epub 2023 Mar 13. J Am Soc Mass Spectrom. 2023. PMID: 36913955 Free PMC article.
-
Dried blood spot microsampling: A semi-quantitative 4D-lipidomics approach using ultrahigh-performance liquid chromatography - high-resolution mass spectrometry (UHPLC - HRMS).Talanta. 2025 May 15;287:127677. doi: 10.1016/j.talanta.2025.127677. Epub 2025 Feb 1. Talanta. 2025. PMID: 39914048
-
Mass spectrometric based approaches in urine metabolomics and biomarker discovery.Mass Spectrom Rev. 2017 Mar;36(2):115-134. doi: 10.1002/mas.21455. Epub 2015 Apr 16. Mass Spectrom Rev. 2017. PMID: 25881008 Review.
-
Dried blood spots: concepts, present status, and future perspectives in bioanalysis.Drug Test Anal. 2014 May;6(5):399-414. doi: 10.1002/dta.1646. Epub 2014 Apr 1. Drug Test Anal. 2014. PMID: 24692095 Review.
Cited by
-
Monitoring Immune Responses to Vaccination: A Focus on Single-Cell Analysis and Associated Challenges.Vaccines (Basel). 2025 Apr 16;13(4):420. doi: 10.3390/vaccines13040420. Vaccines (Basel). 2025. PMID: 40333304 Free PMC article. Review.
-
Evaluation of Antiepileptic Drugs' Stability in Oral Fluid Samples.Pharmaceuticals (Basel). 2025 Jul 17;18(7):1049. doi: 10.3390/ph18071049. Pharmaceuticals (Basel). 2025. PMID: 40732336 Free PMC article.
References
-
- Pang, H., Jia, W. & Hu, Z. Emerging applications of metabolomics in clinical pharmacology. Clin. Pharmacol. Ther.106 (3), 544–556 (2019). - PubMed
-
- Guthrie, R. & Susi, A. A simple phenylalanine method for detecting phenylketonuria in large populations of newborn infants. Pediatrics32 (3), 338–343 (1963). - PubMed
MeSH terms
Substances
LinkOut - more resources
Full Text Sources
Research Materials
Miscellaneous
