. 2024 Dec 28;14(1):31037.
doi: 10.1038/s41598-024-82261-6.

Transduction of jellyfish superoxide dismutase mediated by TAT peptide ameliorates H2O2-induced oxidative stress in HaCaT cells

Affiliations

Transduction of jellyfish superoxide dismutase mediated by TAT peptide ameliorates H2O2-induced oxidative stress in HaCaT cells

Bo Wang et al. Sci Rep. .

Abstract

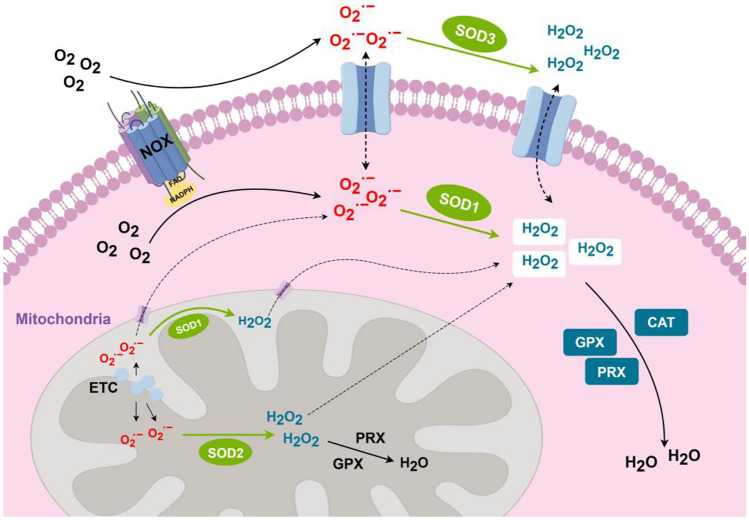
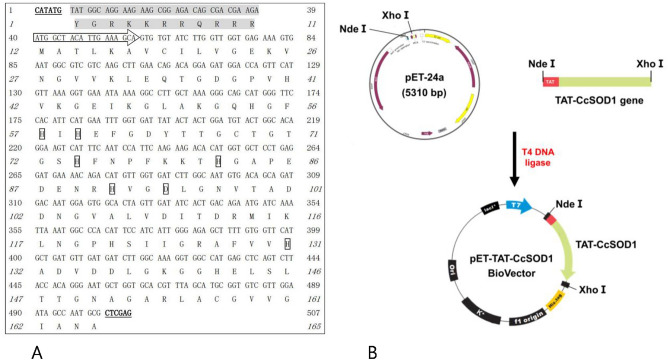
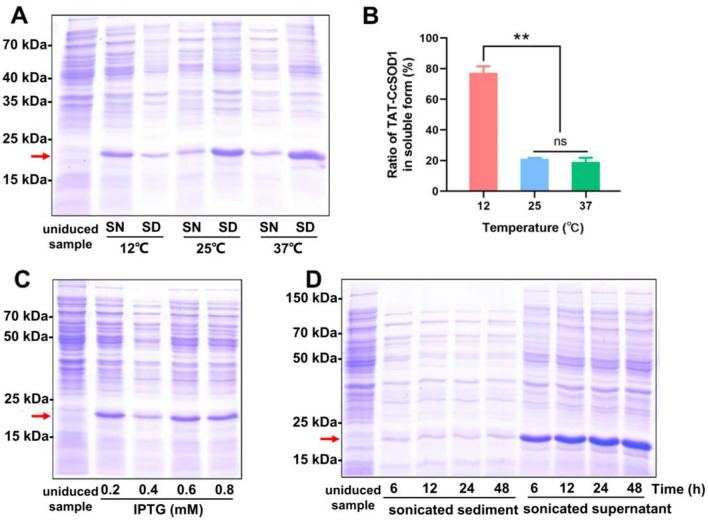
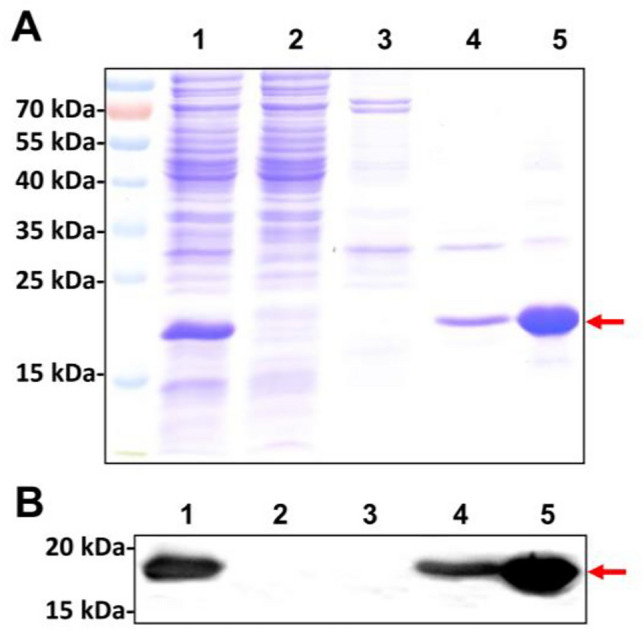
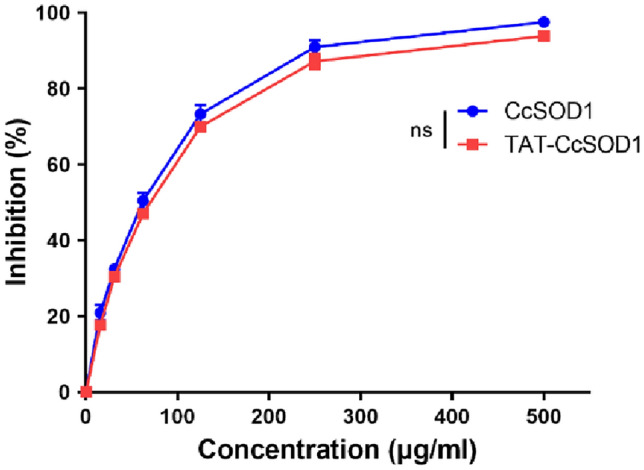
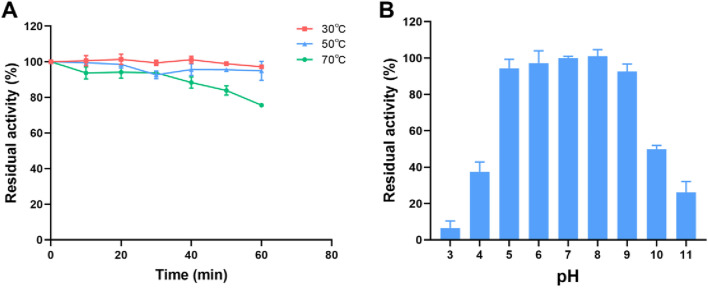
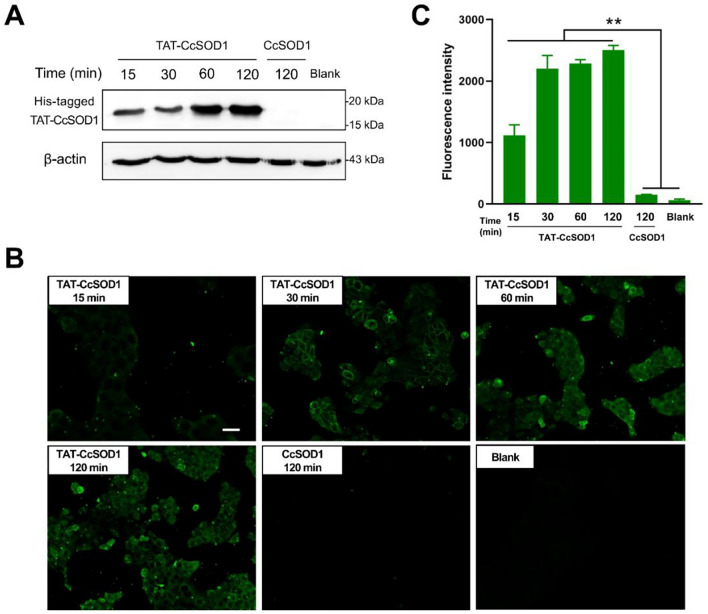
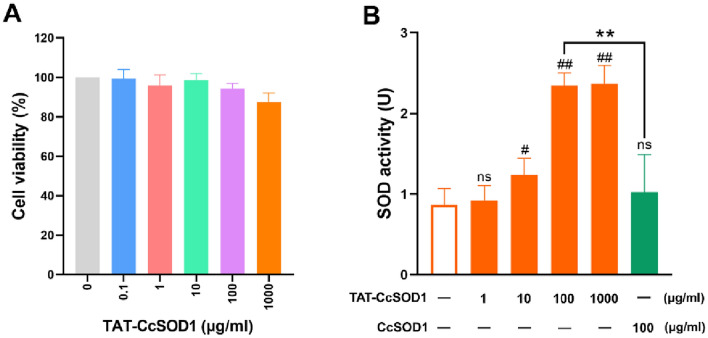
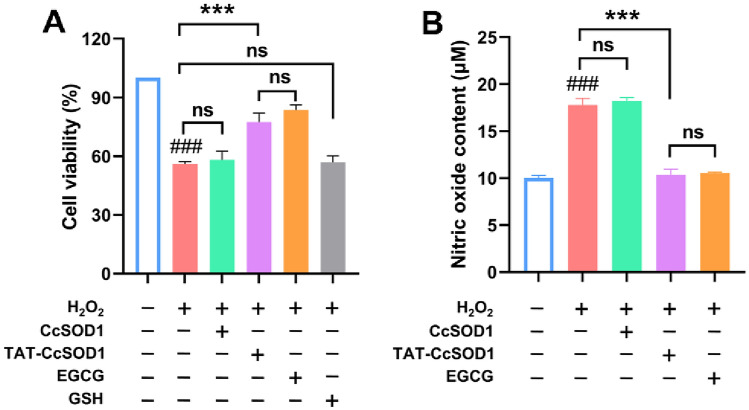
Superoxide dismutase (SOD) plays important roles in the balance of oxidation and antioxidation in body mostly by scavenging superoxide anion free radicals (O2.-). Previously, we reported a novel Cu/Zn SOD from jellyfish Cyanea capillata, named CcSOD1, which exhibited excellent SOD activity and high stability. TAT peptide is a common type of cell penetrating peptides (CPPs) that efficiently deliver extracellular biomacromolecules into cytoplasm. In this study, we constructed a recombinant expression vector that combined the coding sequences of TAT peptide and CcSOD1, and then obtained sufficient and high-purity TAT-CcSOD1 fusion protein. Compared with some reported SODs/CPP-SODs, TAT-CcSOD1 possessed stronger tolerance to heat and acid-base environment. TAT-CcSOD1 efficiently penetrated cell membrane and significantly enhanced the O2.- scavenging ability in cells, and attenuated H2O2-induced cytotoxicity and NO generation in HaCaT cells. This study serves as a critical step forward for the application of TAT-CcSOD1 as a potential protective/therapeutic agent against oxidative stress-related conditions in the future.

Keywords: Antioxidant; Oxidative stress; Superoxide dismutase; TAT peptide; Transmembrane.


Conflict of interest statement

Declarations. Competing interests: The authors declare no competing interests.

Figures

Fig. 1
Fig. 1
Roles of SOD in the regulation of intracellular and extracellular O2.−. NOX NADPH oxidase family, ETC mitochondrial electron transport chain, GPX glutathione peroxidase, PRX peroxidase, CAT catalase.
Fig. 2
Fig. 2
(A) The full-length coding sequence and deduced amino acids of TAT-CcSOD1. The restriction enzyme sites were bolded and underlined, the coding sequence of TAT gene was marked in grey, and the characteristic metal-binding sites were bolded and boxed. (B) Construct of TAT-CcSOD expressing plasmid.
Fig. 3
Fig. 3
Gel electrophoretic analysis of inducible expression of fusion protein TAT-CcSOD1. (A) TAT-CcSOD1 expression under different induction temperatures. SN, supernatant; SD, sediment. 0.2 mM IPTG was added into each bacterial solution for 6 h. (B) Ratio of TAT-CcSOD1 in soluble form was quantified using densitometric analysis by image J 1.8.0. (C) TAT-CcSOD1 expression under different IPTG concentrations. IPTG were added into each bacterial solution at 12 °C for 6 h, and the sonicated supernatant in each group was collected for gel electrophoresis analysis. (D) TAT-CcSOD1 expression under different induction time. 0.2 mM IPTG was added into each bacterial solution at 12 °C for 6, 12, 24 and 48 h. The sonicated sediment and supernatant in each group were collected for gel electrophoresis analysis. The quantification data were from at least three independent repetitions and the data were presented as means ± SD (n = 3) (ns stands for no significance, **P < 0.01).
Fig. 4
Fig. 4
Purification and identification of fusion protein TAT-CcSOD1. (A) SDS-PAGE analysis of the samples obtained during protein purification. (B) Western blot analysis of the samples obtained during protein purification. Lane 1, supernatant of sonicated lysates after induction; lane 2, the flow through peak; lane 3–5, the eluted peaks under 15%, 30% and 50% elution buffer (20 mM NaH2PO4, 500 mM NaCl, 500 mM imidazole, pH 7.4), respectively. The position corresponding to TAT-CcSOD1 protein is indicated by red arrow.
Fig. 5
Fig. 5
SOD activity of TAT-CcSOD1 protein. 20 μL of sample (0, 15.6, 31.25, 62.5, 125, 250 or 500 μg/mL) was mixed with 160 μL of SOD enzyme assay working solution and 20 μL of reaction starter solution at 37 °C for 30 min, and then the absorbance values were measured at 450 nm using a microplate reader. Inhibition (%) = (Acontrol − Asample)/(Acontrol − Ablank) × 100%. Three independent experiments were used to obtain quantitative data, and the data were presented as means ± SD (n = 3) (ns, no significance).
Fig. 6
Fig. 6
Stability of TAT-CcSOD1. (A) Thermal stability. TAT-CcSOD1 dissolved in PBS (pH 7.0) was incubated at 30 °C, 50 °C and 70 °C. The residual SOD activities were detected at different time points. (B) pH stability. TAT-CcSOD1 was incubated in buffers with different pH values (ranging from 3.0 to 11.0) at 37 °C for 2 h. SOD activity was measured and the activity before incubation was defined as 100%. The quantification data were from at least three independent repetitions and the data were presented as means ± SD (n = 3).
Fig. 7
Fig. 7
Transmembrane ability of TAT-CcSOD1 in HaCaT cells. (A) Western-blot analysis of intracellular TAT-CcSOD1 and CcSOD1 detected by His-tag antibody. (B) Transmembrane amount analysis of TAT-CcSOD1 and CcSOD1 by immunofluorescence assay. (C) The intensity of fluorescence was quantified using image J 1.8.0 software. The quantification data were from at least three independent repetitions and the data were presented as means ± SD (n = 3) (**P < 0.01).
Fig. 8
Fig. 8
Effect of TAT-CcSOD1 on intracellular SOD activity. (A) Cell viability after treatment with TAT-CcSOD1 was assessed by CCK-8 assay. (B) Effect of TAT-CcSOD1 on intracellular SOD activity in HaCaT cells. SOD activity (U) = inhibition%/(1 − inhibition%) units. Quantification data were obtained from three independent experiments and the data were shown as means ± SD (n = 3) (ns, no significance, #P < 0.05, ##P < 0.01 vs. control group, **P < 0.01).
Fig. 9
Fig. 9
Effects of TAT-CcSOD1 on H2O2-induced cytotoxicity and NO generation in HaCaT cells. (A) HaCaT cells were pretreated with 0.1 mg/ml TAT-CcSOD1, CcSOD1, EGCG and GSH for 2 h before exposure to 400 μM H2O2. Cell viabilities were determined using CCK-8 assay kit. (B) Effects of pretreated with TAT-CcSOD1, CcSOD1 and EGCG on NO level in the H2O2-induced cells model. Nitric oxide secretion in the supernatant of cell cultures was measured by NO Assay Kit. Three independent experiments were used in the quantification, and the data were presented as means ± SD (n = 3) (ns, no significance, #P < 0.05, ###P < 0.001 vs. control group, ***P < 0.001 vs. H2O2 alone group).

Similar articles

References

    1. Liou, G.-Y. & Storz, P. Reactive oxygen species in cancer. Free Radic. Res.44, 479–496 (2010). - PMC - PubMed
    1. Dan Dunn, J., Alvarez, L. A., Zhang, X. & Soldati, T. Reactive oxygen species and mitochondria: A nexus of cellular homeostasis. Redox Biol.6, 472–485 (2015). - PMC - PubMed
    1. Wang, P., Gong, Q., Hu, J., Li, X. & Zhang, X. Reactive oxygen species (ROS)-responsive prodrugs, probes, and theranostic prodrugs: Applications in the ROS-related diseases. J. Med. Chem.64, 298–325 (2021). - PubMed
    1. Li, D., Ding, Z., Du, K., Ye, X. & Cheng, S. Reactive oxygen species as a link between antioxidant pathways and autophagy. Oxid. Med. Cell. Longev.2021, 1–11 (2021). - PMC - PubMed
    1. Bang, E., Kim, D. H. & Chung, H. Y. Protease-activated receptor 2 induces ROS-mediated inflammation through Akt-mediated NF-κB and FoxO6 modulation during skin photoaging. Redox. Biol.44, 102022 (2021). - PMC - PubMed

MeSH terms

LinkOut - more resources