. 2024 Dec 28;14(1):30935.
doi: 10.1038/s41598-024-81835-8.

Macular patterns of neuronal and visual field loss in recovered optic neuritis identified by machine learning

Affiliations

Macular patterns of neuronal and visual field loss in recovered optic neuritis identified by machine learning

David Szanto et al. Sci Rep. .

Abstract

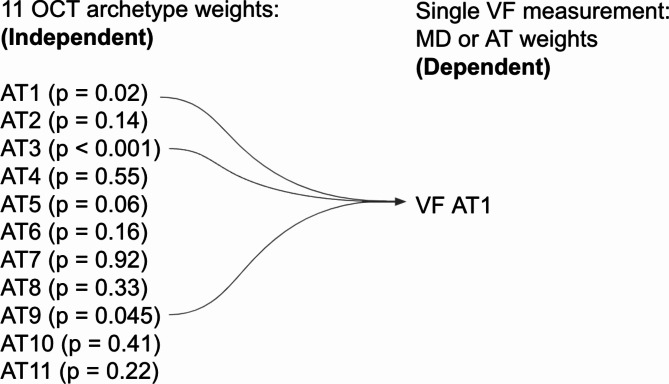
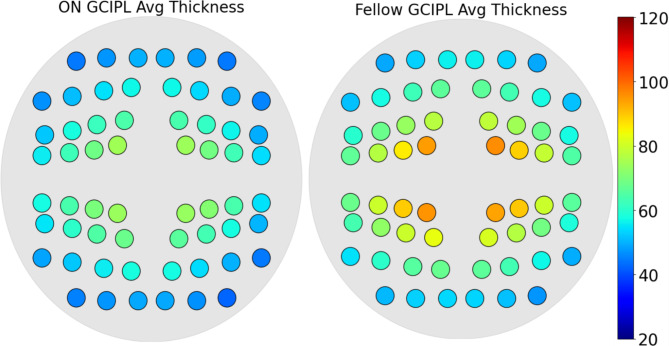
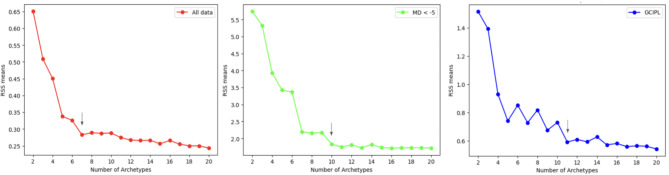
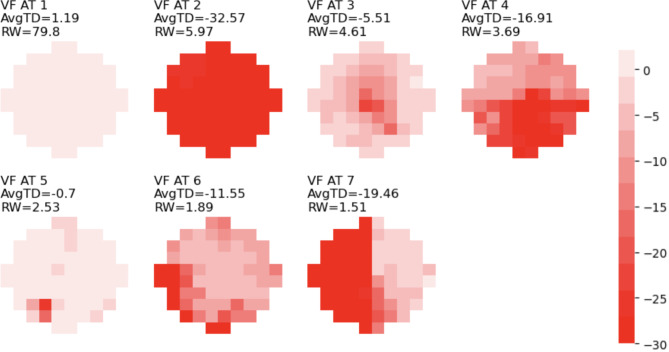
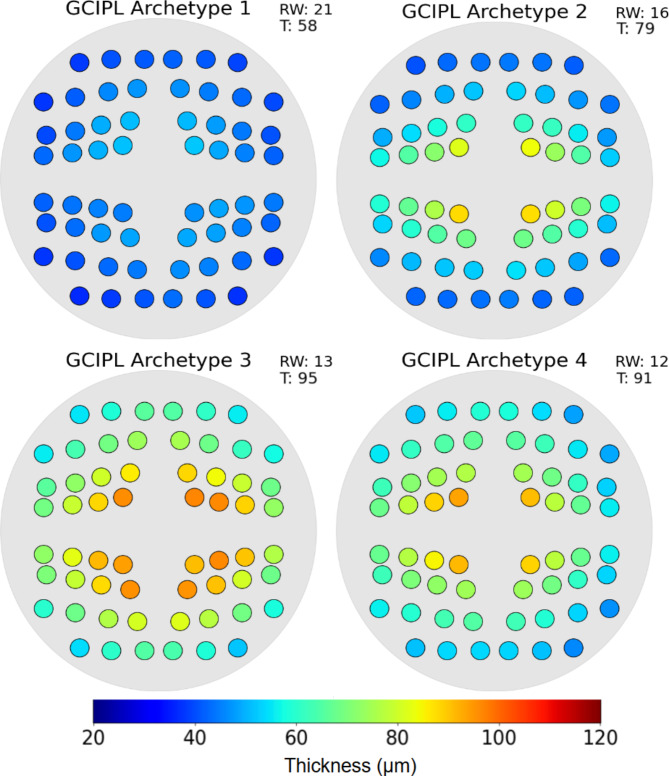
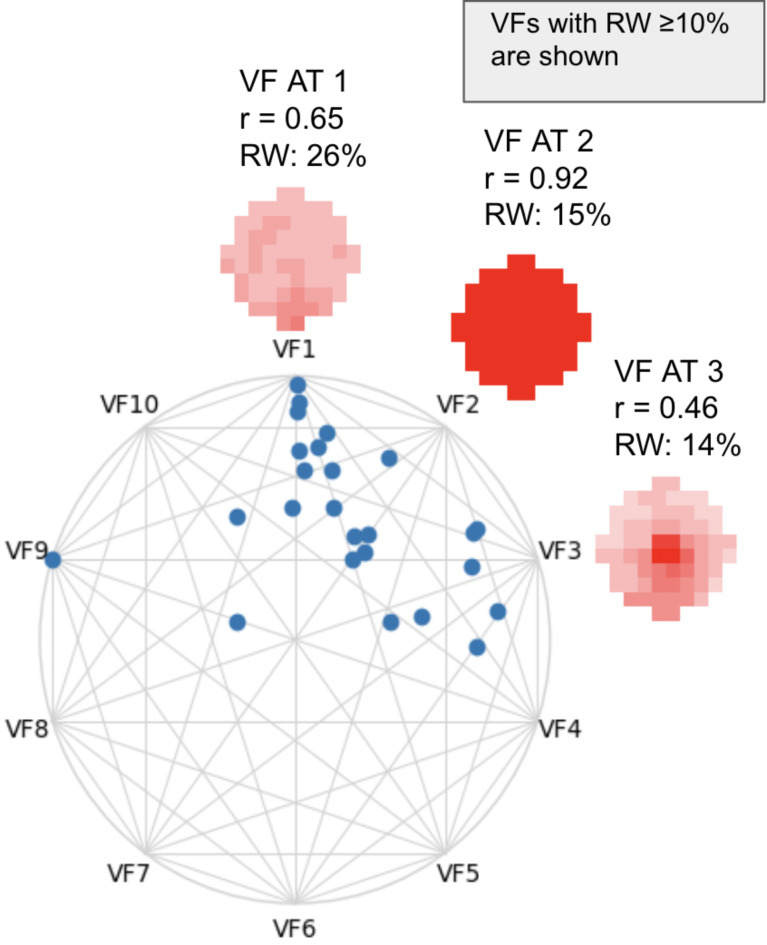
We used machine learning to investigate the residual visual field (VF) deficits and macula retinal ganglion cell (RGC) thickness loss patterns in recovered optic neuritis (ON). We applied archetypal analysis (AA) to 377 same-day pairings of 10-2 VF and optical coherence tomography (OCT) macula images from 93 ON eyes and 70 normal fellow eyes ≥ 90 days after acute ON. We correlated archetype (AT) weights (total weight = 100%) of VFs and total retinal thickness (TRT), inner retinal thickness (IRT), and macular ganglion cell-inner plexiform layer (GCIPL) thickness. AA showed most ON eyes had a 10-2 VF pattern like the normal fellow eye VF, despite having markedly thinner GCIPL patterns. AA identified 7 VF and 11 retinal thickness ATs for each OCT model. The normal VF AT constituted 80% of ON eyes and 90% of normal fellow eyes. The most common GCIPL AT consisted of diffuse thinning. We identified significant correlations for the normal AT weights using OCT AT weights of five GCIPL ATs (r = 0.45), four TRT ATs (0.53) and two IRT ATs (0.42). Following acute ON, most eyes had complete 10-2 VF recovery despite significant GCIPL thinning, suggesting compensatory mechanisms for vision.


Conflict of interest statement

Declarations. Competing interests: The authors declare no competing interests.

Figures

Fig. 1
Fig. 1
Linear regression of a single VF measurement using OCT archetypes. Linear regression analysis between the weights of 11 optical coherence tomography archetypes as the independent variable and a single visual field parameter (such as Mean Deviation or visual field archetype weight) as the dependent variable. Only the variables with weights p < 0.05 are included in the analysis.
Fig. 2
Fig. 2
GCIPL pointwise average of all ON and fellow eyes. Ganglion cell-inner plexiform layer thicknesses (µm) for all optic neuritis eyes (left) and the normal fellow eye (right). While the peripheral thickness is similar, there was marked central thinning in optic neuritis eyes.
Fig. 3
Fig. 3
Residual sum of squares. Residual sum of squares plot for determining the optimal number of archetypes for visual fields and optical coherence tomography. We determined the optimal number of archetypes as seven for all data, 10 for visual fields with mean deviation < -5 dB, and 11 for optical coherence tomography for the ganglion cell-inner plexiform layer, denoted by the arrows. This is the point where the curve flattens where the model also shows distinct visual field archetypes, ensuring their predictive abilities without overfitting.
Fig. 4
Fig. 4
Seven 10-2 VF ON archetypes. Visual fields of model 1. The varying shades of red within each archetype denote total deviation values, and scale at the right denotes the total deviation values associated with each shade. The color scales range from − 30 dB to 0 dB. Each archetype is shown along with its corresponding average total deviation value and relative weight (shown as percentage) within the dataset. The archetypes are numbered and displayed in order of relative weight.
Fig. 5
Fig. 5
Four meaningful GCIPL ATs. The gray circle bounds the macula (6 × 6 mm), and the colors correspond to the point thickness at the specified location, along with relative weight and average thickness. Ganglion cell-inner plexiform layer AT1 was markedly thinner than the other archetypes at all points, and AT3 was the thickest archetype, especially in the central four points.
Fig. 6
Fig. 6
Ten poor vision 10-2 VF ON archetypes. Visual fields of model 3, containing archetypes of optic neuritis eyes with deficient visual fields (mean deviation < − 5), with corresponding average total deviation and relative weight values (shown as percentage). The varying shades of red within each archetype denote total deviation values, and scale at the right denotes the total deviation values associated with each shade. The color scales range from − 30 dB to 0 dB. Each archetype is shown along with its corresponding average total deviation value and relative weight within the dataset. The archetypes are numbered and displayed in order of relative weight.
Fig. 7
Fig. 7
Simplex plot of deficient visual fields. The three meaningful archetypes from model 3 for eyes with mean deviation < − 5 dB at 90 days or later are shown and the linear regression of all optical coherence tomography ganglion cell-inner plexiform layer archetypes correlated with the three visual field archetypes. Archetypal analysis was trained on deficient outcome visual fields (n = 50) and transformed visual fields with same-day OCT pairings (n = 25) showing archetype decompositions.

References

    1. Optic Neuritis Study Group. The 5-year risk of MS after optic neuritis. Experience of the optic neuritis treatment trial. Neurology49 (5), 1404–1413 (1997). - PubMed
    1. Trobe, J. D., Beck, R. W., Moke, P. S. & Cleary, P. A. Contrast sensitivity and other vision tests in the optic neuritis treatment trial. Am. J. Ophthalmol.121 (5), 547–553 (1996). - PubMed
    1. Beck, R. W. et al. A randomized, controlled trial of corticosteroids in the treatment of acute optic neuritis. The Optic Neuritis Study Group. N Engl. J. Med.326 (9), 581–588 (1992). - PubMed
    1. De Moraes, C. G. et al. 24 – 2 visual fields miss central defects shown on 10 – 2 tests in glaucoma suspects, ocular hypertensives, and early glaucoma. Ophthalmology124 (10), 1449–1456 (2017). - PMC - PubMed
    1. Keltner, J. L. et al. Baseline visual field profile of optic neuritis: the experience of the Optic Neuritis Treatment Trial. Arch. Ophthalmol.111 (2), 231–234 (1993). - PubMed

LinkOut - more resources