

Identification of potential biomarkers and pathways involved in high-altitude pulmonary edema using GC-MS and LC-MS metabolomic methods
- PMID: 39730680
- PMCID: PMC11680936
- DOI: 10.1038/s41598-024-82047-w
Identification of potential biomarkers and pathways involved in high-altitude pulmonary edema using GC-MS and LC-MS metabolomic methods
Erratum in
-
Publisher Correction: Identification of potential biomarkers and pathways involved in high-altitude pulmonary edema using GC-MS and LC-MS metabolomic methods.Sci Rep. 2025 Feb 28;15(1):7209. doi: 10.1038/s41598-025-90954-9. Sci Rep. 2025. PMID: 40021693 Free PMC article. No abstract available.
Abstract
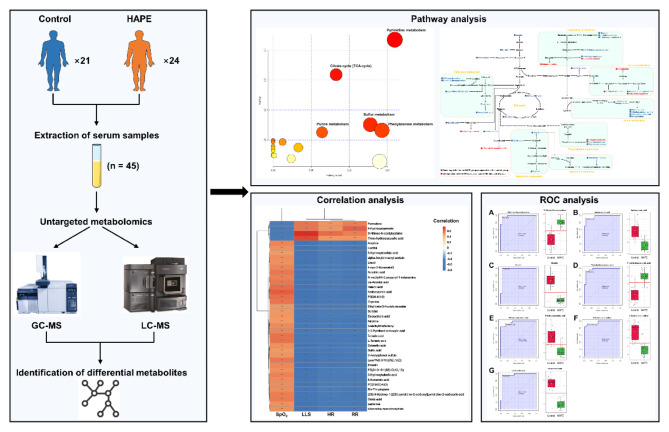
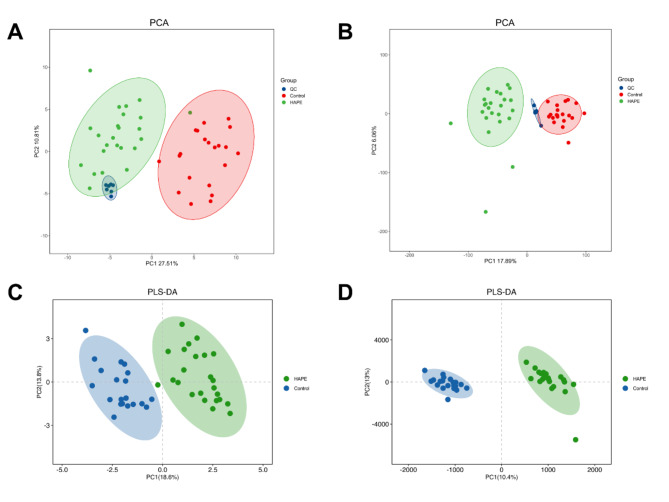
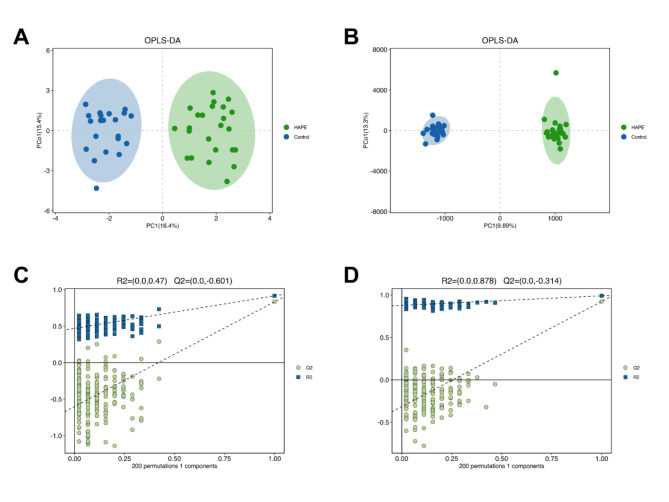
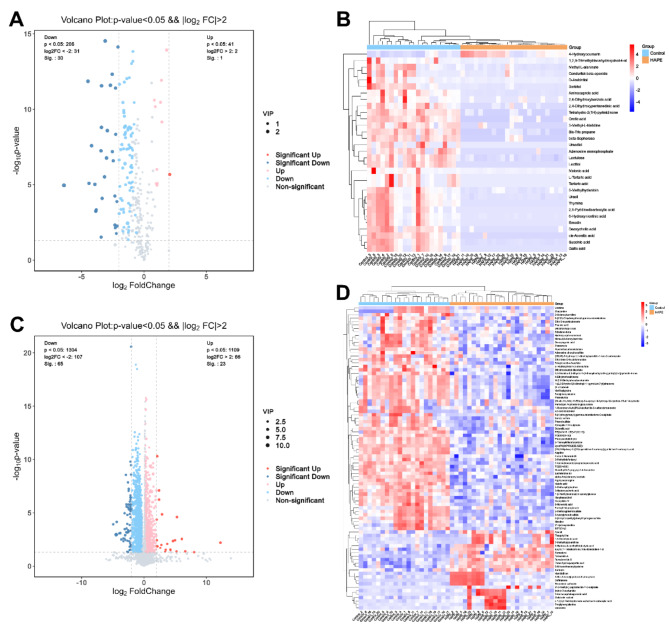
High-altitude pulmonary edema (HAPE) is a life-threatening altitude sickness afflicting certain individuals after rapid ascent to high altitude above 2500 m. In the setting of HAPE, an early diagnosis is critical and currently based on clinical evaluation. The aim of this study was to utilize the metabolomics to identify the altered metabolic patterns and potential biomarkers for HAPE. Serum samples from HAPE patients (n = 24) and healthy controls (n = 21) were analyzed by gas chromatography-mass spectrometry (GC-MS) and liquid chromatography-mass spectrometry (LC-MS) to profile differential metabolites and explore dysregulated metabolic pathways. The correlation analysis and receiver operating characteristic (ROC) curve analysis were further performed to screen biomarkers for HAPE. A total of 119 differential metabolites between the control and HAPE groups were identified. Top dysregulated pathways included pyrimidine metabolism, citrate cycle, sulfur metabolism, phenylalanine metabolism and purine metabolism. After correlation analysis with clinical indices, 39 differential metabolites were obtained as potential biomarkers related to HAPE. Finally, 7 biomarkers, specifically S-nitroso-N-acetylcysteine, aminocaproic acid, emodin, threo-hydroxyaspartic acid, 6-hydroxynicotinic acid, 3-acetylphenol sulfate and cis-aconitic acid, were screened out through ROC analysis, which displayed high diagnostic accuracy for HAPE. Taken together, the altered serum metabolic profile is associated with the occurrence of HAPE. Diagnostic tests based on the biomarkers from metabolomics may hold promise as a strategy for early detection of HAPE.
Keywords: Biomarkers; Disturbed metabolism; High-altitude pulmonary edema; Metabolomics.
© 2024. The Author(s).
Conflict of interest statement
Declarations. Competing interests: The authors declare no competing interests. Ethics approval and consent to participate: This study was approved by the Ethics Committee of The 940 Hospital of Joint Logistics Support Force of Chinese PLA (registration number: 2021KYLL152) and all the participants have provided written informed consent.
Figures


References
MeSH terms
Substances
Supplementary concepts
Grants and funding
LinkOut - more resources
Full Text Sources
Medical
Miscellaneous
