

Comparative evaluation of spatiotemporal methods for effective dengue cluster detection with a case study of national surveillance data in Thailand
- PMID: 39730684
- PMCID: PMC11680836
- DOI: 10.1038/s41598-024-82212-1
Comparative evaluation of spatiotemporal methods for effective dengue cluster detection with a case study of national surveillance data in Thailand
Abstract
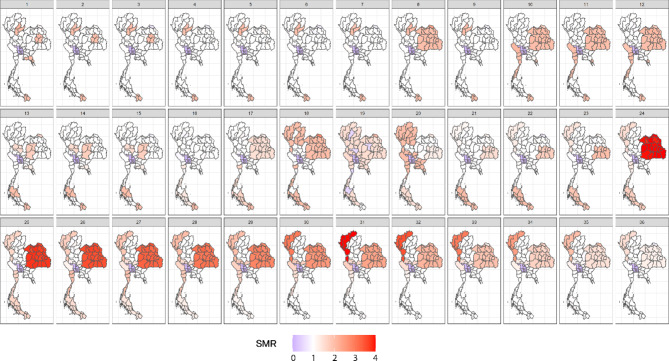
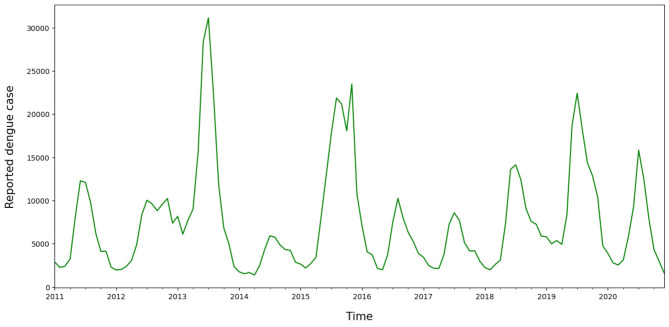
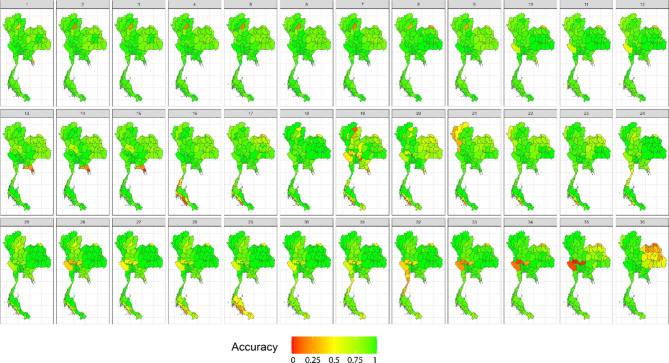
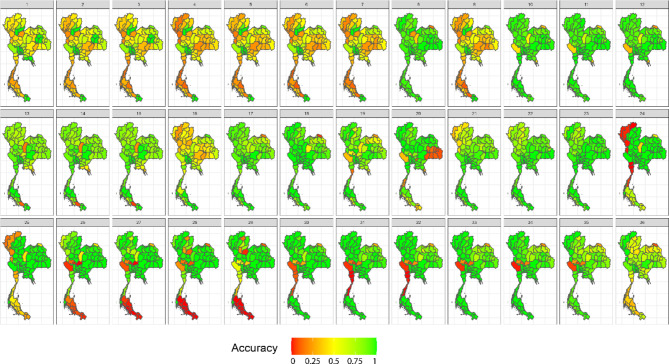
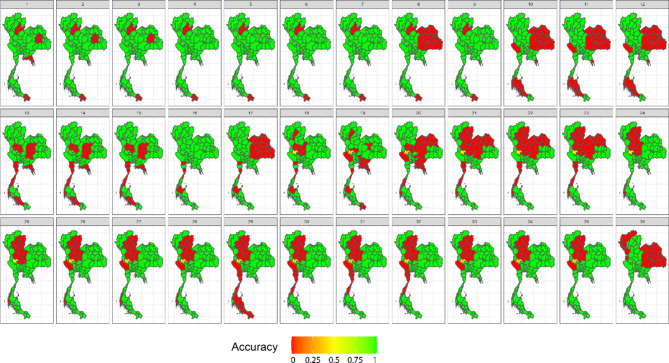
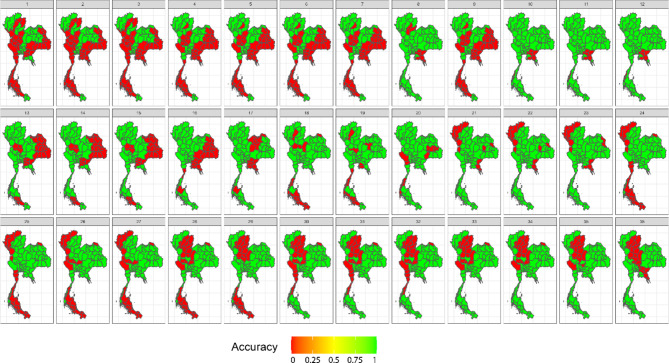
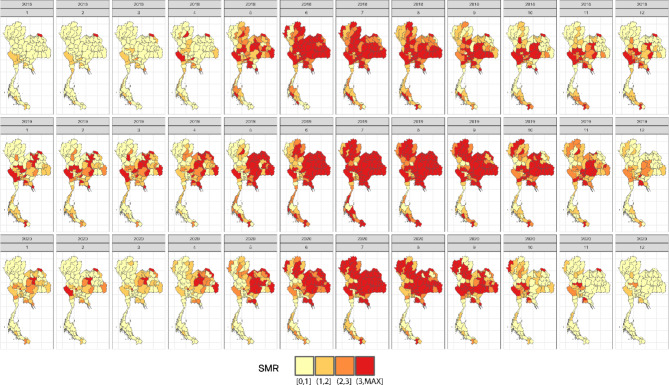
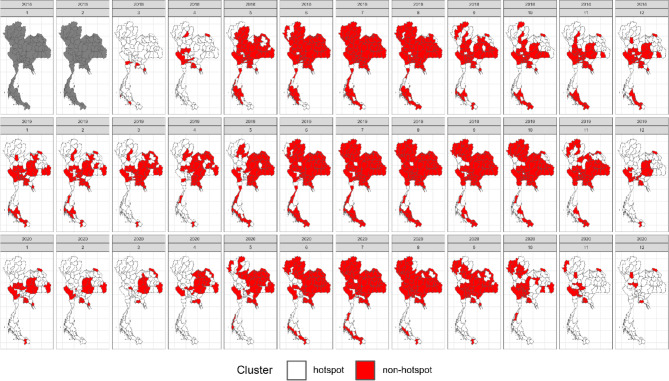
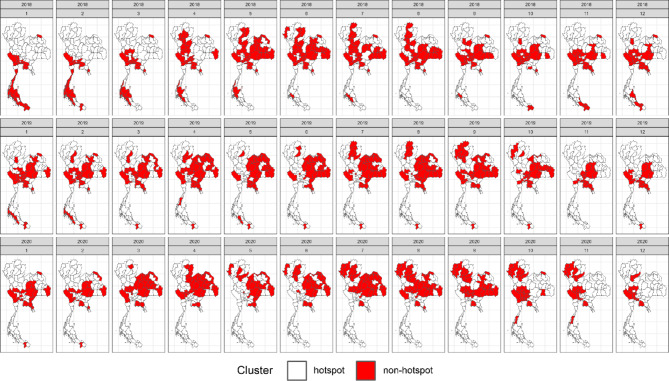
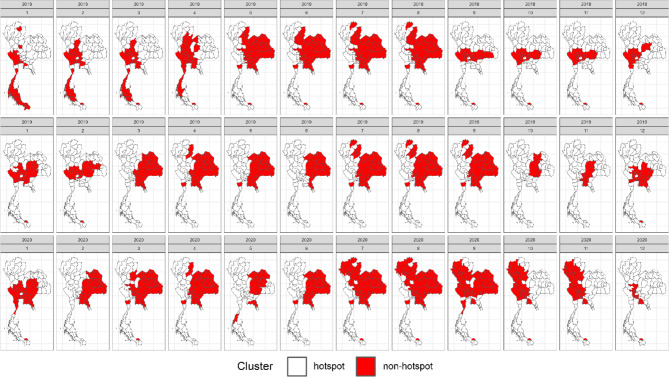
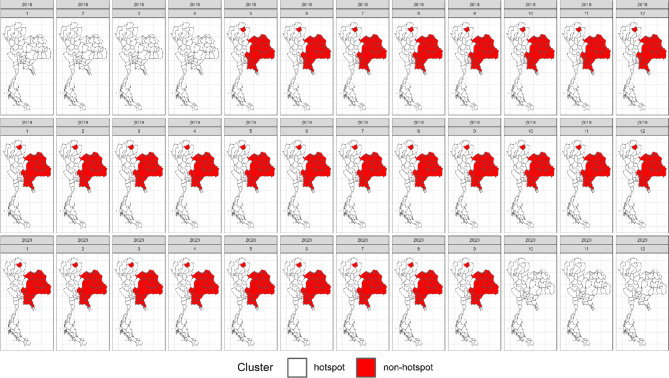
Dengue fever poses a significant public health burden in tropical regions, including Thailand, where periodic epidemics strain healthcare resources. Effective disease surveillance is essential for timely intervention and resource allocation. Various methods exist for spatiotemporal cluster detection, but their comparative performance remains unclear. This study compared spatiotemporal cluster detection methods using simulated and real dengue surveillance data from Thailand. A simulation study explored diverse disease scenarios, characterized by varying magnitudes and spatial-temporal patterns, while real data analysis utilized monthly national dengue surveillance data from 2018 to 2020. Evaluation metrics included accuracy, sensitivity, specificity, positive predictive value, and negative predictive value. Bayesian models and FlexScan emerged as top performers, demonstrating superior accuracy and sensitivity. Traditional methods such as Getis Ord and Moran's I showed poorer performance, while other scanning-based approaches like spatial SaTScan exhibited limitations in positive predictive value and tended to identify large clusters due to the inflexibility of its scanning window shape. Bayesian modeling with a space-time interaction term outperformed testing-based cluster detection methods, emphasizing the importance of incorporating spatiotemporal components. Our study highlights the superior performance of Bayesian models and FlexScan in spatiotemporal cluster detection for dengue surveillance. These findings offer valuable guidance for policymakers and public health authorities in refining disease surveillance strategies and resource allocation. Moreover, the insights gained from this research could be valuable for other diseases sharing similar characteristics and settings, broadening the applicability of our findings beyond dengue surveillance.
Keywords: Cluster detection; Dengue; Spatiotemporal; Surveillance; Thailand.
© 2024. The Author(s).
Conflict of interest statement
Declarations. Competing interests: The authors declare no competing interests.
Figures
Similar articles
-
Spatiotemporal multi-disease transmission dynamic measure for emerging diseases: an application to dengue and zika integrated surveillance in Thailand.BMC Med Res Methodol. 2019 Oct 26;19(1):200. doi: 10.1186/s12874-019-0833-6. BMC Med Res Methodol. 2019. PMID: 31655546 Free PMC article.
-
Bayesian spatiotemporal modeling with sliding windows to correct reporting delays for real-time dengue surveillance in Thailand.Int J Health Geogr. 2020 Mar 3;19(1):4. doi: 10.1186/s12942-020-00199-0. Int J Health Geogr. 2020. PMID: 32126997 Free PMC article.
-
Spatial and temporal patterns of dengue incidence in northeastern Thailand 2006-2016.BMC Infect Dis. 2019 Aug 23;19(1):743. doi: 10.1186/s12879-019-4379-3. BMC Infect Dis. 2019. PMID: 31443630 Free PMC article.
-
Revealing two dynamic dengue epidemic clusters in Thailand.BMC Infect Dis. 2020 Dec 4;20(1):927. doi: 10.1186/s12879-020-05666-4. BMC Infect Dis. 2020. PMID: 33276742 Free PMC article.
-
Advances in spatiotemporal models for non-communicable disease surveillance.Int J Epidemiol. 2020 Apr 1;49 Suppl 1(Suppl 1):i26-i37. doi: 10.1093/ije/dyz181. Int J Epidemiol. 2020. PMID: 32293008 Free PMC article. Review.
Cited by
-
Global spatiotemporal analysis of suicide epidemiology and risk factor associations from 2000 to 2019 using Bayesian space time hierarchical modeling.Sci Rep. 2025 Apr 14;15(1):12785. doi: 10.1038/s41598-025-97064-6. Sci Rep. 2025. PMID: 40229337 Free PMC article.
References
-
- Shepard, D. S. et al. The global economic burden of dengue: A systematic analysis. Lancet Infect. Dis.16(8), 935–941 (2016). - PubMed
Publication types
MeSH terms
LinkOut - more resources
Full Text Sources
Medical
