. 2024 Dec 28;14(1):31010.
doi: 10.1038/s41598-024-82133-z.

Genetic factors regulating Plasmodium falciparum gametocytogenesis identified by phenotypic screens

Affiliations

Genetic factors regulating Plasmodium falciparum gametocytogenesis identified by phenotypic screens

Camilla V Pires et al. Sci Rep. .

Abstract

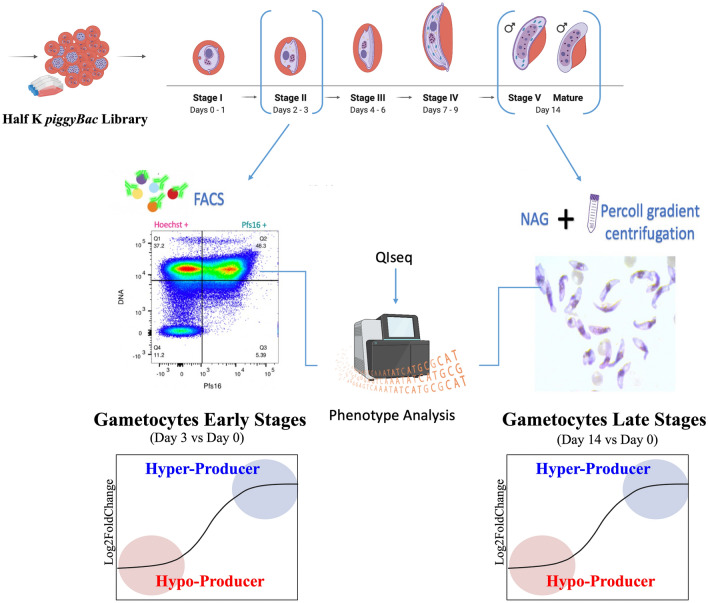
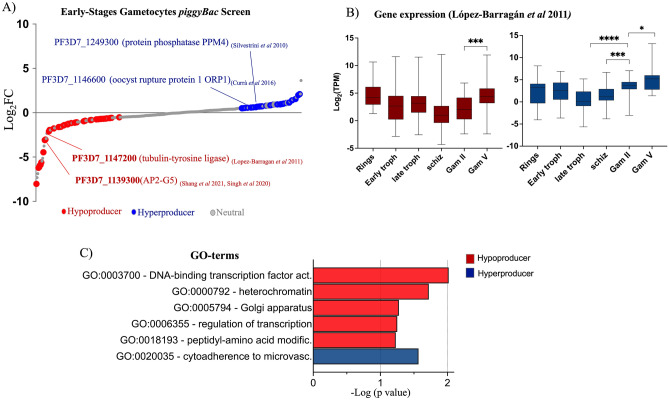
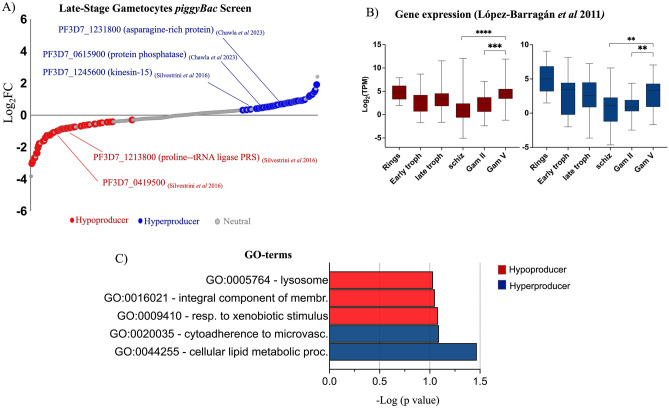
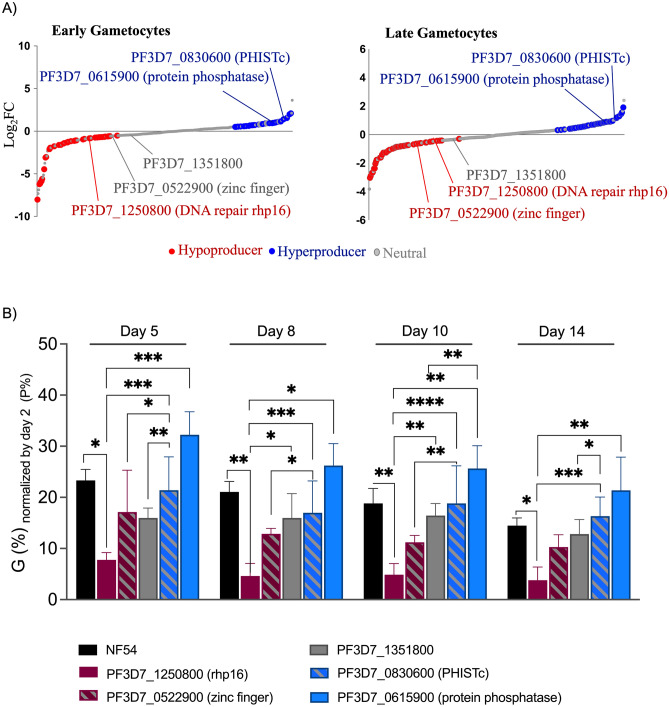
Successful transmission of Plasmodium falciparum from one person to another relies on the complete intraerythrocytic development of non-pathogenic sexual gametocytes infectious for anopheline mosquitoes. Understanding the genetic factors that regulate gametocyte development is vital for identifying transmission-blocking targets in the malaria parasite life cycle. Toward this end, we conducted a forward genetic study to characterize the development of gametocytes from sexual commitment to mature stage V. We described a new analysis pipeline for the piggyBac transposon-based mutagenesis phenotypic screen to identify genes that influence both early and late gametocyte stages. We classified individual mutants that increased or decreased parasite abundance as the hypoproducer and hyperproducer phenotypes, respectively, revealing distinctive temporal genetic factors early and late in the sexual development cycle. The study identifies that disruption in factors involved in transcription, protein trafficking and DNA repair are associated with decreasing gametocyte production, while modifications in phosphatase activity are linked to hyperproduction of gametocytes. Our study provides an optimized approach on genotype-phenotype evaluation, offering a new resource for understanding potential targets for therapeutic intervention strategies to disrupt transmission.


Conflict of interest statement

Declarations. Competing interests: The authors declare no competing interests.

Figures

Fig. 1
Fig. 1
Approach for the large-scale gametocyte phenotype screen, using piggyBac Half-K library. Methodology for enrichment of gametocyte populations. Early gametocytes were isolated with FACS selection by antibody staining for Pfs16. Gametocytes cultures at day 3 were first enriched by Percoll® (see methods) and incubated with anti-Pfs16 primary antibody and fluorescent secondary antibody followed by incubation with Hoechst. DNA from day 3 gametocytes (upper right quadrant) positive for both Hoechst and Pfs16 was harvested and sequenced. Stage V gametocytes (> 90% mature gametocytes) were isolated using Percoll® purification (see Methods). Parasite genomic DNA was harvested from day 0, day 3 and day 14. QIseq quantified each piggyBac mutant in the library by sequencing from the 5′ ends of a piggyBac insertion-site. Ranked piggyBac mutants based on gametocyte phenotypes in the library. QIseq results rely on counts of insertion sites for each mutant, which are normalized to calculate the relative abundances at day 3 and day 0 (Gametocytes Early stages), and day 14 and day 0 (Gametocytes Early stages). Gametocyte fold changes (day3 / day 0 and day 14 / day 0) were calculated for each mutant as a measure of their ability to commit into early gametocytes stages and to differentiate into mature gametocytes.
Fig. 2
Fig. 2
Genetic factors associated with early-stage gametocytes identified in the piggyBac phenotypic screen. (A) Relative differentiation of each piggyBac mutant in the library was determined by ranking mutants from low to high. The genes in the bottom indicated in red are significant and inferred as linked to gametocyte hypoproducers (Log2fold-change < −0.75 and adjusted p < 0.05). The top ranked genes indicated in blue are significant and inferred as kinked to gametocyte hyperproducers (Log2fold-change < −0.75 and adjusted p < 0.05). Hits highlighted include genes that have been previously associated with sexual development. The entire piggyBac screen dataset is provided in Table S3. B) The mean number of transcripts per kilobase per million per kilobase per million (TPM) of all the genes linked to hypoproducer and hyperproducer mutant phenotypes were determined from published transcriptome sequencing RNAseq data from Lopez-Barragan et al. (Table S4) (mean and maximum and minimum; *p < 0.01 **p < 0.001, ***p < 0.0001 ANOVA follow by Turkey’s test). (B) Functional enrichment of significant gene ontology (GO) terms for early gametocyte hypo and hyperproducer piggyBac mutant’s vs all other mutants in the library. The entire GO-dataset is provided in Table S5.
Fig. 3
Fig. 3
Genetic factors associated with late-stage gametocytes identified in the piggyBac phenotypic screen. (A) Relative differentiation of each piggyBac mutant in the library was determined by ranking mutants from low to high. The genes in the bottom indicated in red are significant and inferred as gametocyte hypoproducers (Log2fold-change < −0.75 and adjusted p < 0.05). The top ranked genes indicated in blue are significant and inferred as linked to gametocyte hyperproducers (Log2fold-change > 0.75 and adjusted p < 0.05). Hits highlighted include genes that have been previously associated with sexual development. The entire piggyBac screen dataset is provided in Table S3. (B) The mean number of transcripts per kilobase per million (TPM) of all the genes linked to hypoproducer and hyperproducer phenotype mutants were determined from published transcriptome sequencing RNAseq data from Lopez-Barragan et al. (Table S4) (mean and maximum and minimum; *p < 0.01 **p < 0.001, ***p < 0.0001, ****p < 0.00001, ANOVA follow by Turkey’s test). (C) Functional enrichment of significant gene ontology (GO) terms for early gametocyte hypoproducer and hyperproducer piggyBac mutant’s vs all other mutants in the library. The entire GO-dataset is provided in Table S6.
Fig. 4
Fig. 4
Gametocyte Development of Individual piggyBac Mutant Clones. (A) Five piggyBac mutant clones highlighted in the ranked plots from the early and late-stage gametocyte screens from the Half-k library (red for hypoproducer phenotype, blue for hyperproducer phenotype, and gray for neutral phenotype) were selected for phenotype validation. (B) Gametocyte development of these piggyBac mutants highlighted in (A) and NF54 were monitored over a period of 14 days. Gametocyte abundance was estimated by Giemsa-stained thin blood smears on Days 5, 8, 10 and 14 post-induction (Supplementary Table S9). To allow comparison among different lines, Gametocytemia (G %) for Days 5, 8, 10, and 14 were normalized by the parasitemia (P %) of Day 2 post-induction. At day 5, G% is commonly named gametocytes conversion rate (GCR%). The assay was performed with 3–5 biological replicates per parasite line (means with SD [error bars] are shown). Comparisons among parasite lines were analyzed using one-way ANOVA followed by Tukey’s test (*p < 0.01, **p < 0.001, ***p < 0.0001, ****p < 0.00001).

References

    1. WHO. World malaria report 2021.
    1. Menard, D. & Dondorp, A. Antimalarial drug resistance: A threat to malaria elimination. Cold Spring Harb. Perspect. Med.10.1101/cshperspect.a025619 (2017). - PMC - PubMed
    1. Sinden, R. E. Targeting the parasite to suppress malaria transmission. Adv. Parasitol.97, 147–185. 10.1016/bs.apar.2016.09.004 (2017). - PubMed
    1. Brancucci, N. M. B. et al. Lysophosphatidylcholine regulates sexual stage differentiation in the human malaria parasite Plasmodium falciparum. Cell. 171, 1532–1544. 10.1016/j.cell.2017.10.020 (2017). - PMC - PubMed
    1. Abdi, A. I. et al. Plasmodium falciparum adapts its investment into replication versus transmission according to the host environment. Elife. 10.7554/eLife.85140 (2023). - PMC - PubMed

Substances

LinkOut - more resources