. 2025 Feb;5(2):219-236.
doi: 10.1038/s43587-024-00776-z. Epub 2024 Dec 27.

A ganglioside-based immune checkpoint enables senescent cells to evade immunosurveillance during aging

Affiliations

A ganglioside-based immune checkpoint enables senescent cells to evade immunosurveillance during aging

Charlène Iltis et al. Nat Aging. 2025 Feb.

Abstract

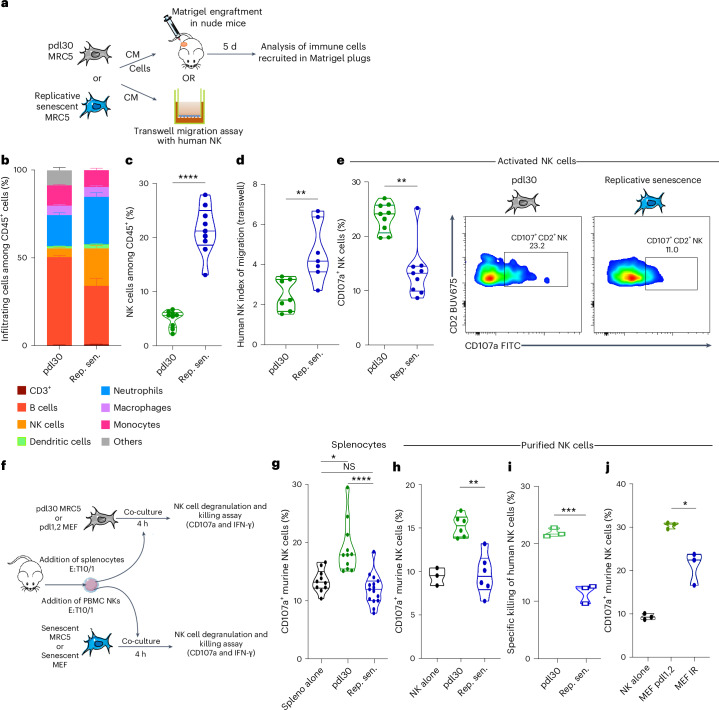
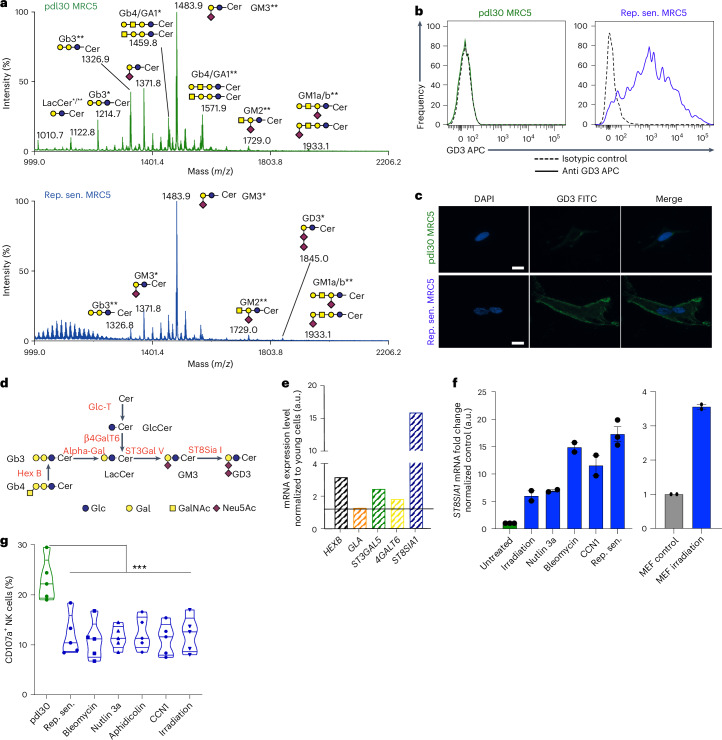
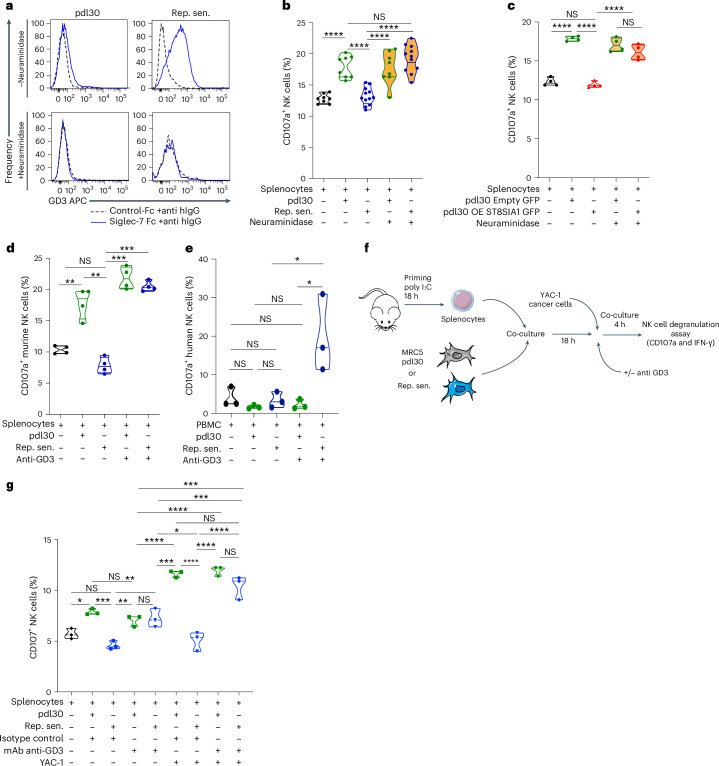
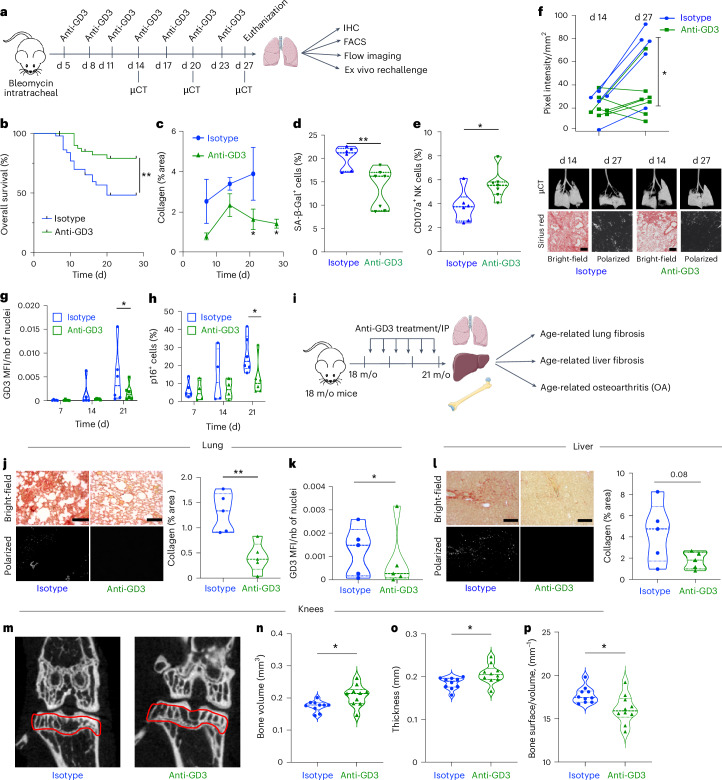
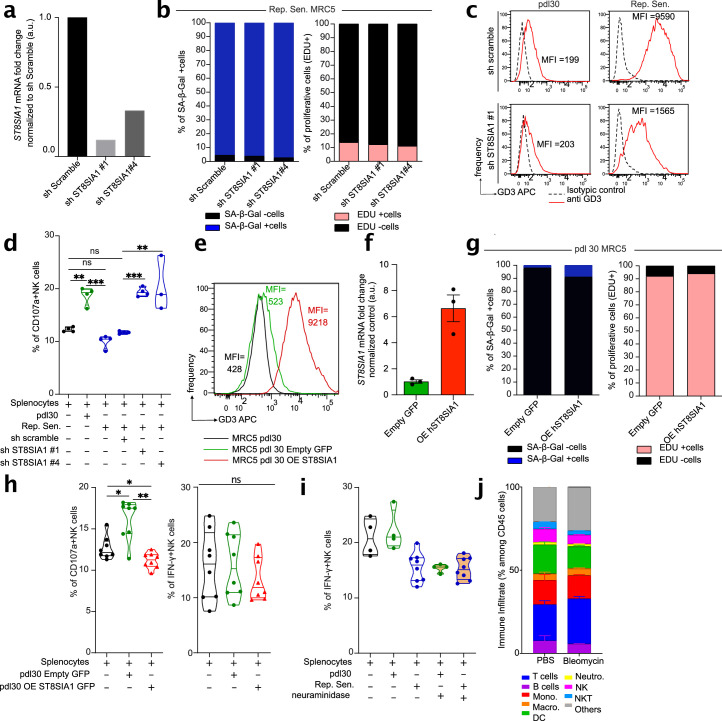
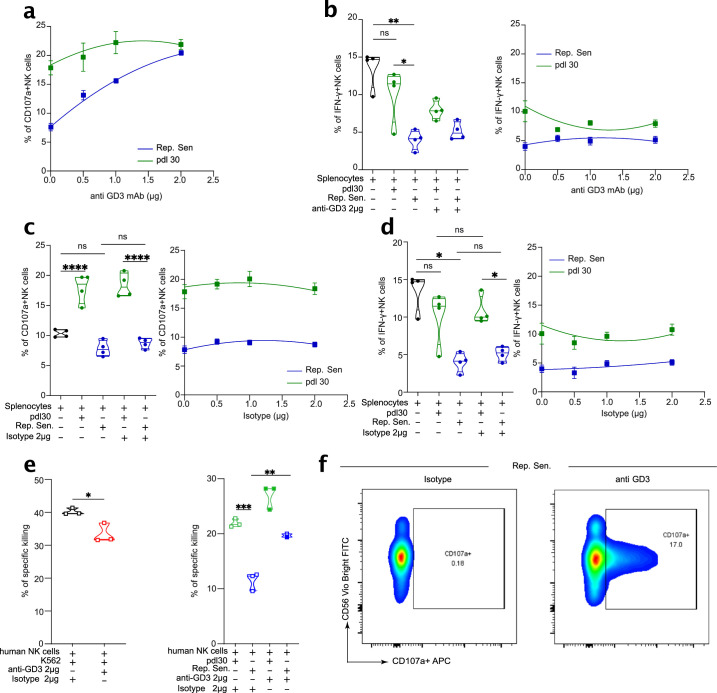
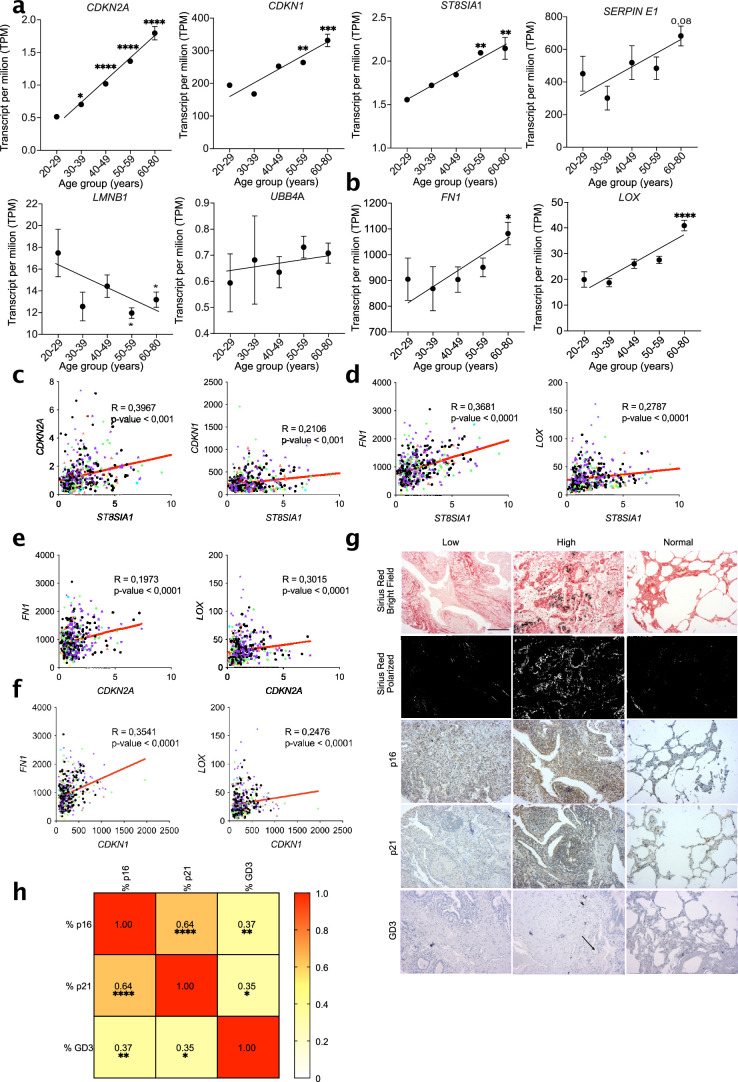
Although senescent cells can be eliminated by the immune system, they tend to accumulate with age in various tissues. Here we show that senescent cells can evade immune clearance by natural killer (NK) cells by upregulating the expression of the disialylated ganglioside GD3 at their surface. The increased level of GD3 expression on senescent cells that naturally occurs upon aging in liver, lung, kidney or bones leads to a strong suppression of NK-cell-mediated immunosurveillance. In mice, we found that targeting GD3+ senescent cells with anti-GD3 immunotherapy attenuated the development of experimentally induced or age-related lung and liver fibrosis and age-related bone remodeling. These results demonstrate that GD3 upregulation confers immune privilege to senescent cells. We propose that GD3 acts as a senescence immune checkpoint (SIC) that allows senescent cells to escape immunosurveillance and to trigger immune anergy during aging.


Conflict of interest statement

Competing interests: The authors declare no competing interests.

Figures

Fig. 1
Fig. 1. Human replicative SnCs recruit NK cells in vivo but inhibit their degranulation in an SASP-independent mechanism.
a, Scheme of the Matrigel plug assay and the transwell migration assay. b, Quantification of the immune cell infiltration induced by human replicative senescent MRC5 cells or proliferative MRC5 cells after pdl30 in Matrigel plug assay. c, Quantification of NK cells among infiltrating CD45+ cells. d, Quantification of in vitro migration assay of primary human NK cells in presence of conditioned media from pdl30 or replicative senescent MRC5 cells during transwell assays. e, Quantification of the NK cell degranulation within the Matrigel plug assay. f, Representative scheme and the effector:target (E:T) ratio of the in vitro co-culture assay of human replicative MRC5 senescent cells or irradiated senescent MEFs with mouse splenocytes or purified human NK cells or purified mouse NK cells. g,h, Quantification of NK cell degranulation in bulk among splenocytes (g) or purified (h) during in vitro co-culture experiments. i, In vitro killing assay of pdl30 MRC5 or replicative senescent MRC5 by primary human purified NK cells. j, Quantification of primary purified mouse NK cell degranulation in co-culture with pdl1,2 or irradiated senescent MEF cells. Data are presented as mean ± s.e.m. Experiments were performed with n = 9 mice per group (be)—*P < 0.05, **P < 0.01 and ***P < 0.001; two-tailed Mann–Whitney U-test (bj)—or represent the mean of n = 3 independent experiments—*P < 0.05, **P < 0.01 and ***P < 0.001; Student’s t-test (g). Rep. sen., replicative senescent. Source data
Fig. 2
Fig. 2. The ganglioside GD3 is strongly expressed by SnCs and inversely correlates with their immunogenic properties toward NK cells.
a, Mass spectrometry analysis of permethylated GSLs from human young (pdl30) or replicative senescent MRC5 cells; GSLs are present as d18:1/C16:0 (*) and d18:1/C24:0 (**) isomers. b,c, Analysis of GD3 expression in human young or replicative senescent MRC5 cells, either by FACS (b) or by IF (c) (scale, 20 μm). d, Representative scheme of ganglioside biosynthesis pathway. e, qPCR analysis of ganglioside biosynthesis enzymes in replicative SnCs. f, qPCR analysis of ST8SIA1 expression in replicative and stress-induced senescence in MRC5 cells and MEFs. g, Quantification of mouse NK cell degranulation in in vitro co-culture experiment with proliferative, replicative senescent or stress-induced MRC5 cells. Data represent the mean ± s.e.m. of n = 2 independent experiments (f), n = 3 independent experiments (ae) and n = 5 independent experiments (g). *P < 0.05, **P < 0.01 and ***P < 0.001; two-tailed Mann–Whitney U-test. Source data
Fig. 3
Fig. 3. ERRα/PGC-1α-dependent GD3 expression is absent in OIS allowing their activation of NK cells.
a, qPCR assessment of ST8SIA1, CDKN2A and CDKN1A expression in MRC5 cells in tamoxifen (tam)-inducible hRAS senescence. b,c, Senescence-related GSEA on SenMayo (b) and SASP (c) gene sets of hRAS-induced senescent MRC5 cells. d, Quantification of the NK cell infiltration induced by proliferative, replicative senescent, oncogene-induced or stress-induced MRC5 cells in Matrigel plug assay. e, Quantification of mouse NK cell degranulation in in vitro co-culture experiment with oncogene-induced or bleomycin-induced senescence in hMECs. f,e, Quantification of the in vivo NK cell degranulation induced by young, replicative, oncogene-induced or stress-induced senescent MRC5 cells in Matrigel plug assay. g,h, IPA of ST8SIA1 upstream pathways. Gene networks revealed by DEG in replicative senescence (g) and hRAS oncogene-induced senescence (h) in MRC5 cells compared to their control by RNA-seq (Extended Data Fig. 1) are overlayed in colors on each network. i,j, Flow cytometry assessment of GD3 expression (i) and qPCR assessment (j) of ST8SIA1 expression by replicative senescent MRC5 cells after 72 h of treatment with PGC1-α inhibitor (SR18292) and ERRα inhibitor (XCT790) normalized on DMSO-treated cells. kn, qPCR analysis of ST8SIA1 (k), PPARGC1A (l) and ESRRA (m) normalized on proliferative MRC5 cells and ratio between the expressions of PPARGC1A and ESRRA (n). o,p, qPCR analysis of NRIP1 normalized on proliferative MRC5 cells (o) and ratio between the expressions of PPARGC1A and NRIP1 (p). q, Representative scheme of the regulation of ST8SIA1 expression by the nuclear receptor ERRα, its co-activator PGC1-α and its co-repressor RIP140. Data are represented as mean ± s.e.m. (a). Experiments in a and kp were performed on n = 3 batches of SnCs. Experiments in i and j were performed on n = 4 independent experiments. Experiments in d and f are representative of n = 9 mice. Experiment in e was performed on n = 10 independent experiments. *P < 0.05, **P < 0.01 and ***P < 0.001; two-tailed Mann–Whitney U-test. Source data
Fig. 4
Fig. 4. GD3 expression by SnCs directly determines their NK-cell-mediated immune surveillance.
a, Flow cytometry analysis of the binding of soluble recombinant Siglec-7-Fc proteins by pdl30 or replicative senescent MRC5 cells with or without neuraminidase treatment. b, Degranulation (CD107a+) of NK cells in in vitro co-culture experiments with pdl30 or replicative senescent MRC5 cells treated or not with neuraminidase. c, Degranulation of NK cells in in vitro co-culture with young cells overexpressing ST8SIA1 and treated or not with neuraminidase. d,e, Quantification of mouse (d) or human (e) NK cell degranulation in co-culture experiment with young or senescent MRC5 cells with an anti-GD3 antibody. f, Representative scheme of the in vitro cancer cell challenge assay. g, Determination of NK cell functionality in vitro after 18 h of co-culture with senescent cells and 4-h YAC-1 cell rechallenge. Data represent the mean of n = 4 independent experiments (b–d). Experiment in e was performed on n = 3 independent experiments. Experiment in g was performed with n = 8 mice per group. *P < 0.05, **P < 0.01 and ***P < 0.001; two-tailed Mann–Whitney U-test. Source data
Fig. 5
Fig. 5. GD3+ SnCs present, accumulate and persist in experimental models of senescence-associated diseases and inhibit NK cell functionality.
a,b, H&E or picosirius red staining (in white or polarized light) in bleomycin-induced lung fibrosis sections (a) and quantification of collagen deposit (sirius red staining; b) (scale, 100 μm). c, SA-β-Gal assay and GD3 expression analysis (b) corresponding to fibrotic lungs used in Fig. 7a–d (scale, 100 μm). d,e, Determination of the intrapulmonary (d) and splenic (e) NK cell functionality ex vivo from control or bleomycin-instilled mice against YAC-1 cells after 4 h of rechallenge. f,g, Histology analysis, quantification of collagen deposit (sirius red staining in white or polarized light) and GD3 expression in mean intensity fluorescence (MFI) in fibrotic lungs over time (f) and their quantification (g) (scale, 100 μm). hj, Livers of mice fed with Western or control diets stained with picrosirius red (in white or polarized light) and labeled for p21 in IHC or GD3 in IF (h), their histological quantification (i) and mRNA quantification by qPCR (j). k, Pearson coefficient correlation analysis for GD3, p21 and collagen fibers (left panel) and their corresponding gene expressions (right panel). l, SA-β-Gal assay and GD3 expression analysis in ADR-induced kidney fibrosis. m, GD3 expression in kidney glomeruli from ADR-treated or control (NaCl) mice. n, Quantification of the percentage of kidney area (left panel) or the glomerular area (right panel) covered by GD3+ signal in ADR-treated or control (NaCl) kidney (scale, 10 μm). Experiments in ag were performed with n = 8 mice per group. Experiments in h and k were performed on n = 5 mice in the control group and on n = 6 mice in the Western diet group. Experiements in i and j were performed on n = 10 mice in the control group and on n = 12 mice in the Western diet group. Experiments in ln were performed with n = 4 mice per group or at least 461 glomeruli. *P < 0.05, **P < 0.01, ***P < 0.001 and ****P < 0.0001. bg,n, Two-tailed Mann–Whitney U-test. i,j, Two-tailed unpaired t-test. k, Pearson correlation. d, day. Source data
Fig. 6
Fig. 6. GD3 is a senescence-associated surface marker in bleomycin-induced fibrotic lungs.
a, Quantification by flow cytometry of the frequency of SA-β-Gal+/− cells and GD3+/− cells in fibrosis-bearing lungs. bd, Volcano plot (b), heatmap of DEGs (c) and KEGG pathway analysis (d) between sorted GD3+SA-β-Gal and GD3+SA-β-Gal+ cells in bulk RNA-seq. Important senescence pathways or genes are highlighted or pinpointed in yellow. e,f, Senescence ssGSEA (e) and deconvolution analysis (f) of the GD3+/− and SA-β-Gal+/− sorted fractions. g, Characterization by ImageStreamX of senescent cells using SA-β-Gal assay, GD3, EPCAM and CD45 staining. Experiments were performed with n = 4 mice per group. *P < 0.05, two-tailed Mann–Whitney U-test. Source data
Fig. 7
Fig. 7. GD3 targeting in vivo increases overall mouse survival and reduces senescence-associated diseases by locally restoring NK-cell-mediated immunosurveillance.
a, Representative scheme of in vivo anti-GD3 mAb treatment in lung fibrosis model. b, Overall survival analysis of fibrotic mice (n = 48 in control group and n = 45 in anti-GD3 group). c, Evaluation of the fibrosis over time by quantification of collagen fibers using picosiruis red staining (n = 5 mice per group and per timepoint; data represent the mean ± s.e.m.). d, Quantification by flow cytometry of SA-β-Gal+ cells infiltrating lungs at d27. e, Evaluation by flow cytometry of intrapulmonary NK cell functionality at d27. f, Evaluation of lung fibrosis by μCT imaging (d14 and d27) and picosiruis red staining (d27) (d14 and d27 µCT and picrosirius red images representing the same mouse over time for each group) (scale, 100 μm). g,h, Quantification of the mean fluorescence intensity in function of number of nuclei (MFI/nb) of GD3 by IF (g) and the percentage of p16+ cells by IHC over time (h). i, Representative scheme of the in vivo aging experiment. j, Evaluation of age-related lung fibrosis by collagen quantification using picosirius red staining (n = 5 mice per group) (scale, 100 μm). k, Quantification of the MFI/nb of GD3 by IF in the lungs (n = 5 mice per group). l, Evaluation of age-related liver fibrosis by collagen quantification using picosirius red staining (n = 5 mice per group) (scale, 100 μm). mp, μCT high-resolution imaging (m) and quantification of the bone volume (n), thickness (o) and ratio between bone surface and volume (p) of the bone structure of the knees of the mice treated with isotype of anti-GD3 (n = 5 mice, 10 legs per group). All bleomycin-induced fibrosis experiments were performed with n = 8 mice per group. *P < 0.05, **P < 0.01 and ***P < 0.001; two-tailed Mann–Whitney U-test (ap). d, day; m/o, months old. Source data
Extended Data Fig. 1
Extended Data Fig. 1. Characterization of MRC5 replicative senescent cells.
a, Growth curve of the MRC5 cells until replicative senescence. pdl. Population doubling level. b, c, SA-b-Galactosidase and EdU incorporation assay on pdl30 or replicative senescent MRC5 (b) and on irradiated MEF (c) (Upper scale = 200μm, lower scale 20μm) (left panel) and quantification of the percentage of SA-b-Galactosidase + and EdU – cells (right panels). d-f, Analysis of the SA-b-Galactosidase assay, DNA damage level (53BP1 staining) (d, e) or DNA damage level (53BP1 staining) specifically at telomeres (telomere staining (PNA-Telo) and colocalization (TIF for Telomere Induced Foci)) (e, f) on pdl30 or replicative senescent MRC5 using ImagestreamX and quantification of the number of total 53BP1 foci or 53BP1 foci at telomere (TIF). Due to the SA-b-Galactosidase staining, cells are darker, and the Mean pixel intensity is decreasing (d). g, qPCR analysis of CDKN2A (left panel) and CDKN1A (right panel) expression in replicative senescence in MRC5 cells. h, Senescence-related gene set enrichement analysis (GSEA) on SenMayo, Friedman and Senescence Associated Secretory Phenotype gene sets of replicative senescent MRC5. i, Heatmap of senescent markers of replicative senescent MRC5 compared to pdl30 cells sequenced in bulk RNAseq (upper panel) of irradiated MEF compared to pdl3 cells quantified by qPCR (lower panel). j, Heatmap of soluble factors expressed by replicative senescent MRC5 compared to pdl30 cells sequenced in bulk RNAseq. Data are representative of 8 different batches of replicative senescent cells corresponding to the batches used in Figs. 1 and 2. Data are represented as mean ± s.e.m. Experiment done on n = 4 independent experiments (d); Experiment done on n = 2 independent experiments (e, f); Experiment done on n = 3 senescent batches (g-j);*p < 0.05, **p < 0.01, and ***p < 0.001; two-tailed Mann–Whitney U test (d,f). Source data
Extended Data Fig. 2
Extended Data Fig. 2. Senescent cells but not their SASP affect immune infiltration and NK cell activation.
a, Gating strategy for the immune phenotyping of infiltrating cells from the Matrigel plug assay (Fig. 1a-b). b, Quantification of the immune cell infiltration induced by proliferative, oncogene or different stress-induced senescent MRC5 cells (left panel) or supernatant (right panel) in matrigel plugs. c-d, Quantification of the NK cell infiltration (c) and degranulation (d) induced by the supernatant from proliferative, replicative senescent, oncogene or stress induced MRC5 cells in matrigel plugs. e, Quantification of in vitro migration of primary human NK cells in presence of supernatant from pdl30 or bleomycin induced senescent MRC5 during transwell assays. f, Positive (YAC-1 cells, a strong NK cell target) and negative controls of degranulation (CD107a+ NK cells) or IFN-g production in in vitro co-culture experiments. g, Analysis of IFN- g production in in vitro co-culture experiments with senescent cells. All experiments are performed with n = 9 mice per group (a-d); *p < 0.05, **p < 0.01, and ***p < 0.001; Data are represented as mean ± s.e.m.; two-tailed Mann–Whitney U test or data represent the mean of n = 3 independent experiments; *p < 0.05, **p < 0.01, and ***p < 0.001; two-tailed Mann–Whitney U test (e, f). Source data
Extended Data Fig. 3
Extended Data Fig. 3. Mass spectrometry analysis of human replicative senescent cells for O-glycans and N-Glycans.
a, scheme representing the analysis strategy. b, c, Representative data of the O-glycan composition of pdl30 (young) MRC5 (b) or replicative senescent MRC5 (c). c, d, d, e, Representative data of the N-glycan composition of pdl30 (young) MRC5 (c)(d) or replicative senescent MRC5 (d)(e).
Extended Data Fig. 4
Extended Data Fig. 4. GD3 producing ST8SIA1 enzyme in expressed by Replicative and Stress induced senescent cells but not by Oncogene-induced senescent cells.
a, Quantification of GD3 expression analysis by flow cytometry of MRC5 cells (corresponding to Fig. 2b) or MEF cells. b, Growth curve of MRC5 and kinetic of ST8SIA1 expression by qPCR during replicative senescence. c, GD3 dosage by ELISA in supernatants of proliferating or replicative senescent cells (2 independent experiments). d, Western blot quantification of ST8SIA1 in different types of senescence. e, Morphology analysis of HMEC cells overexpressing Hras in an inducible manner (representative of n > 5 experiments) (Scale =100μm). f, SA-b-Galactosidase assay, and quantification for HMEC and MRC5 cells overexpressing Hras in an inducible manner. g, h, qPCR assessment of ST8SIA1 expression in HMEC overexpressing Hras senescent cells or Bleomycin induced HMEC senescent cells (g) or WI38 cells in replicative senescent or RasV12 induced senescence (h). i, SA-b-Galactosidase assay and GD3 immunofluorescence staining on paraffin embedded lung section from control or 2 months-induced KrasG12D overexpression mice. j, Analysis of GD3 expression in lungs of KrasG12D overexpression mice overtime. i, j are representative of n = 2 mice per condition (Scale =100μm). Data are represented as mean ± s.e.m. The experiments were performed on n = 3 (a left, f, g, h). The experiment was performed on n = 1 (a right, d). Source data
Extended Data Fig. 5
Extended Data Fig. 5. The expression of a sialylated GD3 is strictly required for inhibition of NK cell degranulation by senescent cells.
a, analysis by qPCR of ST8SIA1 expression in replicative senescent after lentiviral infection for shRNA targeting ST8SIA1. b, Quantification of the percentage of SA-b-Galactosidase positive and EdU negative cells after ST8SIA1 knock-down. c, Flow cytometry analysis of GD3 expression in replicative senescent after lentiviral infection for shRNA targeting ST8SIA1. d, in vitro degranulation of NK cells after a co-culture experiment using replicative senescent cells knocked down for ST8SIA1. f, g, Cytometry analysis of GD3 expression (e) and qPCR expression of ST8SIA1 (f) by pdl30 MRC5 overexpressing or not ST8SIA1. g, Quantification of the percentage of SA-b-Galactosidase positive and EdU negative cells after ST8SIA1 overexpression. h, degranulation (CD107a + ; left panel) or IFN-g production (right panel) by NK cells in in vitro co-culture experiments using pdl30 MRC5 overexpressing ST8SIA1. i, IFN-g production by NK cells in in vitro co-culture experiments with pdl30 or replicative senescent MRC5 cells treated or not with neuraminidase. j, Analysis of the immune infiltration by flow cytometry of control or fibrotic lungs used in Fig. 7a-d. Experiment done on n = 1 (a). Data represent the mean of n = 4 independent experiments (b-d); Data represent the mean ± s.e.m of n = 3 independent experiments (f,g); Experiment done on n > 4 (i). Data represented as mean ± s.e.m of n = 5 mice (j) *p < 0.05, **p < 0.01, and ***p < 0.001; two-tailed Mann–Whitney U test. Source data
Extended Data Fig. 6
Extended Data Fig. 6. mAb against GD3 restore efficient NK cell degranulation and killing of senescent cells.
a, Dose response effect of GD3 mAb on NK cell degranulation against replicative senescent or pdl30 MRC5 (data corresponding to Fig. 3e). b, IFN-g production in in vitro co-culture experiments using anti-GD3 monoclonal antibody (corresponding to Fig. 3e). c, d, degranulation (c, CD107a+ NK cells) or (d) IFN- g production in in vitro co-culture experiments using isotypic mouse IgG3 antibody as control as same concentration than anti-GD3 mAb. e, in vitro killing assay of pdl30 MRC5 or replicative senescent MRC5 by human NK cells in presence or not of anti-GD3 mAb; performed in same time than experiment in Fig. 1f, same controls. f, Gating for the quantification of human NK cell degranulation in co-culture asssays performed in Fig. 2j. Data represent the mean of n > 3 independent experiments; *p < 0.05, **p < 0.01, and ***p < 0.001; two-tailed Mann–Whitney U test. Source data
Extended Data Fig. 7
Extended Data Fig. 7. The proportion of GD3 positive senescent cells increases in murine fibrotic lungs and can be sorted by FACS.
a, Gating strategy for the sorting of the sequenced fractions analyzed in Fig. 6. b-d, Position of the sorting gates for the unlabeled fraction (b), a fibrotic lung (c) and a normal lung (d). e, Proportion of the different fractions analyzed by flow cytometry for normal and fibrotic murine lungs for n = 4 animals, data represent the mean ± s.e.m. f, Post sort quality control of the sorting of the different fractions. g, Deconvolution analysis of the GD3 + /- and SA-β-Gal + /- sorted fractions. Experiments are performed with n = 4 mice per group; *p < 0.05, two-tailed Mann–Whitney U test. Source data
Extended Data Fig. 8
Extended Data Fig. 8. Anti GD3 targeting in vivo restore NK cell functionality locally in vivo and ex vivo.
a, Lung weight at d27 after instillation with Bleomycin in function of the treatment with the anti-GD3 antibody. b, Analysis of the immune infiltration in the lungs by flow cytometry of isotypic control or anti GD3 mAb treated fibrotic mice used in Fig. 7a-h. c, Evaluation by flow cytometry of the percentage of CD69+ activated intrapulmonary NK cells at d27; data corresponding to Fig. 7e. d, Density plot for the quantification of NK degranulation corresponding to the Fig. 4e. e, Determination of the quantity of NK cells within the lung of fibrotic mice depending on the treatment. f, Determination of the intrapulmonary NK cell functionality ex vivo from treated or control mice against YAC-1 cells after 4 hours of rechallenge. g, Determination of the quantity of NK cells within the spleen of fibrotic mice depending on the treatment. h, Determination of the NK cell functionality ex vivo from the spleen of treated or control mice against YAC-1 cells after 4 hours of rechallenge. i, j, NK cell functionality after 24 hours of culture without MRC5 (controls data corresponding to Fig. 2). Experiment done on n > 6 mice (a-h); Experiment done on n = 3 experiment (a-h). *p < 0.05, **p < 0.01, and ***p < 0.001; two-tailed Mann–Whitney U test. Source data
Extended Data Fig. 9
Extended Data Fig. 9. GD3 is not secreted in the serum of old mice but is strongly increased by senescent cells found in natural Age-associated kidney and lung fibrosis.
a, GD3 dosage by ELISA in serum of 3 months or 24 months-old mice (right panel, 8 to 9 mice per group). b, GD3 expression in kidney glomeruli from 6-months or 20-months old mice. (Scale =10μm) c, Quantification of the percentage of kidney area (left panel) or the glomerular area (right panel) covered by GD3 + signal in 6-months or 20-months old kidney. d, H&E, Sirius Red (in white and polarized light) and GD3 immunofluorescence staining in young (3 months), old (24 months) and telomerase KO mice in G0 and G4 (11 months) (Scale =100μm). e,f, Quantification of collagen deposition (e) and GD3 expression in lungs (f). g, Correlation between collagen fibers quantity and GD3 expression in aged mice. Data represent the Pearson uncentred correlation. h, i, Analysis of the knee’s cartilage (h) and bone (i) thickness, volume, and ratio surface/volume (S/V) between isotype and anti-GD3 (n = 5 mice, 10 legs per group), p-values calculated by two-tailed Mann-Whitney test. a-c experiments are performed with n = 4 mice per group or at least 461 glomeruli; *p < 0.05, **p < 0.01, and ***p < 0.001; Mann–Whitney U test. d-f experiments are performed with n = 8 mice per group. *p < 0.05, **p < 0.01, and ***p < 0.001; two-tailed Mann–Whitney U test. Source data
Extended Data Fig. 10
Extended Data Fig. 10. ST8SIA1 and GD3 expression increases with age and fibrosis in human lung and correlates with the expression of senescence markers upon aging.
a, b, Analysis of gene expression by RNAseq of normal human lung samples from different ages. Data are extracted from GTEX consortium and the relative gene expression (transcript per million or TPM) is represented in function of the group of age for senescence associated genes (a) or fibrosis associated genes (b). Data represent the mean ± s.e.m of n = 427 patients. *p < 0.05, **p < 0.01, and ***p < 0.001; two-way Anova test. c-f, Gene expression correlation (in TPM) between ST8SIA1 and CDKN2A or CDKN1 gene expression (c); ST8SIA1 and FN1 or LOX (d); CDKN2A and FN1 or LOX (e); or CDKN1 and FN1 or LOX (f). Data represent the Pearson uncentred correlation *p < 0.05, **p < 0.01, ***p < 0.001 and ****p < 0.0001. g, Picrosirius red staining (in white or polarized light), p16, p21 and GD3 labeling in IHC in pulmonary interstitial fibrosis and normal samples (commercial tissue microarray TMA from USBiomax). Data representative of n = 52 patients. (Scale =200μm). h, Pearson correlation matrix between histological quantification of p16, p21and GD3 (n = 52). Pearson correlation *p < 0.05, **p < 0.01, ***p < 0.001 and ****p < 0.0001. Source data

References

    1. Campisi, J. Aging, cellular senescence, and cancer. Annu. Rev. Physiol.75, 685–705 (2013). - PMC - PubMed
    1. Kennedy, B. K. et al. Geroscience: linking aging to chronic disease. Cell159, 709–713 (2014). - PMC - PubMed
    1. Yosef, R. et al. Directed elimination of senescent cells by inhibition of BCL-W and BCL-XL. Nat. Commun.7, 11190 (2016). - PMC - PubMed
    1. Chang, J. et al. Clearance of senescent cells by ABT263 rejuvenates aged hematopoietic stem cells in mice. Nat. Med.22, 78–83 (2016). - PMC - PubMed
    1. Amor, C. et al. Senolytic CAR T cells reverse senescence-associated pathologies. Nature583, 127–132 (2020). - PMC - PubMed

LinkOut - more resources