. 2024 Dec 28;7(1):1707.
doi: 10.1038/s42003-024-07430-9.

Dexmedetomidine accelerates photoentrainment and affects sleep structure through the activation of SCNVIP neurons

Affiliations

Dexmedetomidine accelerates photoentrainment and affects sleep structure through the activation of SCNVIP neurons

Ying Zhang et al. Commun Biol. .

Abstract

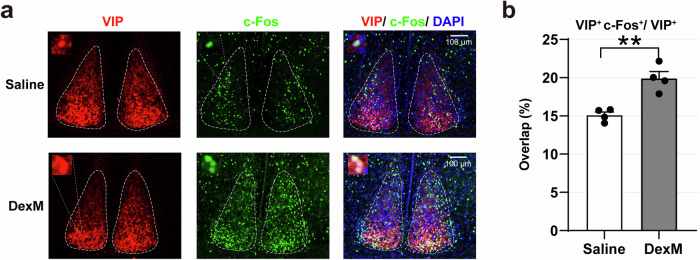
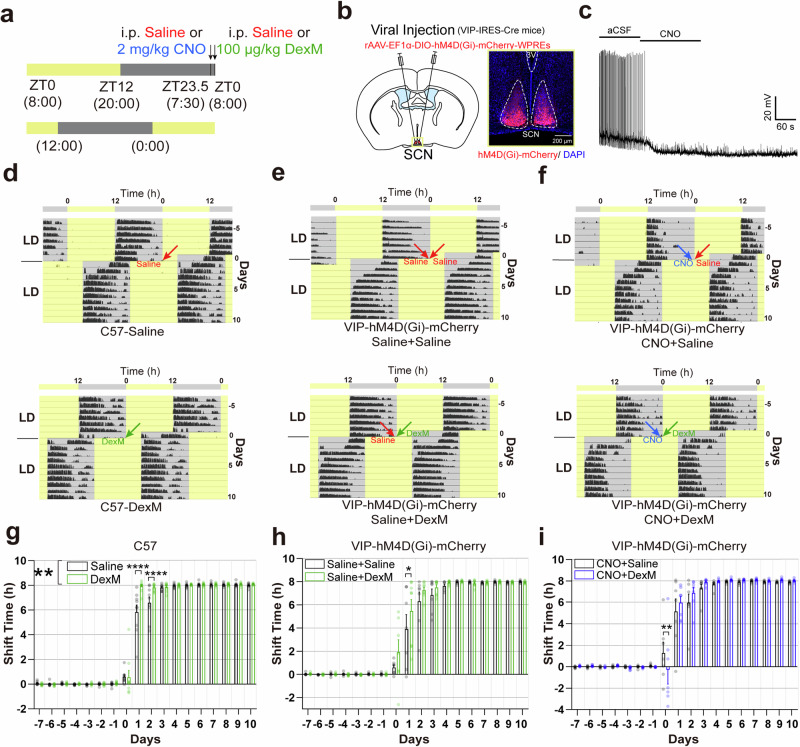
Dexmedetomidine (DexM), a highly selective α2-adrenoceptor agonist, significantly reduces postoperative adverse effects, including sleep and circadian rhythm disruptions. Vasoactive intestinal peptide neurons in the suprachiasmatic nucleus (SCNVIP) regulate the synchronization of circadian rhythms with the external environment in mammals. We investigate the effects of DexM on sleep and circadian rhythms, as well as the underlying mechanisms. Using electrophysiological and chemogenetic methods, along with locomotor activity and electroencephalogram/electromyogram recordings, we found that DexM accelerates the rate of re-entrainment following an 8-hour phase advance in the 12-hour light:12-hour dark cycle, increases the amount of non-rapid eye movement sleep, and decreases the mean duration of rapid eye movement sleep. Chemogenetic inhibition of SCNVIP neurons hinders the acceleration of re-entrainment and the changes in the sleep-wakefulness cycle induced by DexM. Electrophysiological results show that DexM increases the firing rate and the frequency of spontaneous glutamatergic postsynaptic currents while decreasing the frequency of spontaneous GABAergic PSCs in SCNVIP neurons through the α2-adrenergic receptor. Additionally, DexM reduces the frequency of miniature GABAergic PSCs in SCNVIP neurons. In conclusion, these findings suggest that DexM promotes sleep and maintains the coordination of circadian rhythms with the external environment by activating SCNVIP neurons through the α2-adrenoceptor.


Conflict of interest statement

Competing interests: The authors declare no competing interests.

Figures

Fig. 1
Fig. 1. DexM increased c-Fos expression in SCNVIP neurons.
a Representative multiple staining photomicrographs showing c-Fos expression (green), VIP-positive neurons (red), and cell nuclei stained with DAPI (blue) in the SCN of mice treated with saline (top) and 100 μg/kg DexM (bottom) (scale bar:100 μm). b Histogram showing the proportion of co-labeled c-Fos and VIP-positive neurons in the SCN of mice treated with saline or DexM. (unpaired Student’s t-test: **P = 0.0026; N = 4 mice). Data are represented as mean ± SEM.
Fig. 2
Fig. 2. DexM accelerates the rate of re-entrainment following an 8-h phase advance in the LD cycle.
a Experimental timeline for saline/ CNO/ DexM injection and LMA recording. b Schematic showing viral transduction (left) and histological image showing the expression of rAAV-EF1a-DIO-hM4D(Gi)-mCherry-WPREs (right) in the SCN (scale bar: 200 μm). c CNO inhibition was verified through whole-cell recording of hM4D(Gi)-mCherry-expressing SCNVIP neurons in acute brain slices (horizontal bar: 60 s; vertical bar: 20 mV). df Representative double-plotted actograms (yellow and gray backgrounds represent light and dark periods, respectively) of C57 mice or VIP-hM4D(Gi)-mCherry mice. d graph representing the saline group (upper) and the DexM group (lower) of C57 mice (e) graph representing the saline+saline group (upper) and the saline+ DexM group (lower) of VIP-hM4D(Gi)-mCherry mice (f) graph representing the CNO+Saline group (upper) and the CNO+DexM group (lower) of VIP-hM4D(Gi)-mCherry mice. Red arrows indicate saline injection (i.p.). Green arrows indicate DexM injection (100 μg/kg, i.p.). Blue arrows indicate CNO injection (2 mg/kg, i.p.). g C57 mice in the DexM group (green) showed different re-entrainment speeds to the 8 h-advanced light cycle, compared to the saline group (black). (Data were analyzed using two-way repeated-measures ANOVA (F (1,8) = 17.50, **P = 0.0031 < 0.01) and Bonferroni’s multiple comparisons test (****P (Day1) < 0.0001; ****P (Day2) < 0.0001); N = 9 mice). h VIP-hM4D(Gi)-mCherry mice in the saline+ DexM group (green) exhibited accelerated re-entrainment rates following an 8-h phase advance compared to the saline+saline group (black) on Day 1. (Data were analyzed using mixed-model ANOVA (F (1,7) = 4.213, P = 0.0792) and Bonferroni’s multiple comparisons test (*P (Day1) = 0.0199); N = 7-8 mice). i VIP-hM4D(Gi)-mCherry mice in the CNO+DexM group (blue) exhibited delayed re-entrainment on Day 0 compared to the CNO+saline group (black). (Data were analyzed using two-way repeated-measures ANOVA (F (1,6) = 0.4891, P = 0.5105) and Bonferroni’s multiple comparisons test (**P (Day0) = 0.0067); N = 7 mice). Data are represented as mean ± SEM.
Fig. 3
Fig. 3. Cannula injection of DexM into the SCN increases the amount of NREM sleep in mice.
a Schematic diagram (left) and histological image (right) (scale bar: 200 μm) of the SCN with implanted guides and internal cannulas. b Schematic diagram of EEG/EMG electrode implantation. c Experimental timeline for saline or DexM injection and EEG/EMG recording. d, e EEG power spectrogram, EMG trace, and brain states of VIP-hM4D(Gi)-mCherry mice in saline and DexM groups. f–h Percentage of time in wakefulness (f), NREM sleep (g), and REM sleep (h) states in VIP-hM4D(Gi)-mCherry mice. f Data analyzed using two-way repeated-measures ANOVA (F(1, 4) = 33.44, **P = 0.0044) and Bonferroni’s multiple comparisons tests (**P (ZT15) = 0.0075; *P (ZT17) = 0.0351); N = 3-5 mice). g data analyzed using two-way repeated-measures ANOVA (F(1,4) = 19.64, *P = 0.0114) and Bonferroni’s multiple comparisons tests (**P (ZT15) = 0.0050;*P (ZT17) = 0.0480); N = 3-5 mice). h Data analyzed using two-way repeated-measures ANOVA ((F (1,4) = 1.369, P = 0.3069); N = 3-5 mice). i EEG PSD of the saline group (black) and the DexM group (blue). a: 4 Hz, b: 8 Hz, c: 13 Hz. (Data analyzed using two-way repeated-measures ANOVA (F(1, 4) = 3.142, P = 0.1510) and Bonferroni’s multiple comparisons test (**P (3.9Hz) = 0.00301; ***P (4.0-4.6Hz) < 0.0001; ***P (4.7Hz) = 0.002; *P (4.8Hz) = 0.0174; N = 5 mice). j Mean duration of wakefulness, NREM, and REM sleep over 5 h. (Data analyzed using paired Student’s t-test: P (wakefulness) = 0.0960; P (NREM) = 0.3521; *P (REM) = 0.0438; N = 5 mice). k Number of transitions between wakefulness, NREM sleep, and REM sleep states over 5 h. (Data analyzed using paired Student’s t-test: P (wakefulness to NREM) = 0.1030; P (NREM to wakefulness) = 0.1239; P (NREM to REM) = 0.0539; P (REM to wakefulness) = 0.1926; Wilcoxon matched-pairs signed rank test: P (REM to NREM) = 0.1250; N = 5 mice). Data are represented as mean ± SEM.
Fig. 4
Fig. 4. Chemogenetic inhibition of SCNVIP neurons counteracts the sleep differences caused by DexM.
a Experimental timeline for saline/ CNO/ DexM injection and EEG/EMG recording. b, c EEG power spectrograms, EMG traces, and sleep-wakefulness states of VIP-hM4D(Gi)-mCherry mice in the CNO+saline and CNO+ DexM groups. df Time-course changes in wakefulness (d), NREM (e), and REM (f) states in VIP-hM4D(Gi)-mCherry mice. (Data analyzed using two-way repeated-measures ANOVA; d F (1,2) = 0.04975, P = 0.8442; N = 3 mice; (e) F (1,2) = 0.04474, P = 0.8521; N = 3 mice; f F (1,2) = 0.2948, P = 0.6416; N = 3 mice). g EEG PSD of the CNO+saline group (black) and CNO+ DexM group (blue). a: 4 Hz, b: 8 Hz, c: 13 Hz. (Data analyzed using two-way repeated-measures ANOVA (F(1, 2) = 0.2444, P = 0.6700) and Bonferroni’s multiple comparisons test (P (3.9-4.8 Hz) > 0.05); N = 3 mice). h Mean duration of wakefulness, NREM, and REM sleep over 5 h. (Data analyzed using paired Student’s t-test: P (wakefulness) = 0.5358; P (NREM) = 0.4118; P (REM) = 0.8498; N = 3 mice). i Number of transitions between wake, NREM sleep, and REM sleep states over 5 h. (Data analyzed using paired Student’s t-test: P (wakefulness to NREM) = 0.3590; P (NREM to wakefulness) = 0.3532; P (NREM to REM) = 0.5485; P (REM to wakefulness) = 0.4771; P (REM to NREM) > 0.9999; N = 3 mice). Data are represented as mean ± SEM.
Fig. 5
Fig. 5. DexM increases the frequency of AP and glutamatergic PSCs while decreasing the frequency of GABAergic PSCs in SCNVIP neurons.
a Images showing whole-cell recording with a patch pipette in the light transmission view, comparing the bright field and fluorescence of SCNVIP neurons. b Experimental procedure for electrophysiological experiments in the baseline and DexM groups. c Diagram describing electrophysiological characteristics of APs (horizontal bar: 5 ms; vertical bar: 20 mV). d Fitting of spike waveforms in baseline (black) and DexM (2 μM) (blue) groups (horizontal bar: 5 ms; vertical bar: 25 mV). e Representative graph of APs in baseline (black) and DexM (blue) groups. (horizontal bar: 1 s; vertical bar: 40 mV). f AP frequency increased in the DexM group compared to the baseline group (paired Student’s t-test: **P = 0.0020; N = 5 mice, n = 11 cells). g No differences were observed in APD50 between the baseline and DexM groups (paired Student’s t-test: P = 0.0785; N = 5 mice, n = 11 cells). h No differences were observed in AP amplitude between the baseline and DexM groups (paired Student’s t-test: P = 0.1009; N = 5 mice, n = 11 cells). i No differences were observed in the threshold between the baseline and DexM groups (Wilcoxon matched-pairs signed rank test: P = 0.3203; N = 5 mice, n = 11 cells). j No differences were observed in RMP between the baseline and DexM groups (paired Student’s t-test: P = 0.0635; N = 5 mice, n = 11 cells). k Representative graphs of glutamatergic PSCs in baseline (black) and DexM (blue) groups (upper: glutamatergic PSCs horizontal bar: 1 s, glutamatergic PSCs vertical bar: 10 pA; lower: glutamatergic PSCs horizontal bar: 10 ms, glutamatergic PSCs vertical bar: 10 pA). l Cumulative probability plot of the interevent interval of glutamatergic PSC (baseline group (black), DexM group (blue)). The frequency increased in the DexM group compared to the baseline group (paired Student’s t-test: ***P = 0.0009; N = 8 mice, n = 13 cells). m No differences were observed in the normalized probability and mean amplitude of glutamatergic PSCs between the baseline and DexM groups (paired Student’s t-test: P = 0.5485; N = 8 mice, n = 13 cells). n Representative graphs of GABAergic PSCs in baseline (black) and DexM (blue) groups (upper: GABAergic PSCs horizontal bar: 500 ms, GABAergic PSCs vertical bar: 40 pA; lower: GABAergic PSCs horizontal bar: 125 ms, GABAergic PSCs vertical bar: 40 pA). o Cumulative probability plot of the interevent interval of GABAergic PSCs (baseline group (black), DexM group (blue)). The frequency of GABAergic PSCs decreased in the DexM group compared to the baseline group (Wilcoxon matched-pairs signed rank test: *P = 0.0413; N = 7 mice, n = 15 cells). p No differences were observed in the normalized probability and mean amplitude of GABAergic PSCs between the baseline and DexM groups (paired Student’s t-test: P = 0.3886; N = 7 mice, n = 15 cells). Data are represented as mean ± SEM.
Fig. 6
Fig. 6. Blocking the α2-adrenergic receptor counteracted DEX-induced changes in SCNVIP neurons.
a The experimental procedure of electrophysiological experiments was conducted between the baseline and DexM + RS79948 groups. b Fitting of spike waveform of the baseline (black) and DexM + RS79948 (red) (horizontal bar: 5 ms; vertical bar: 25 mV). c Representative graph of AP between the baseline (black) and DEX + RS79948 (red) groups. (horizontal bar: 1 s; vertical bar: 40 mV). d Compared with the baseline group, AP frequency showed a decline in the DexM + RS79948 group (paired Student’s t-test: *P = 0.0227; N = 7 mice, n = 12 cells). e No differences were observed in the APD50 between the DexM and DexM + RS79948 groups (paired Student’s t-test: *P = 0.1382; N = 7 mice, n = 12 cells). f Compared with the baseline group, AP amplitude showed a decline in the DexM + RS79948 group (paired Student’s t-test: P = 0.0462; N = 7, n = 12 cells). g Compared with the baseline group, the AP threshold showed a decline in the DexM + RS79948 group (paired Student’s t- test: *P = 0.0151; N = 7 mice, n = 12 cells). h No differences were observed in the RMP between the DexM and DexM + RS79948 groups (paired Student’s t-test: P = 0.9252; N = 7 mice, n = 12 cells). i Representative graphs of glutamatergic PSCs between the baseline (black) and DexM (red) groups (upper: glutamatergic PSCs horizontal bar: 1 s, glutamatergic PSCs vertical bar: 10 pA; lower: glutamatergic PSCs horizontal bar: 10 ms, glutamatergic PSCs vertical bar: 10 pA). j Cumulative probability plot of the interevent interval of glutamatergic PSCs (baseline group (black), RS79948 + DexM group (red)). No differences were observed in the glutamatergic PSC frequency between the DexM and DexM + RS79948 groups (Wilcoxon matched-pairs signed rank test: P = 0.9658; N = 9 mice, n = 13 cells). k There was no significant change in the normalized probability and the mean amplitude of glutamatergic PSCs between the DexM and DexM + RS79948 groups (paired Student’s t-test: P = 0.5274; N = 7 mice, n = 13 cells). l Representative graphs of GABAergic PSCs between the baseline (black) and DexM + RS79948 (red) groups (upper: GABAergic PSCs horizontal bar: 500 ms, GABAergic PSCs vertical bar: 40 pA; lower: GABAergic PSCs horizontal bar: 125 ms, GABAergic PSCs vertical bar: 40 pA). m Cumulative probability plot of the interevent interval of GABAergic PSCs (baseline group (black), RS79948+ DexM group (red)). Compared with the baseline group, the frequency of GABAergic PSCs showed no significant change in DEX + RS79948 group (Wilcoxon matched-pairs signed rank test: P = 0.3894; N = 7 mice, n = 15 cells). n There was no significant change in the normalized probability and the mean amplitude of GABAergic PSCs between the DexM and DexM + RS79948 groups (paired Student’s t-test: P = 0.8852; N = 7 mice, n = 15 cells). Data are represented as mean ± SEM.
Fig. 7
Fig. 7. DexM decreased the frequency of GABAergic mPSCs in SCNVIP neurons.
a Representation graphs of glutamatergic mPSCs between the baseline (black) and DexM (green) groups (upper: glutamatergic mPSCs horizontal bar: 1 s, glutamatergic mPSCs vertical bar: 10 pA; lower: glutamatergic mPSCs horizontal bar: 10 ms, glutamatergic mPSCs vertical bar: 10 pA). b Cumulative probability plot of the interevent interval of glutamatergic mPSCs (baseline group (black), DexM group (green)). There were no significant differences in the frequency of glutamatergic mPSCs between the baseline and DexM groups (paired Student’s t-test: P = 0.8652; N = 7 mice, n = 11 cells). c There were no significant differences in the normalized probability and the mean amplitude of glutamatergic mPSCs between the baseline and DexM groups (paired Student’s t-test: P = 0.0597; N = 7 mice, n = 11 cells). d Representation graphs of GABAergic mPSCs between the baseline (black) and DexM (green) groups (upper: GABAergic mPSCs horizontal bar: 500 ms, GABAergic mPSCs vertical bar: 40 pA; lower: GABAergic mPSCs horizontal bar: 125 ms, GABAergic mPSCs vertical bar: 40 pA). e Cumulative probability plot of the interevent interval of GABAergic mPSCs (baseline group (black), DexM group (green)). Compared to the baseline group, the frequency of GABAergic mPSCs significantly declined in the DexM group (paired Student’s t-test: *P = 0.0225; N = 6 mice, n = 15 cells). f There were no significant differences in the normalized probability and the mean amplitude of GABAergic mPSCs between the baseline and DexM groups (paired Student’s t-test: P = 0.5582; N = 6 mice, n = 15 cells). g Schematic diagram summarizing the mechanism by which DexM affects sleep and rhythm. Data are represented as mean ± SEM.

Similar articles

References

    1. Song, Y. et al. Effects of general versus subarachnoid anaesthesia on circadian melatonin rhythm and postoperative delirium in elderly patients undergoing hip fracture surgery: A prospective cohort clinical trial. EBioMedicine70, 103490 (2021). - PMC - PubMed
    1. Mizuno, T. et al. Effects of general anesthesia on behavioral circadian rhythms and clock-gene expression in the suprachiasmatic nucleus in rats. Histochem. Cell Biol.158, 149–158 (2022). - PubMed
    1. Imai, R. et al. Desflurane anesthesia shifts the circadian rhythm phase depending on the time of day of anesthesia. Sci. Rep.10, 18273 (2020). - PMC - PubMed
    1. Gögenur, I., Bisgaard, T., Burgdorf, S., van Someren, E. & Rosenberg, J. Disturbances in the circadian pattern of activity and sleep after laparoscopic versus open abdominal surgery. Surg. Endosc.23, 1026–1031 (2009). - PubMed
    1. Ni, P. et al. Preoperative sleep disturbance exaggerates surgery-induced neuroinflammation and neuronal damage in aged mice. Mediators Inflamm.2019, 8301725 (2019). - PMC - PubMed

Substances

LinkOut - more resources