. 2024 Dec 27;7(1):1703.
doi: 10.1038/s42003-024-07417-6.

Identification of shared genetic etiology of cardiovascular and cerebrovascular diseases through common cardiometabolic risk factors

Affiliations

Identification of shared genetic etiology of cardiovascular and cerebrovascular diseases through common cardiometabolic risk factors

Kexin Ding et al. Commun Biol. .

Abstract

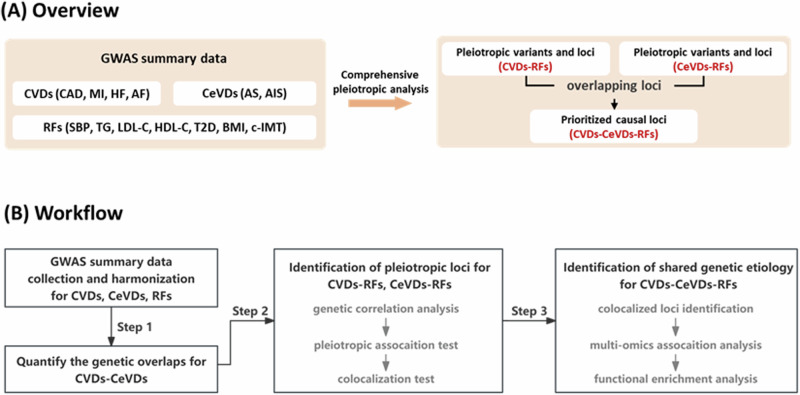
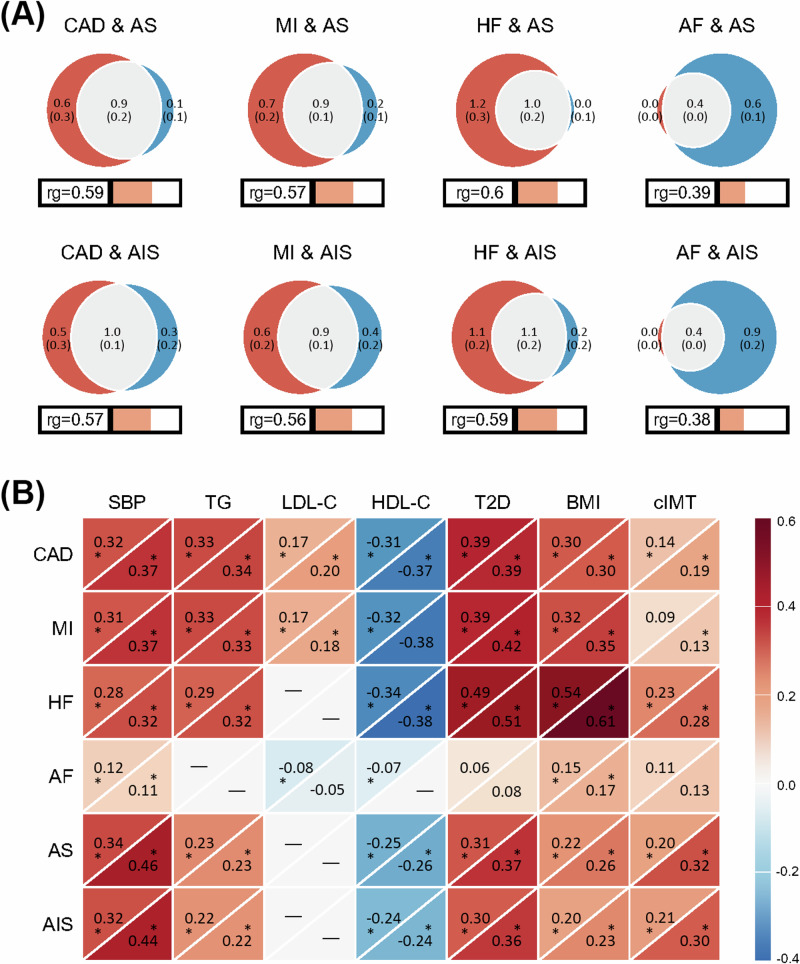
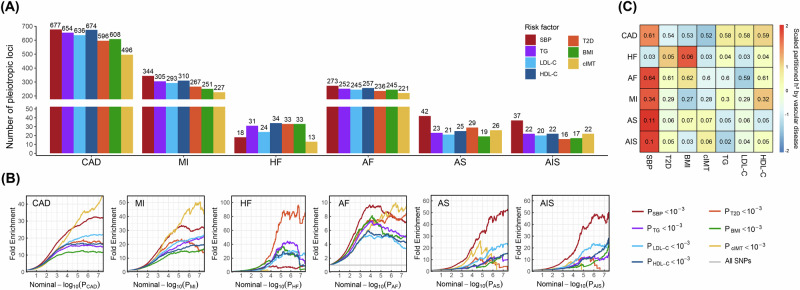
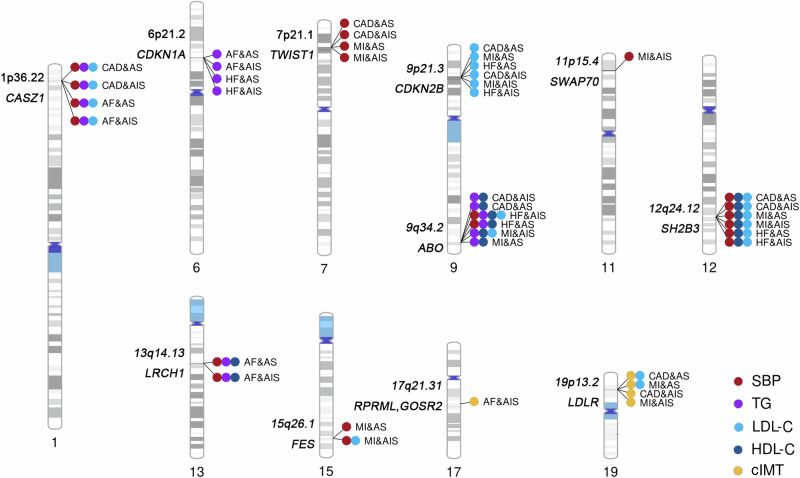
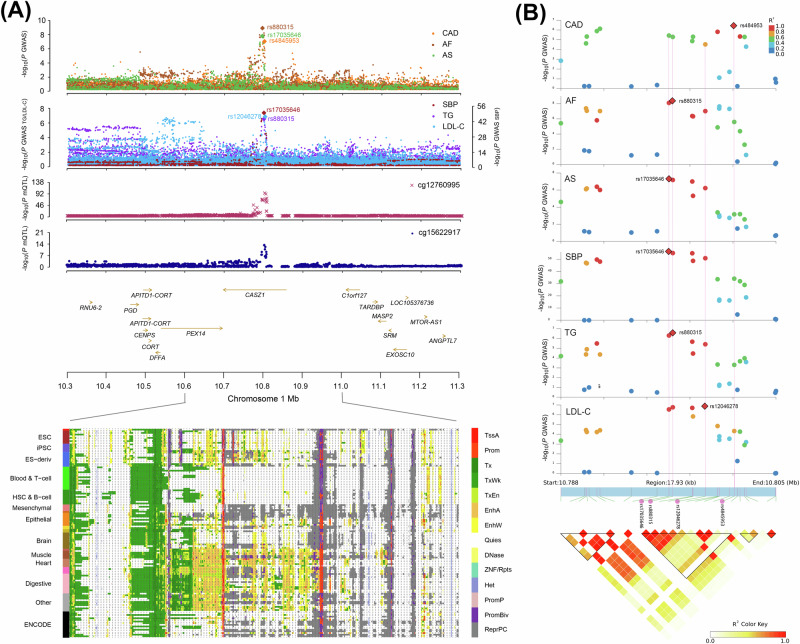
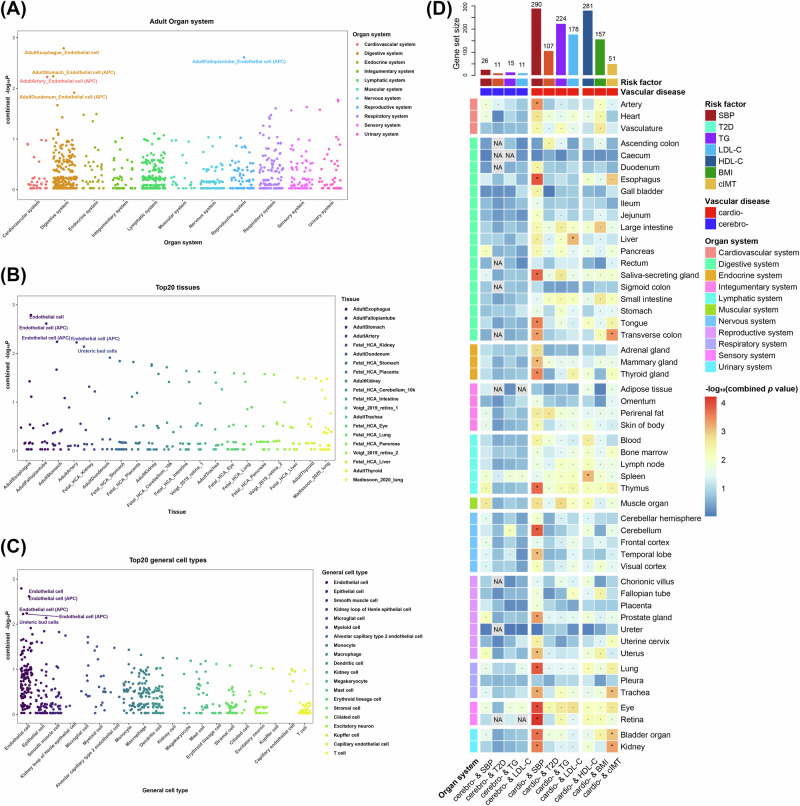
Cardiovascular diseases (CVDs) and cerebrovascular diseases (CeVDs) are closely related vascular diseases, sharing common cardiometabolic risk factors (RFs). Although pleiotropic genetic variants of these two diseases have been reported, their underlying pathological mechanisms are still unclear. Leveraging GWAS summary data and using genetic correlation, pleiotropic variants identification, and colocalization analyses, we identified 11 colocalized loci for CVDs-CeVDs-BP (blood pressure), CVDs-CeVDs-LIP (lipid traits), and CVDs-CeVDs-cIMT (carotid intima-media thickness) triplets. No shared causal loci were found for CVDs-CeVDs-T2D (type 2 diabetes) or CVDs-CeVDs-BMI (body mass index) triplets. The 11 loci were mapped to 12 genes, namely CASZ1, CDKN1A, TWIST1, CDKN2B, ABO, SWAP70, SH2B3, LRCH1, FES, GOSR2, RPRML, and LDLR, where both GOSR2 and RPRML were mapped to one locus. They were enriched in pathways related to cellular response to external stimulus and regulation of the phosphate metabolic process and were highly expressed in endothelial cells, epithelial cells, and smooth muscle cells. Multi-omics analysis revealed methylation of two genes (CASZ1 and LRCH1) may play a causal role in the genetic pleiotropy. Notably, these pleiotropic loci are highly enriched in the targets of antihypertensive drugs, which further emphasizes the role of the blood pressure regulation pathway in the shared etiology of CVDs and CeVDs.


Conflict of interest statement

Competing interests: The authors declare no competing interests.

Figures

Fig. 1
Fig. 1. Overview and workflow of the study design and analyses.
A The overview of the study design. B The workflow of the study analyses. CVDs cardiovascular diseases, CeVDs cerebrovascular diseases, RFs risk factors, CAD coronary artery disease, MI myocardial infarction, HF heart failure, AF atrial fibrillation, AIS all ischemic stroke, SBP systolic blood pressure, TG total triglyceride, LDL-C low-density lipoprotein cholesterol, HDL-C high-density lipoprotein cholesterol, T2D type 2 diabetes, BMI body mass index, cIMT carotid intima-media thickness.
Fig. 2
Fig. 2. Polygenic overlaps and genetic correlations among CVDs, CeVDs, and RFs.
A The Venn diagrams showed the shared (gray) and unique polygenic overlap between one specific CVD (red) and one specific CeVD (blue). The numbers in the Venn diagram represent the estimated quantity and standard error (in parenthesis) of shared and unique variants (in thousands). The size of the circles represents the degree of polygenicity. The bar under the Venn diagram represents the estimated genetic correlation (rg) (scaling from −1 to +1) between two traits. The orange bar on the right means the positive genetic correlation, otherwise, it means the negative correlation. All the results in the figure are based on MiXeR analysis. B The genetic correlations between CVDs or CeVDs (y-axis) and RFs (x-axis). Red indicates a positive genetic correlation, while blue represents a negative genetic correlation. The top left section of each square corresponds to the genetic correlation estimated using LDSC, while the bottom right section corresponds to the genetic correlation estimated using HDL. Genetic correlations that remain significant after Bonferroni correction (P < 0.05/21, where 21 = 6 × 7/2) are denoted by an asterisk (*). “−” indicates that no estimation was available from either LDSC or HDL. CVDs cardiovascular diseases, CeVDs cerebrovascular diseases, RFs risk factors, CAD coronary artery disease, MI myocardial infarction, HF heart failure, AF Atrial fibrillation, AIS all ischemic stroke, SBP systolic blood pressure, TG total triglyceride, LDL-C low-density lipoprotein cholesterol, HDL-C high-density lipoprotein cholesterol, T2D type 2 diabetes, BMI body mass index, cIMT carotid intima-media thickness, rg genetic correlation, LDSC method linkage disequilibrium score regression, HDL method high-definition likelihood.
Fig. 3
Fig. 3. Pleiotropy pattern between CVDs/CeVDs and RFs.
A Number of pleiotropic loci conditioning on different RFs for CVDs and CeVDs. B The fold-enrichment plot illustrates the enrichment of CVDs (CAD, MI, HF, and AF) and CeVDs (AS and AIS) based on their association with cardiometabolic RFs (SBP, TG, LDL-C, HDL-C, T2D, BMI, cIMT). The fold enrichment is represented as the ratio of the −log10(P) cumulative distribution of SNPs conditional on a specific P threshold of 0.001 in one RF to the cumulative distribution for all SNPs of that RF. C Partitioned heritability for CVDs and CeVDs from pleiotropic variants with RFs. The number in each square represents the partitioned heritability as calculated by the number of pleiotropic SNPs of one vascular disease and one RF combination divided by all SNPs of that vascular disease. Different colors represent the heritability after standardizing the heritability of different RFs in each vascular disease. The redder the color, the stronger the association between the risk factor and the disease. CVDs cardiovascular diseases, CeVDs cerebrovascular diseases, RFs risk factors, CAD coronary artery disease, MI myocardial infarction, HF heart failure, AF atrial fibrillation, AIS all ischemic stroke, SBP systolic blood pressure, TG total triglyceride, LDL-C low-density lipoprotein cholesterol, HDL-C high-density lipoprotein cholesterol, T2D type 2 diabetes, BMI body mass index, cIMT carotid intima-media thickness.
Fig. 4
Fig. 4. Map of colocalized loci on chromosomes for CVDs-CeVDs- RFs triplets.
The chromosome map illustrates the colocalized loci for CVDs-CeVDs-RFs triplets. The left part of each chromosome displays the loci name and the corresponding gene names, while the right part shows circles of various colors representing the different CVDs-CeVDs-RFs triplets when conditioned on a specific risk factor. CVDs and CeVDs combinations are linked using the symbol “&”. In cases where a locus is associated with CVDs and CeVDs conditioned on multiple RFs, multiple circles are observed in a single row. CVDs cardiovascular diseases, CeVDs cerebrovascular diseases, RFs risk factors, CAD coronary artery disease, MI myocardial infarction, HF heart failure, AF Atrial fibrillation, AIS all ischemic stroke, SBP systolic blood pressure, TG total triglyceride, LDL-C low-density lipoprotein cholesterol, HDL-C high-density lipoprotein cholesterol, T2D type 2 diabetes, BMI body mass index, cIMT carotid intima-media thickness.
Fig. 5
Fig. 5. The shared genetic etiology for CAD, AF, and AS conditioned on SBP, TG, and LDL-C at the CASZ1 locus.
A Prioritizing DNA methylation sites at the CASZ1 locus for CAD, AF, and AS conditioned on SBP, TG and LDL-C. The top two tracks show the −log10(P) of the GWAS SNPs for vascular diseases (CAD (in orange), AF (in red) and AS (in green)) and related risk factors (SBP (in red), TG (in purple), LDL-C (in blue)), respectively. The next two tracks show −log10(P) of SNP associations for DNA methylation sites (cg12760995 and cg15622917) with OPERA marginal PPA > 0.9 and P-HEIDI > 0.01 (see the “Methods” section). The subsequent track shows the gene name and size of the flanking region within 500 kb of the 10.8 MB on chromosome 1. The track on the bottom shows 14 chromatin state annotations inferred from the 127 Roadmap Epigenomics Mapping Consortium samples at the 10.6 Mb to 11.0 Mb position of chromosome 1. B LD pattern of GWAS SNPs for CAD, AF, AS, SBP, TG, and LDL-C at the CASZ1 locus. The top six tracks show the −log10(P) of the GWAS SNPs for vascular diseases (CAD, AF, and AS) and related risk factors (SBP, TG, LDL-C) within 10 kb of the 10.8 MB on chromosome 1. In each single track, the red diamond with a black border represents the index SNP with the most strongly association in the region, and dots of different colors represent different LD scores with the index SNP. The track on the bottom shows LD heatmap, and the triangles with black borders represent the identified blocks defined by Gabriel et al.. CAD coronary artery disease, AF Atrial fibrillation, SBP systolic blood pressure, TG total triglyceride, LDL-C low-density lipoprotein cholesterol.
Fig. 6
Fig. 6. Organ, tissue, and cell type enrichment for shared and distinct loci between CVDs and CeVDs.
AC Organ, tissue, and cell type enrichment for shared loci between CVDs and CeVDs based on all RFs, respectively. The y-axis in all three figures represents the -log (combined P value) which indicates the probability that the set of significantly expressed genes of a given size would have occurred by chance. The smaller the P value, the more likely that the pathway is significantly pathway identified. The x-axis represents different organs, tissues, and cell types in each figure, respectively. D Gene set size distribution and organ enrichment for pleiotropic loci shared by different CVDs or CeVDs and RFs combinations. The upper bar chart represents the number of gene sets shared by CVDs and RFs or CeVDs and RFs, in which different colors mean different CVDs or CeVDs and RFs combinations. In the lower chart, the left rectangles with different colors represent different organ systems, and each square with different colors from red to blue represents the −log (combined P value) of a certain CVDs/CeVDs-RFs combination in one specific organ system enrichment. Each column represents the enrichment of one specific CVDs-RFs or CeVDs-RFs combination, and each row represents the enrichment for different CVDs or CeVDs and RFs pairs in one specific organ system. CVDs cardiovascular diseases, CeVDs cerebrovascular diseases, RFs risk factors, CAD coronary artery disease, MI myocardial infarction, HF heart failure, AF atrial fibrillation, AIS all ischemic stroke, SBP systolic blood pressure, TG total triglyceride, LDL-C low-density lipoprotein cholesterol, HDL-C high-density lipoprotein cholesterol, T2D type 2 diabetes, BMI body mass index, cIMT carotid intima-media thickness.

Similar articles

References

    1. Organization, W. H. Cardiovascular Diseases (CVDs) Fact Sheethttps://www.who.int/health-topics/cardiovascular-diseases#tab=tab_1.
    1. Heart Research Institute, N. Cardiovascular Disease: Impacts and Riskshttps://www.hri.org.nz/health/learn/cardiovascular-disease/cardiovascula....
    1. Gallacher, K. I., Jani, B. D., Hanlon, P., Nicholl, B. I. & Mair, F. S. Multimorbidity in stroke. Stroke50, 1919–1926 (2019). - PubMed
    1. Buddeke, J. et al. Comorbidity in patients with cardiovascular disease in primary care: a cohort study with routine healthcare data. Br. J. Gen. Pract.69, e398–e406 (2019). - PMC - PubMed
    1. Aragam, K. G. et al. Discovery and systematic characterization of risk variants and genes for coronary artery disease in over a million participants. Nat. Genet.54, 1803–1815 (2022). - PMC - PubMed

MeSH terms

LinkOut - more resources