. 2024 Dec 28;14(1):31126.
doi: 10.1038/s41598-024-82383-x.

Phenological and morphological variations of Oryza rufipogon and O. nivara in Sri Lanka and their evolutionary implications

Affiliations

Phenological and morphological variations of Oryza rufipogon and O. nivara in Sri Lanka and their evolutionary implications

Salinda Sandamal et al. Sci Rep. .

Abstract

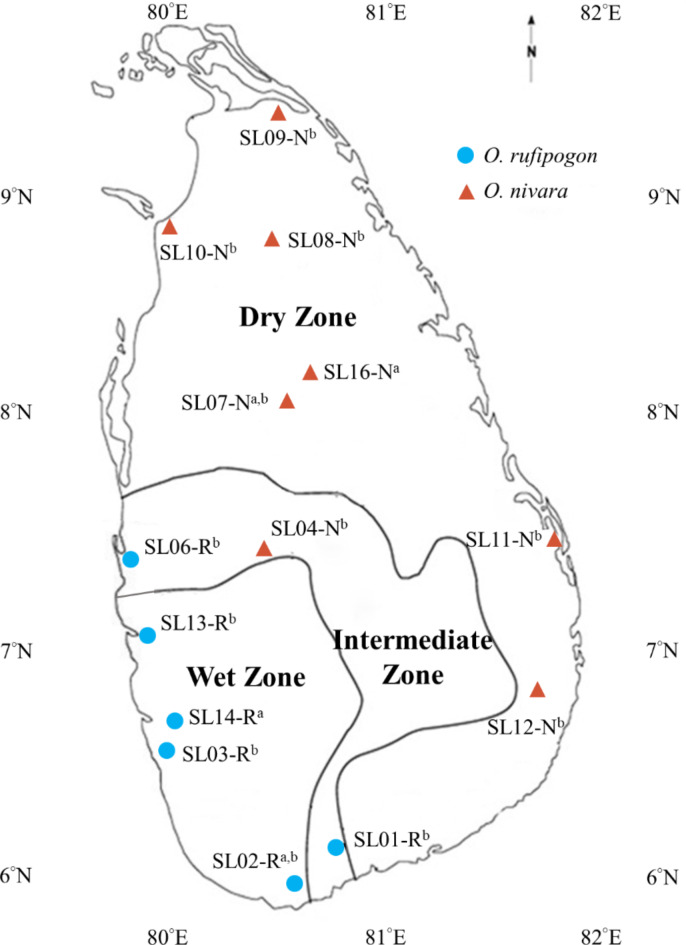
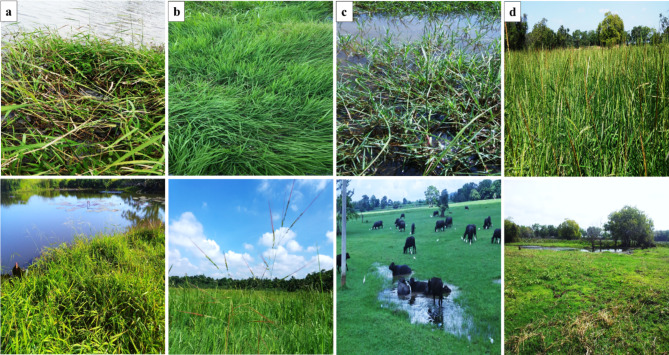
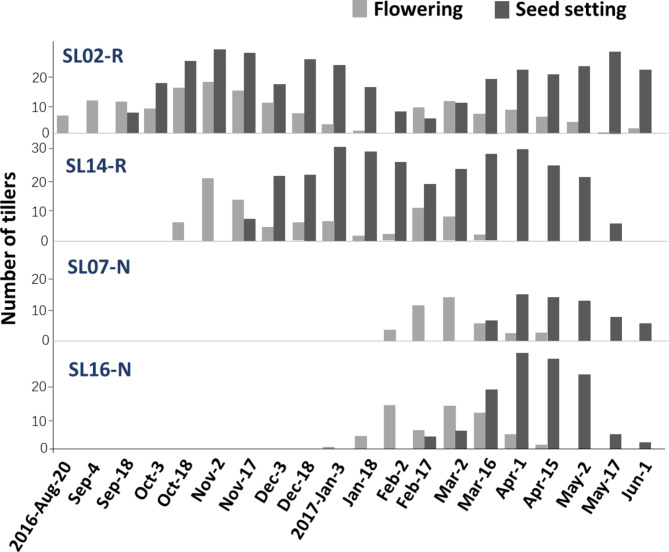
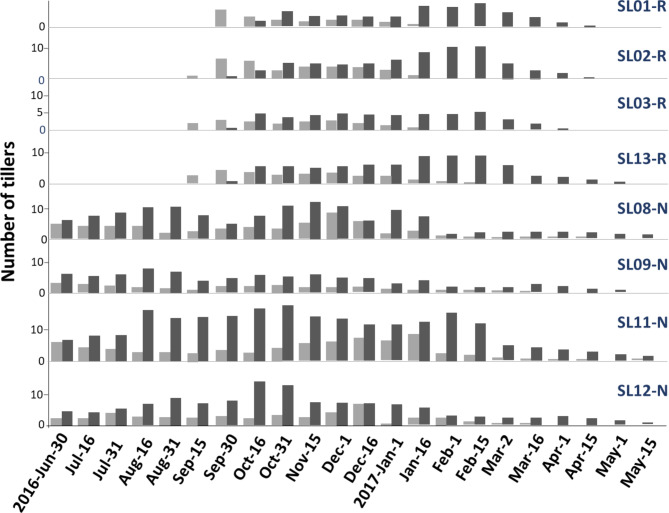
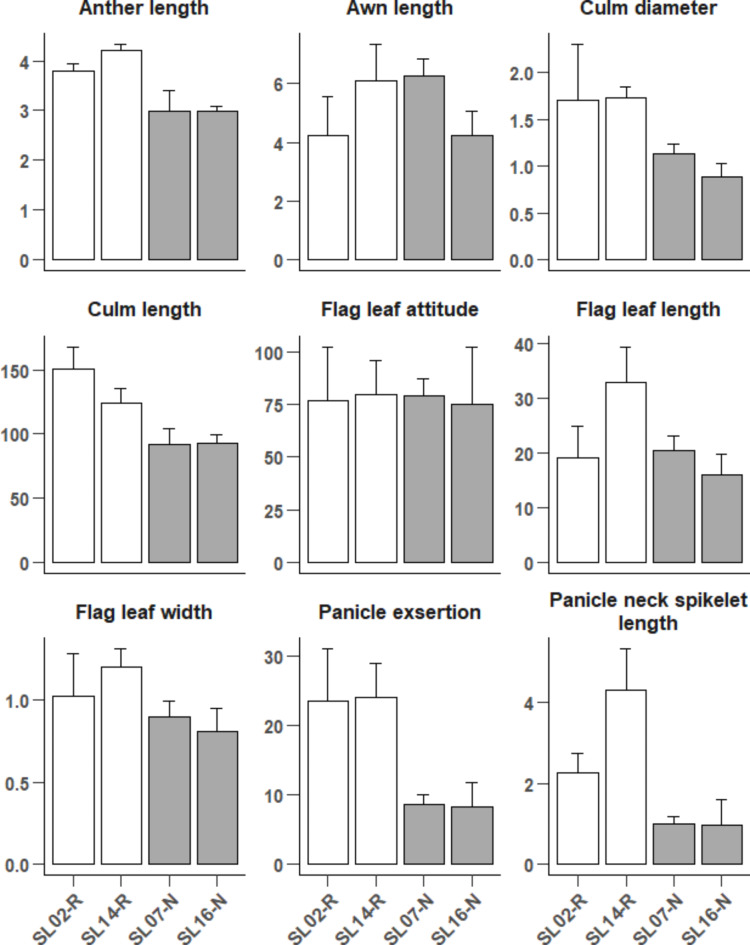
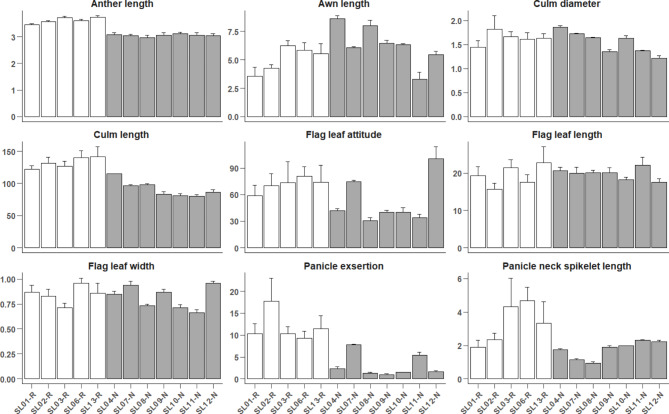
Phenological and morphological variation are widely viewed as a pivotal driver of ecological adaptation and speciation. Here, we investigate variation patterns of flowering phenology and morphological traits within and between O. rufipogon and O. nivara populations in Sri Lanka by incorporating the in situ observation in natural habitats and manipulative experiments in the common gardens. First, we observed varying degrees of phenological variation under different temporal and spatial conditions, suggesting that flowering phenology of two Oryza species varied depending on both environments and management practices. Particularly, the Sri Lankan O. nivara exhibits high plasticity in flowering phenology, implying that O. nivara might not be an annual in the strict sense. Second, the observation that flowering time of the two species overlapped suggests that the primary factor to maintain the species divergence in Sri Lanka may not be flowering time but rather environments. Third, our selection analysis suggests that interspecific divergence in the traits related to reproduction and habitat preference is adaptive and most likely driven by natural selection. Together, our case study on the Sri Lankan O. rufipogon and O. nivara enhances the understanding of the roles of phenotypic plasticity and environmental factors in the processes of adaptation and speciation.

Keywords: Ecological divergence; Flowering phenology; Morphological traits; Population variation; Wild rice.


Conflict of interest statement

Declarations. Competing interests: The authors declare no competing interests.

Figures

Fig. 1
Fig. 1
Geographic locations of six O. rufipogon (blue and dot) and eight O. nivara (red and triangle) populations sampled in this study. Population codes with superscripts a and b represent the populations used for the in situ observation and common garden experiment, respectively. Detailed information on all populations is provided in Table S1. The wet, dry, and intermediate zones are well defined previously, with the amount of annual rainfall being more than 2,500 mm (wet zone), 1,750 to 2,500 mm (intermediate zone) and less than 1,750 mm (dry zone). The map was extracted from https://images.app.goo.gl/2MAHwhhJ5owH3ib99 and figure was generated by the first author using the ArcGIS 10.3 (https://developers.arcgis.com/).
Fig. 2
Fig. 2
The growth form (upper panels) and habitat (lower panels) of four O. rufipogon and O. nivara populations used for in situ observations. (a, b) Two O. rufipogon populations, with SL02-R growing around a river of 3 ~ 5 m wide and 1 ~ 3 m deep (a) and SL14-R in an abundant marshy land, along with other hydrophytic weeds and fairly dense (b). (c, d) Two O. nivara populations, with SL07-N growing nearby a road and separated by paddy fields (c) and SL16-N distributes near to lake area and mix grows with other shrubs and weeds (d).
Fig. 3
Fig. 3
Life cycle of O. rufipogon and O. nivara populations based on in situ observation for the natural populations. The suffixes, R and N, in population codes represent O. rufipogon and O. nivara, respectively.
Fig. 4
Fig. 4
Flowering phenological variation of O. rufipogon and O. nivara populations based on common garden experiment. The suffixes, R and N, in population codes represent O. rufipogon and O. nivara, respectively.
Fig. 5
Fig. 5
Variation patterns of nine morphological traits between and within O. rufipogon and O. nivara populations based on in situ observations. The bars indicate the mean ± standard deviation (SD) of trait variation. The white and grey columns represent the O. rufipogon and O. nivara populations, respectively.
Fig. 6
Fig. 6
Principal component analysis (PCA) of O. rufipogon (blue) and O. nivara (red) populations based on in situ observation (A) and common garden experiment (B).
Fig. 7
Fig. 7
Variation patterns of nine morphological traits among populations within O. rufipogon and O. nivara. The bars indicate the mean ± standard deviation (SD) of trait variation. The white and grey columns represent the O. rufipogon and O. nivara populations, respectively.

Similar articles

References

    1. Mitchell-Olds, T., Willis, J. H. & Goldstein, D. B. Which evolutionary processes influence natural genetic variation for phenotypic traits? Nat. Rev. Genet.8, 845–856 (2007). - PubMed
    1. Nosil, P. Ecological Speciation (Oxford University Press, 2012).
    1. Richardson, J. L., Urban, M. C., Bolnick, D. I. & Skelly, D. K. Microgeographic adaptation and the spatial scale of evolution. Trends Ecol. Evol.29, 165–176 (2014). - PubMed
    1. Erickson, D. L., Fenster, C. B., Stenøien, H. K. & Price, D. Quantitative trait locus analyses and the study of evolutionary process. Mol. Ecol.13, 2505–2522 (2004). - PubMed
    1. Faria, R. et al. Advances in ecological speciation: an integrative approach. Mol. Ecol.23, 513–521 (2014). - PubMed

LinkOut - more resources