. 2024 Dec 28;24(1):1268.
doi: 10.1186/s12870-024-05751-9.

Decoding the physicochemical basis of resurrection: the journey of lichen Flavoparmelia caperata through prolonged water scarcity to full rehydration

Affiliations

Decoding the physicochemical basis of resurrection: the journey of lichen Flavoparmelia caperata through prolonged water scarcity to full rehydration

Upma Bhatt et al. BMC Plant Biol. .

Abstract

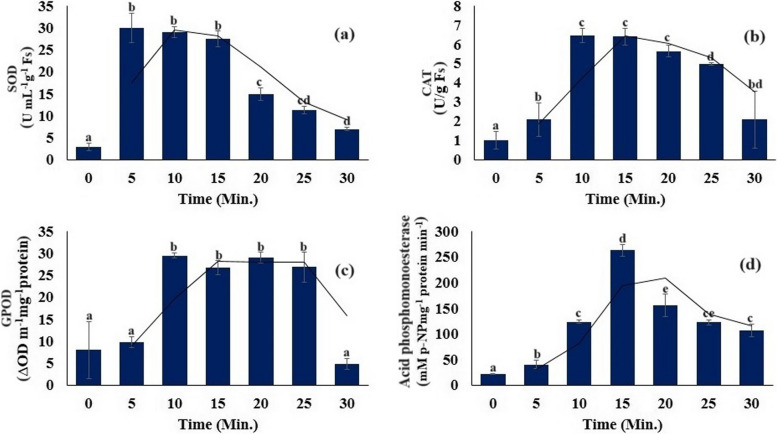
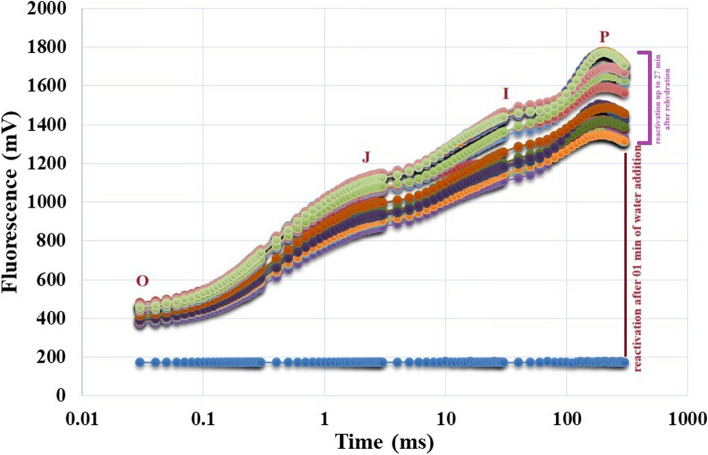
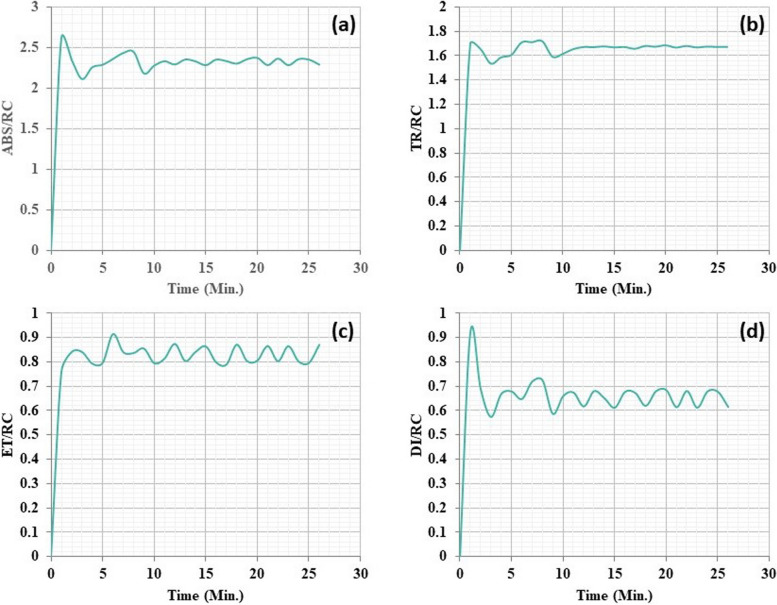
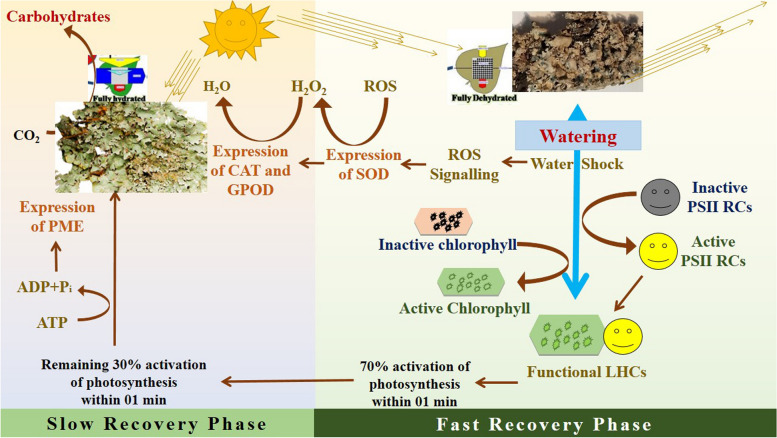
Desiccation tolerance is a complex phenomenon observed in the lichen Flavoparmelia ceparata. To understand the reactivation process of desiccated thalli, completely dried samples were rehydrated. The rehydration process of this lichen occurs in two phases. The first phase, characterized by rapid rehydration, involves the conversion of non-functional reaction centers (RCs) into functional PSII RCs, and the accumulation of ROS along with the increment in SOD antioxidant enzyme. These coordinated mechanisms initiate the light reaction of photosynthesis by forming active light-harvesting complexes (LHCs). This adaptation ensures efficient recovery, as evidenced by specific energy fluxes (ABS/RC, TR/RC, ET/RC, and DI/RC), phenomenological fluxes (ABS/CS, TR/CS, ET/CS, and DI/CS), quantum efficiencies (ФP0, ФE0, and ФD0), primary and secondary photochemistry, photochemical and non-photochemical quenching, and performance index, highlighting the essential role of rapid water uptake in restoring turgor pressure for cell structure and function maintenance. The interconnected network of antioxidant defenses, including catalase (CAT) and peroxidase (POD), underscores the plant's ability to cope with oxidative stress during resilience. The acid phosphomonoesterase (PME) enzymatic activity corresponds to its role in releasing phosphate for essential cellular functions and post-rehydration thallus growth. The activity of CAT, GPOD, and PME signifies the gradual reactivation of lichen F. caperata. Moreover, the investigation into chlorophyll a fluorescence emphasizes the efficient reactivation of the photosynthetic process in F. caperata. In conclusion, lichen F. caperata demonstrates significant potential for desiccation tolerance through the rapid transformation of chloroplasts, chlorophylls, and PSII RCs from their inactive to active states upon rehydration. This research not only enhances our understanding of desiccation tolerance in resurrection plants but also highlights the importance of lichens, particularly F. caperata, as valuable models for studying plant resilience in challenging environments.

Keywords: Antioxidant; Chlorophyll a fluorescence; Desiccation tolerance; Lichen; Photosynthesis; Resurrection plant.


Conflict of interest statement

Declarations. Ethics approval and consent to participate: Not applicable. Consent for publication: Not applicable. Competing interest: The authors declare no conflict of interest.

Figures

Fig.1
Fig.1
The captivating dynamics of Relative Water Content (RWC) (a) and chlorophyll content (b) within lichen F. caperata during transition from desiccation to rehydration state
Fig. 2
Fig. 2
Alteration in SOD (a), CAT (b), GPOD (c) and PME enzyme level during transition from desiccation to hydration state of lichen F. caperata
Fig. 3
Fig. 3
The O-J-I-P transient curve up to 28 min after rehydration, illustrating the transformative journey of completely dried thalli to their resurrection upon watering in the F. caperata lichen. This intricately designed curve serves as a visual ligand, encapsulating the dynamic shifts in the O-J-I-P phases and providing a compelling representation of the photosynthetic activity during the resurrection process. Each point on the curve becomes a plot point, narrating the resilience and adaptability of F. caperata in response to water availability
Fig. 4
Fig. 4
The transition from desiccation to hydration resulted in a change in the density of active reaction centers (RCs). During the initial rapid recovery phase, two distinct stages were observed. In the first stage (0–5 min), RCs were activated quickly (R2 = 0.7994). In the second stage (5–15 min), a slower activation of functional RCs occurred (R2 = 0.7365). After 15–30 min, rehydration reached a plateau, as indicated by a low R2 value of 0.0642. The blue arrow signifies the beginning of rehydration
Fig. 5
Fig. 5
Alteration in specific energy fluxes ABS/RC (a), TR/RC (b), ET/RC (c) and DI/RC (d) during desiccation to hydration transition in lichen F. caperata
Fig. 6
Fig. 6
The dynamic changes in phenomenological fluxes during the desiccation to rehydration transition. The graphs illustrate ABS/CS (a), TR/CS (b), ET/CS (c), and DI/CS (d)
Fig. 7
Fig. 7
Variation in photochemical quenching (a), non-photochemical quenching (b), primary (c) and secondary photochemistry during desiccation to hydration transition in lichen F. caperata
Fig. 8
Fig. 8
Changes in PIcs (a), quantum efficiency of photosynthesis (b), quantum energy of electron transport (c) and quantum efficiency of dissipation during transition from fully desiccated to fully hydrated state of lichen F. caperata
Fig. 9
Fig. 9
The grid correlation matrix provides a detailed portrayal of the intricate interrelationships among all computed chlorophyll a fluorescence parameters, utilizing a vibrant colour code for clarity. This comprehensive visualization encapsulates the nuanced variations observed throughout the entire desiccation to hydration transition of lichen thalli. Notably, the correlation matrix values range from + 1 to -1, further emphasizing the strength and direction of these associations
Fig. 10
Fig. 10
The correlogram serves as a visual representation of Pearson's correlation matrices involving various physiological parameters. The dot area and colour in the visualization are proportionate to the correlation coefficients, offering an intuitive means to comprehend the relationships among these variables throughout the desiccation to hydration transition of lichen thalli
Fig. 11
Fig. 11
Systematic representation of various biochemical and physiological events of slow and fast recovery phases in F. caperata during its transition from desiccation to hydration

Similar articles

Cited by

References

    1. Abbasi T, Abbasi SA. Biomass energy and the environmental impacts associated with its production and utilization. Renewable Sustainable Energy Rev. 2010;14:919–37.
    1. Brodersen CR, Roddy AB, Wason JW, McElrone AJ. Functional Status of Xylem Through Time. Annual Review of Plant Biology. 2019;70:407–33. - PubMed
    1. Maestre FT, Quero JL, Gotelli NJ, Escudero A, Ochoa V, Delgado-Baquerizo M, et al. Plant species richness and ecosystem multifunctionality in global drylands. Science (80-). 2012;335:214–8. - PMC - PubMed
    1. Asante FA, Amuakwa-Mensah F. Climate change and variability in Ghana: Stocktaking. Climate. 2015;3:78–99.
    1. Singh Sidhu GP, Bali AS. Plant responses to drought stress. In: Brassinosteroids in Plant Developmental Biology and Stress Tolerance. 2022;13:1006617.

LinkOut - more resources