

The songbird connectome (OSCINE-NET.ORG): structure-function organization beyond the canonical vocal control network
- PMID: 39731002
- PMCID: PMC11681764
- DOI: 10.1186/s12868-024-00919-3
The songbird connectome (OSCINE-NET.ORG): structure-function organization beyond the canonical vocal control network
Abstract
Background: Understanding the neural basis of behavior requires insight into how different brain systems coordinate with each other. Existing connectomes for various species have highlighted brain systems essential to various aspects of behavior, yet their application to complex learned behaviors remains limited. Research on vocal learning in songbirds has extensively focused on the vocal control network, though recent work implicates a variety of circuits in contributing to important aspects of vocal behavior. Thus, a more comprehensive understanding of brain-wide connectivity is essential to further assess the totality of circuitry underlying this complex learned behavior.
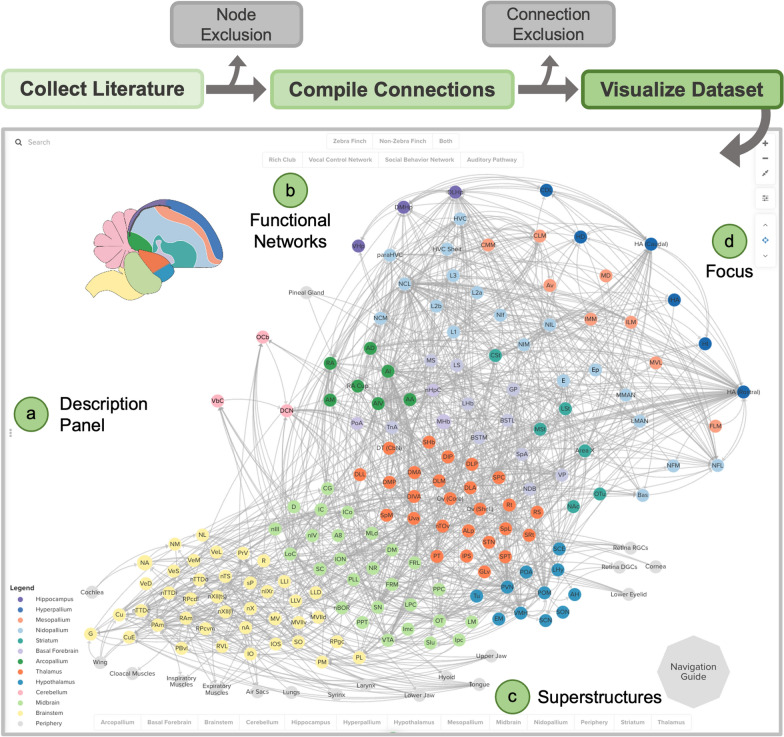
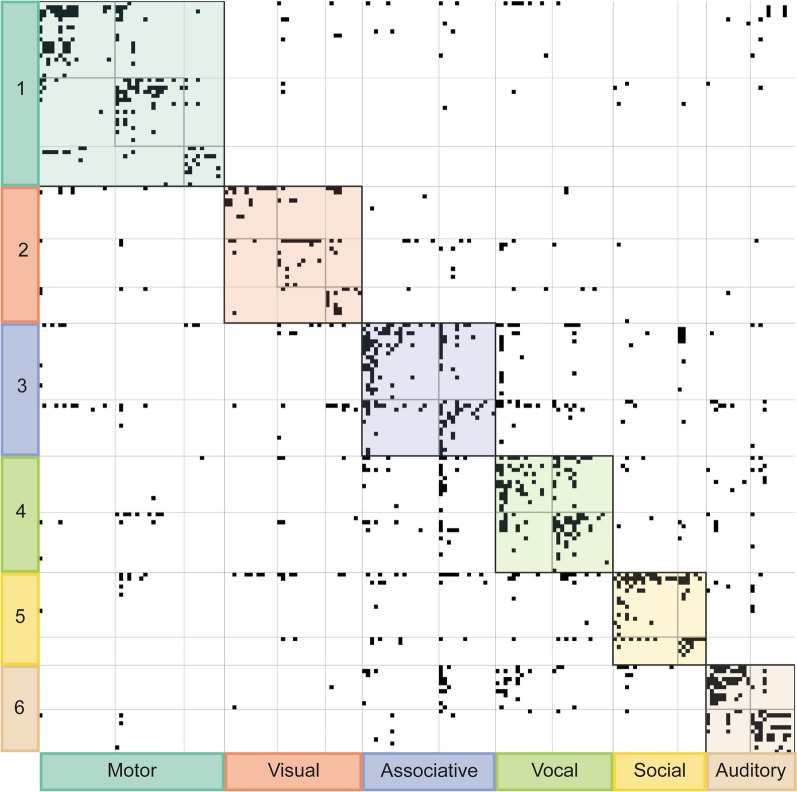
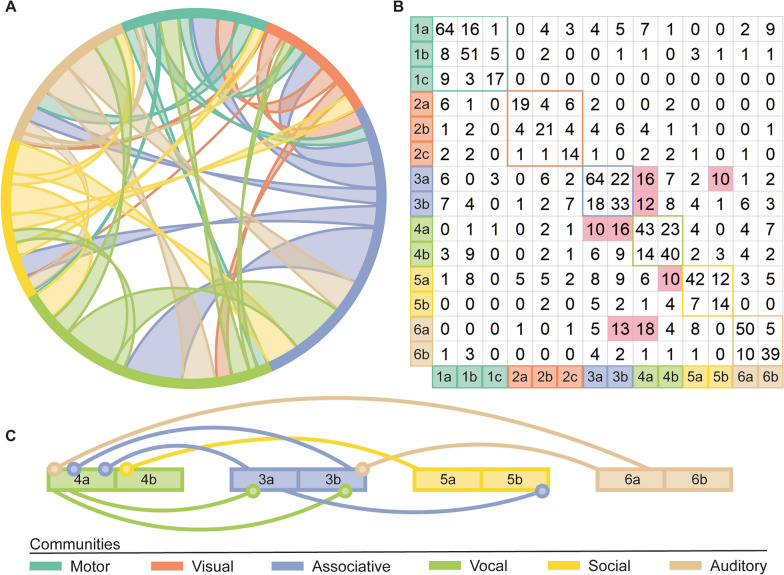
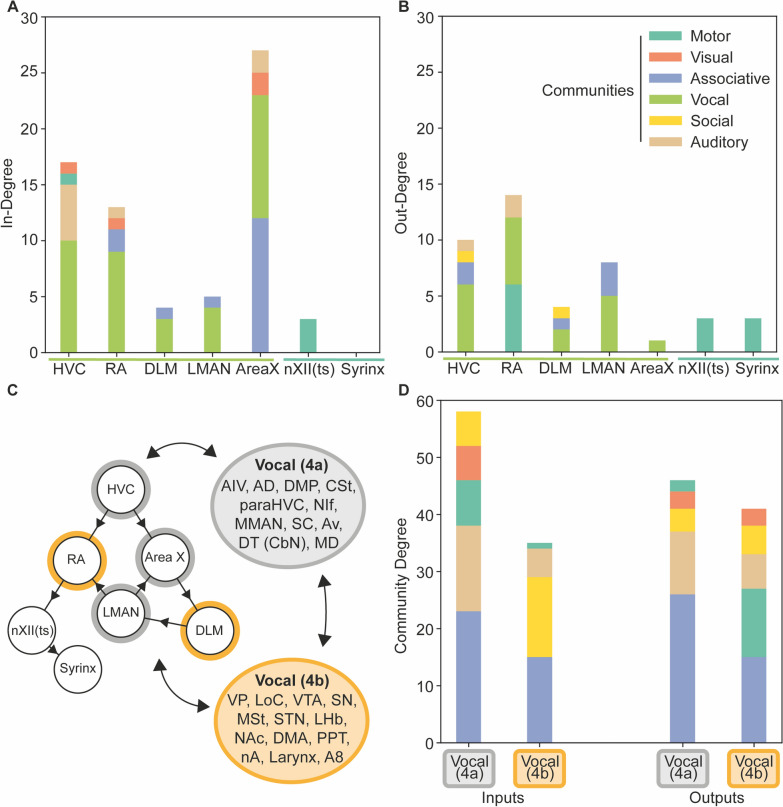
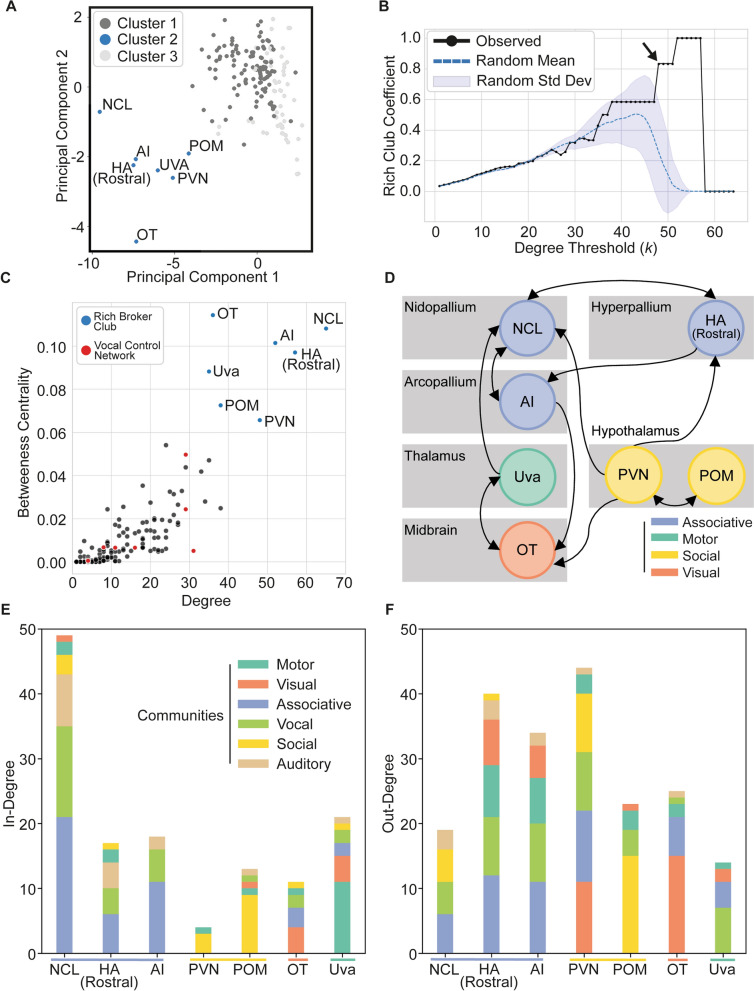
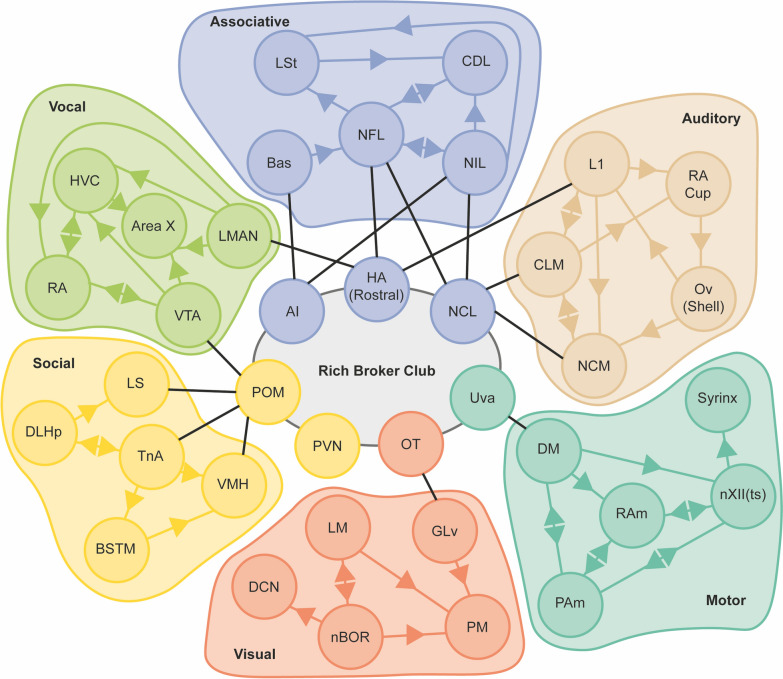
Results: We present the Oscine Structural Connectome for Investigating NEural NETwork ORGanization (OSCINE-NET.ORG), the first interactive mesoscale connectome for any vocal learner. This comprehensive digital map includes all known connectivity data, covering major brain superstructures and functional networks. Our analysis reveals that the songbird brain exhibits small-world properties, with highly connected communities functionally designated as motor, visual, associative, vocal, social, and auditory. Moreover, there is a small set of significant connections across these communities, including from social and auditory sub-communities to vocal sub-communities, which highlight ethologically relevant facets of vocal learning and production. Notably, the vocal community contains the majority of the canonical vocal control network, as well as a variety of other nodes that are highly interconnected with it, meriting further evaluation for their inclusion in this network. A subset of nodes forms a "rich broker club," highly connected across the brain and forming a small circuit amongst themselves, indicating they may play a key role in information transfer broadly. Collectively, their bidirectional connectivity with multiple communities indicates they may act as liaisons across multiple functional circuits for a variety of complex behaviors.
Conclusions: OSCINE-NET.ORG offers unprecedented access to detailed songbird connectivity data, promoting insight into the neural circuits underlying complex behaviors. This data emphasizes the importance of brain-wide integration in vocal learning, facilitating a potential reevaluation of the canonical vocal control network. Furthermore, we computationally identify a small, previously unidentified circuit-one which may play an impactful role in brain-wide coordination of multiple complex behaviors.
Keywords: Connectome; Graph theory; Network analysis; Oscine; Songbird; Vocal learning.
© 2024. The Author(s).
Conflict of interest statement
Declarations. Ethics approval and consent to participate: Not applicable. Consent for publication: Not applicable. Competing interests: The authors declare no competing interests.
Figures
Similar articles
-
Neurochemical specializations associated with vocal learning and production in songbirds and budgerigars.Brain Behav Evol. 1994;44(4-5):234-46. doi: 10.1159/000113579. Brain Behav Evol. 1994. PMID: 7842283 Review.
-
Early experience shapes vocal neural coding and perception in songbirds.Dev Psychobiol. 2012 Sep;54(6):612-31. doi: 10.1002/dev.21014. Epub 2012 Jun 18. Dev Psychobiol. 2012. PMID: 22711657 Free PMC article. Review.
-
Songbird: a unique animal model for studying the molecular basis of disorders of vocal development and communication.Exp Anim. 2015;64(3):221-30. doi: 10.1538/expanim.15-0008. Epub 2015 Apr 24. Exp Anim. 2015. PMID: 25912323 Free PMC article. Review.
-
Experience selectively alters functional connectivity within a neural network to predict learned behavior in juvenile songbirds.Neuroimage. 2020 Nov 15;222:117218. doi: 10.1016/j.neuroimage.2020.117218. Epub 2020 Aug 1. Neuroimage. 2020. PMID: 32745678
-
Circuits, hormones, and learning: vocal behavior in songbirds.J Neurobiol. 1997 Nov;33(5):602-18. doi: 10.1002/(sici)1097-4695(19971105)33:5<602::aid-neu8>3.0.co;2-8. J Neurobiol. 1997. PMID: 9369462 Review.
Cited by
-
Neural mechanism of dopamine modulating singing related behavior in songbirds: an updated review.PeerJ. 2025 Jun 5;13:e19500. doi: 10.7717/peerj.19500. eCollection 2025. PeerJ. 2025. PMID: 40487051 Free PMC article. Review.
References
-
- Knudsen EI. Early auditory experience aligns the auditory map of space in the optic tectum of the barn owl. Science. 1983;222(4626):939–42. - PubMed
-
- Lim MM, Murphy AZ, Young LJ. Ventral striatopallidal oxytocin and vasopressin V1a receptors in the monogamous prairie vole (Microtus ochrogaster). J Comp Neurol. 2004;468(4):555–70. - PubMed
MeSH terms
LinkOut - more resources
Full Text Sources
