

Microbiome and metabolome analysis in smoking and non-smoking pancreatic ductal adenocarcinoma patients
- PMID: 39731043
- PMCID: PMC11673369
- DOI: 10.1186/s12866-024-03688-5
Microbiome and metabolome analysis in smoking and non-smoking pancreatic ductal adenocarcinoma patients
Abstract
Background: Smoking is a significant risk factor for pancreatic ductal adenocarcinoma (PDAC). This study aimed to investigate the effects of smoking on the pancreatic microbiome and metabolome in resectable and unresectable male PDAC patients.
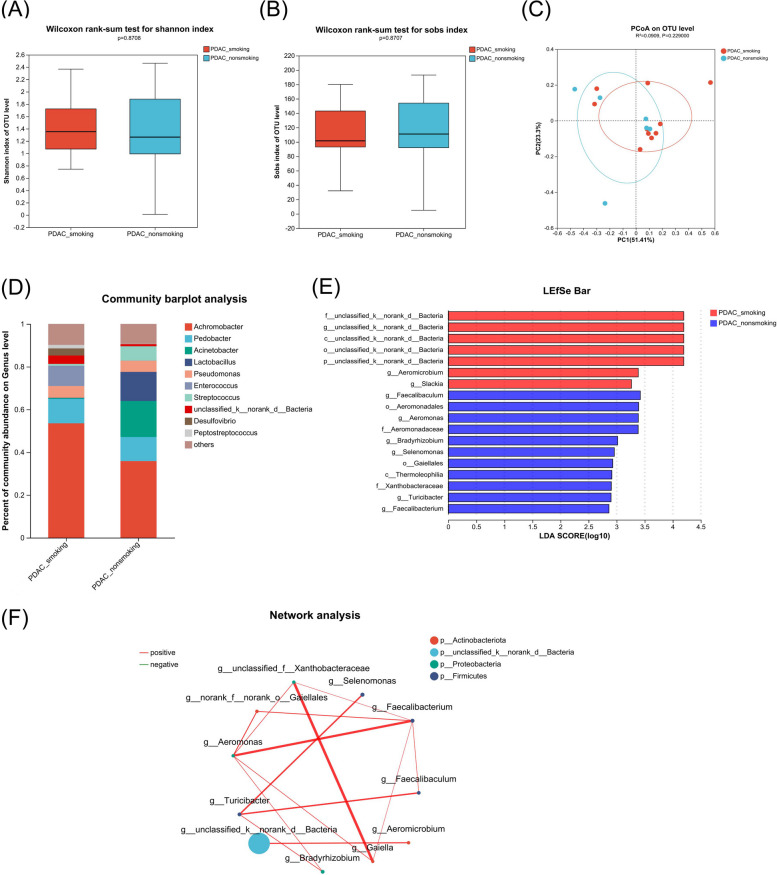
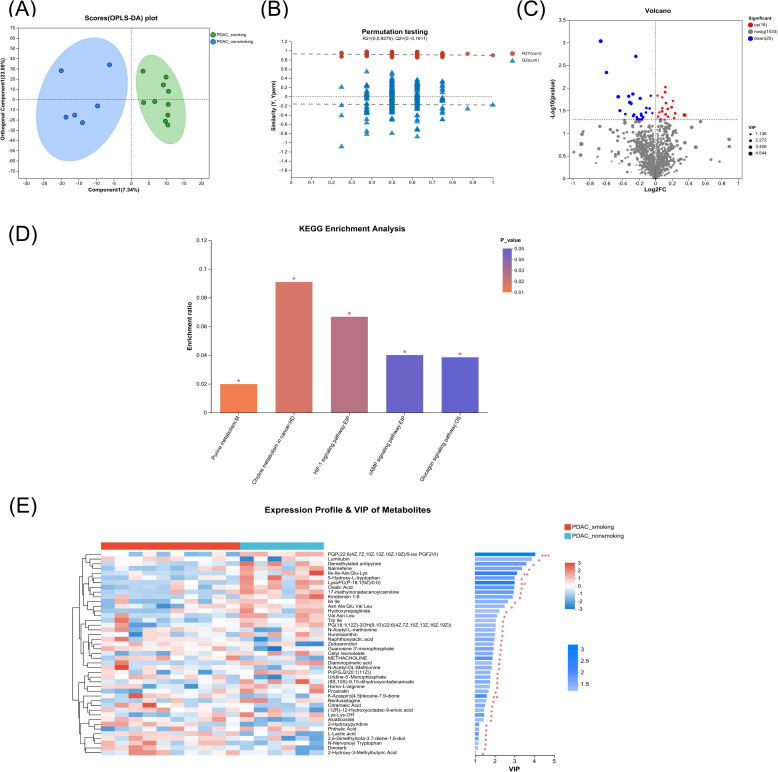
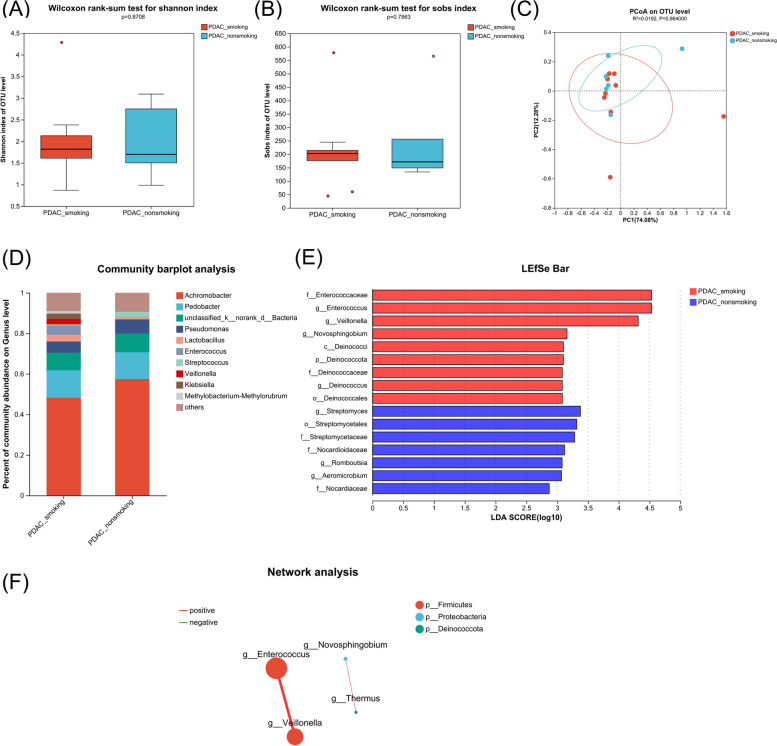
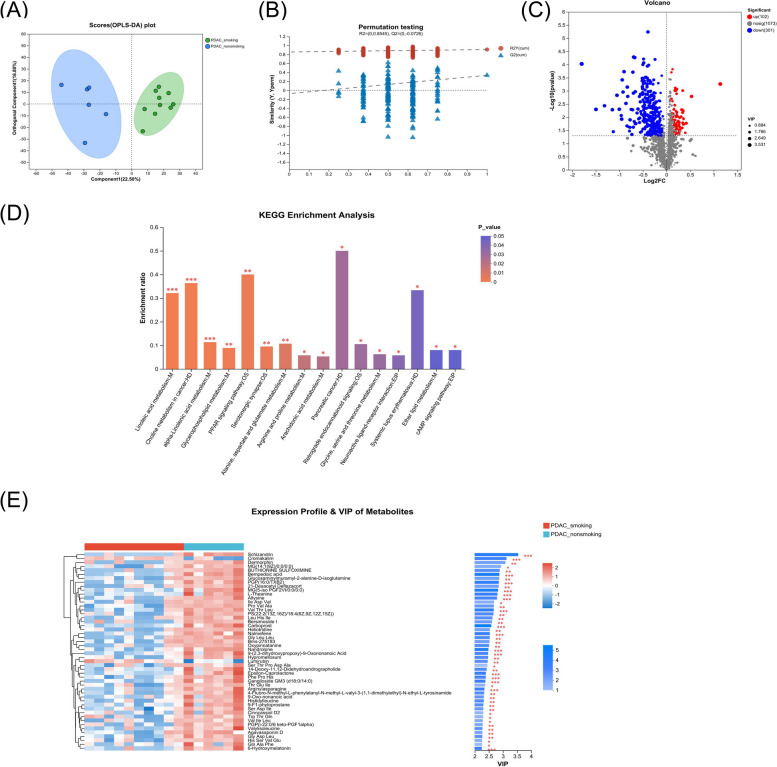
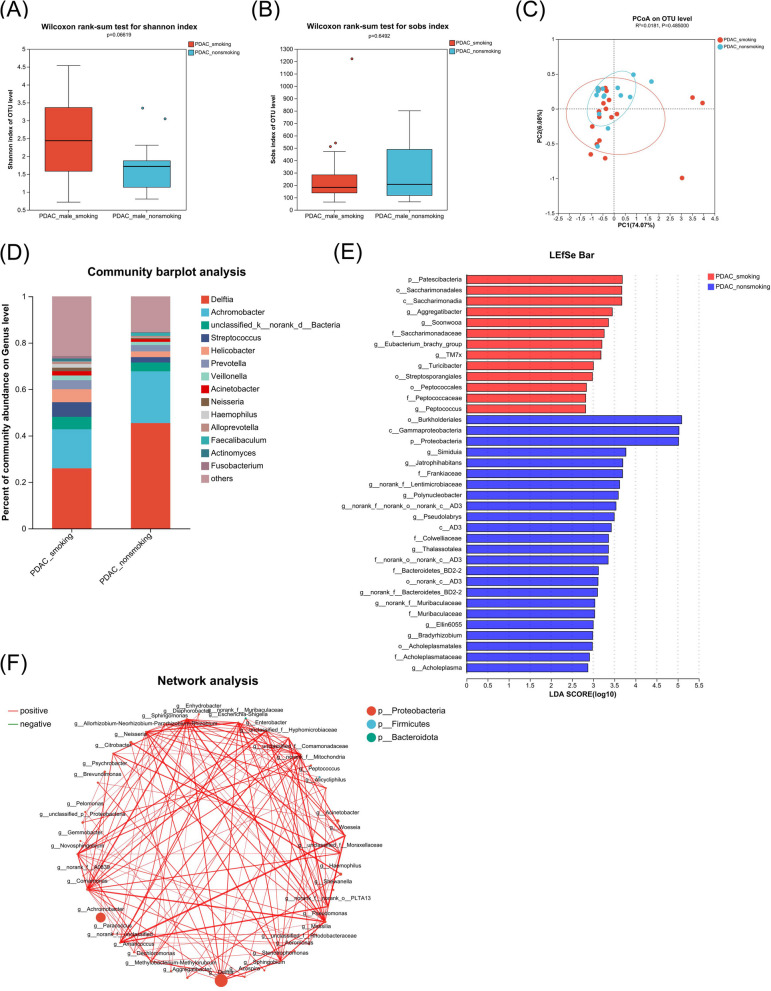
Methods: The pancreatic tissue samples were collected from resectable PDACs via surgery and unresectable PDACs via endoscopic ultrasound fine needle aspiration (EUS-FNA). Surgical samples obtained from 10 smoking and 6 non-smoking PDACs were measured by 16S ribosomal RNA (16S rRNA) gene sequencing and liquid chromatography-mass spectrometry (LC/MS). Fine needle aspiration (FNA) samples obtained from 20 smoking and 14 non-smoking PDACs were measured by 16S rRNA gene sequencing.
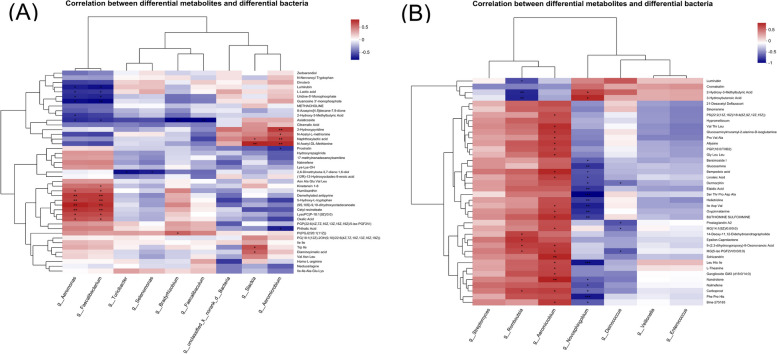
Results: From resectable to unresectable patients, the dominant genus in the pancreas changed from Achromobacter to Delftia. Smoking further altered the abundance of specific bacteria, mainly manifested as an increase of Slackia in surgical tumor tissue of the smoking group, and an enrichment of Aggregatibacter and Peptococcus in FNA samples of the smoking group. In tumor tissue, smoking caused an enrichment of the cancer-promoting cAMP signaling pathway and L-lactic acid. In paracancerous tissue, smoking also induced a detrimental disturbance in the pancreatic microbiome and metabolome, including an enrichment of Veillonella, Novosphingobium, Deinococcus, and 3-hydroxybutanoic acid, and a reduction of linoleic acid. Besides, the cancer-promoting L-lactic acid was negatively correlated with Faecalibacterium in tumor tissue based on the correlation analysis.
Conclusion: There were differences in the pancreatic microbiome of PDAC patients at different stages, and smoking can further disrupt the pancreatic microbiome and metabolism in PDAC.
Keywords: Endoscopic ultrasound-guided fine needle aspiration; Metabolome; Microbiome; Pancreatic ductal adenocarcinoma; Smoking.
© 2024. The Author(s).
Conflict of interest statement
Declarations. Ethics approval and consent to participate: The samples and clinical information used in this study were obtained under conditions of informed consent and with approval of the Ethics Committee of the Qilu Hospital of Shandong University (KYLL-202107-097). Consent for publication: Not applicable. Competing interests: The authors declare no competing interests.
Figures
Similar articles
-
Endoscopic ultrasound-guided fine-needle biopsy as a tool for studying the intra-tumoral microbiome in pancreatic ductal adenocarcinoma: a pilot study.Sci Rep. 2022 Jan 7;12(1):107. doi: 10.1038/s41598-021-04095-w. Sci Rep. 2022. PMID: 34997106 Free PMC article.
-
Integrated analysis of microbiome and metabolome reveals signatures in PDAC tumorigenesis and prognosis.Microbiol Spectr. 2024 Nov 5;12(11):e0096224. doi: 10.1128/spectrum.00962-24. Epub 2024 Oct 10. Microbiol Spectr. 2024. PMID: 39387592 Free PMC article.
-
Succession of the multi-site microbiome along pancreatic ductal adenocarcinoma tumorigenesis.Front Immunol. 2024 Nov 7;15:1487242. doi: 10.3389/fimmu.2024.1487242. eCollection 2024. Front Immunol. 2024. PMID: 39575247 Free PMC article.
-
Applications of endoscopic ultrasound in pancreatic cancer.World J Gastroenterol. 2014 Jun 28;20(24):7808-18. doi: 10.3748/wjg.v20.i24.7808. World J Gastroenterol. 2014. PMID: 24976719 Free PMC article. Review.
-
Role of the microbiome in systemic therapy for pancreatic ductal adenocarcinoma (Review).Int J Oncol. 2021 Dec;59(6):101. doi: 10.3892/ijo.2021.5281. Epub 2021 Nov 5. Int J Oncol. 2021. PMID: 34738624 Free PMC article. Review.
Cited by
-
Timing and Protocols for Microbiome Intervention in Surgical Patients: A Literature Review of Current Evidence.Cureus. 2025 Jun 15;17(6):e86104. doi: 10.7759/cureus.86104. eCollection 2025 Jun. Cureus. 2025. PMID: 40671981 Free PMC article. Review.
-
Metagenomic Microbial Signatures for Noninvasive Detection of Pancreatic Cancer.Biomedicines. 2025 Apr 21;13(4):1000. doi: 10.3390/biomedicines13041000. Biomedicines. 2025. PMID: 40299688 Free PMC article.
-
Microbiological colonization of the pancreatic tumor affects postoperative complications and outcome after pancreatic surgery.Front Cell Infect Microbiol. 2025 May 30;15:1521952. doi: 10.3389/fcimb.2025.1521952. eCollection 2025. Front Cell Infect Microbiol. 2025. PMID: 40521024 Free PMC article.
References
-
- Siegel RL, Miller KD, Jemal A. Cancer statistics, 2020. CA Cancer J Clin. 2020;70:7–30. - PubMed
MeSH terms
Substances
Grants and funding
- No. 2021SDUCRCB004/ECCM Program of Clinical Research Center of Shandong University
- NO.2021CXGC010506/Major Scientific and Technological Innovation Project of Shandong Province
- No. 82261160396/National Natural Science Foundation of China
- No. tsqn202306344/Taishan Scholars Program of Shandong Province
LinkOut - more resources
Full Text Sources
Medical
