

Association between cardiometabolic index and all-cause and cause-specific mortality among the general population: NHANES 1999-2018
- PMID: 39731068
- PMCID: PMC11681656
- DOI: 10.1186/s12944-024-02408-2
Association between cardiometabolic index and all-cause and cause-specific mortality among the general population: NHANES 1999-2018
Abstract
Background: Cardiometabolic index (CMI) is a comprehensive clinical parameter which integrates overweight and abnormal lipid metabolism. However, its relationship with all-cause, cardiovascular disease (CVD), and cancer mortality is still obscure. Thus, a large-scale cohort study was conducted to illustrate the causal relation between CMI and CVD, cancer, and all-cause mortality among the common American population.
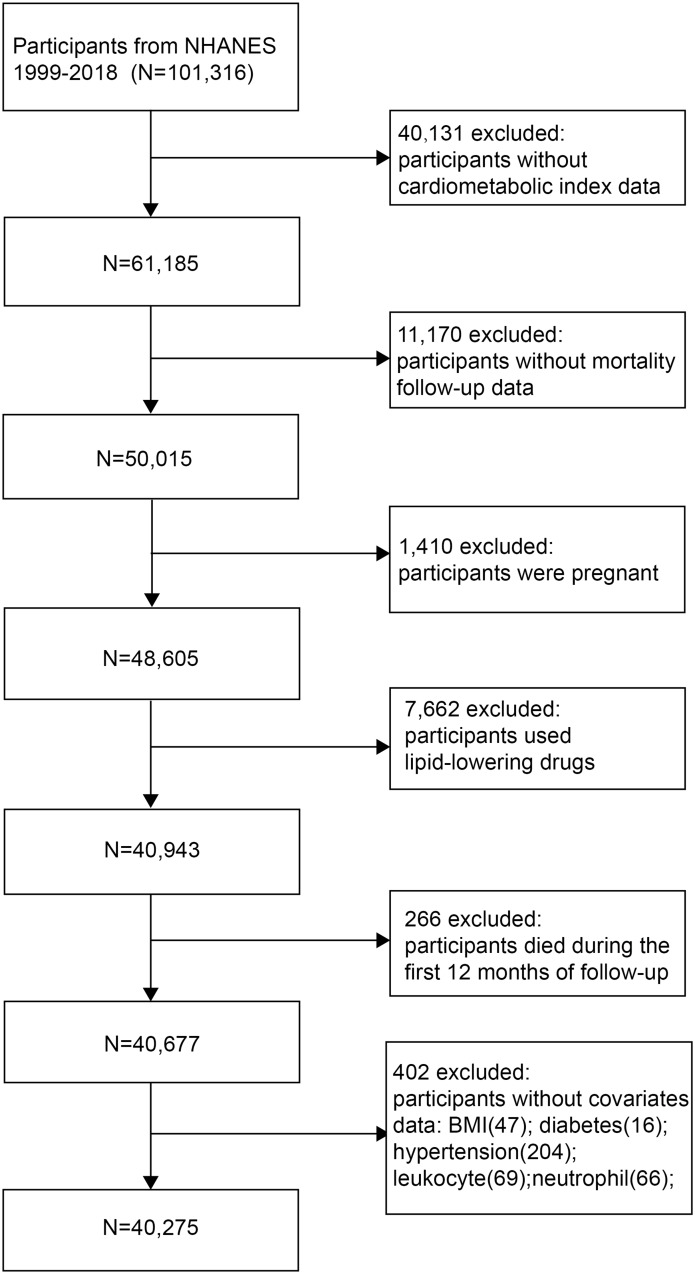
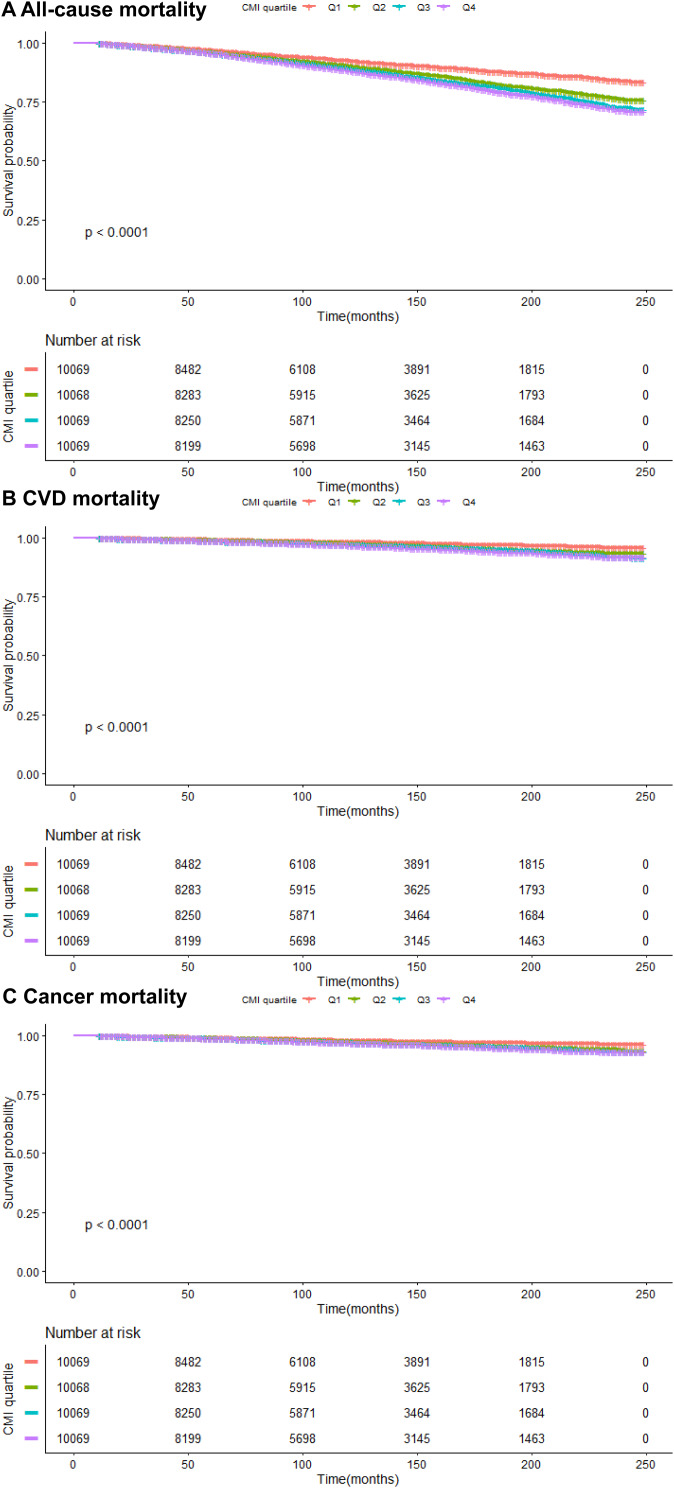
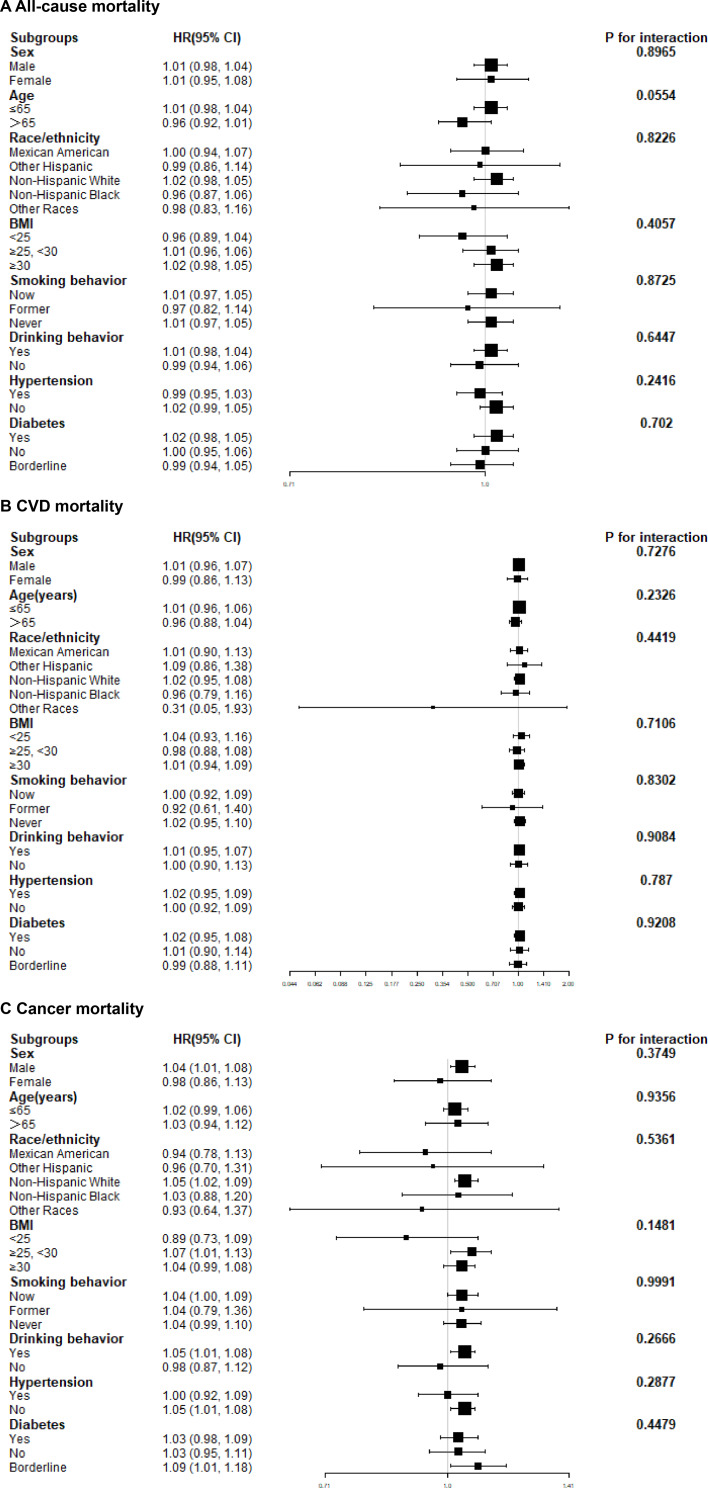
Methods: Our research was performed on the basis of National Health and Nutrition Examination Survey (NHANES) database, involving 40,275 participants ranging from 1999 to 2018. The formula of CMI is [waist circumference (cm) / height (cm)] × [triglyceride (mg/dL) / high-density lipoprotein cholesterol (mg/dL)]. Outcome variables consisted of CVD, cancer, and all-cause mortality, which were identified by the International Classification of Diseases (ICD)-10. The correlation between CMI and mortality outcomes was analyzed utilizing the Kaplan-Meier survival modeling, univariate/multivariate Cox regression analysis, smooth curve fitting analysis, threshold effect analysis, and subgroup analysis. Stratification factors for subgroups included age, race/ethnicity, sex, smoking behavior, drinking behavior, BMI, hypertension, and diabetes.
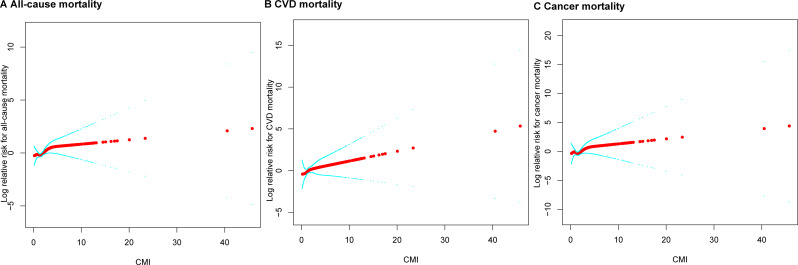
Results: The baseline characteristics table includes 4,569 all-cause-induced death cases, 1,113 CVD-induced death cases, and 1,066 cancer-induced death cases. Without adjustment for potential covariates, significantly positive causal correlation existed between CMI and all-cause mortality (HR = 1.03, 95% CI 1.02,1.04, P-value<0.05), CVD mortality (HR = 1.04, 95% CI 1.03, 1.05, P-value<0.05) and cancer mortality(HR = 1.03, 95% CI 1.02, 1.05, P-value<0.05); whereas, after confounding factors were completely adjusted, the relationship lost statistical significance in CMI subgroups (P for trend>0.05). Subgroup analysis found no specific subgroups. Under a fully adjusted model, a threshold effect analysis was performed combined with smooth curve fitting, and the findings suggested an L-shaped nonlinear association within CMI and all-cause mortality (the Inflection point was 0.98); in particular, when the baseline CMI was below 0.98, there existed a negative correlation with all-cause mortality with significance (HR 0.59, 95% CI 0.43, 0.82, P-value<0.05). A nonlinear relation was observed between CMI and CVD mortality. Whereas, the correlation between CMI and cancer mortality was linear.
Conclusions: Among the general American population, baseline CMI levels exhibited an L-shaped nonlinear relationship with all-cause mortality, and the threshold value was 0.98. What's more, CMI may become an effective indicator for CVD, cancer, and all-cause mortality prediction. Further investigation is essential to confirm our findings.
© 2024. The Author(s).
Conflict of interest statement
Declarations. Ethics approval and consent to participate: This study used publicly available summary data and ethics approval was not necessary. Consent for publication: Not applicable. Competing interests: The authors declare no competing interests.
Figures
References
-
- Yu D, Wang Z, Zhang X, Qu B, Cai Y, Ma S, et al. Remnant cholesterol and Cardiovascular Mortality in patients with type 2 diabetes and Incident Diabetic Nephropathy. J Clin Endocrinol Metab. 2021;106(12):3546–54. - PubMed
MeSH terms
Substances
LinkOut - more resources
Full Text Sources
Medical
