. 2024 Dec 27;23(1):424.
doi: 10.1186/s12944-024-02419-z.

Knockdown of RASD1 improves MASLD progression by inhibiting the PI3K/AKT/mTOR pathway

Affiliations

Knockdown of RASD1 improves MASLD progression by inhibiting the PI3K/AKT/mTOR pathway

Guifang Zeng et al. Lipids Health Dis. .

Abstract

Background: There is still no reliable therapeutic targets and effective pharmacotherapy for metabolic dysfunction-associated steatotic liver disease (MASLD). RASD1 is short for Ras-related dexamethasone-induced 1, a pivotal factor in various metabolism processes of Human. However, the role of RASD1 remains poorly illustrated in MASLD. Therefore, we designed a study to elucidate how RASD1 could impact on MASLD as well as the mechanisms involved.

Methods: The expression level of RASD1 was validated in MASLD. Lipid metabolism and its underlying mechanism were investigated in hepatocytes and mice with either overexpression or knockdown of RASD1.

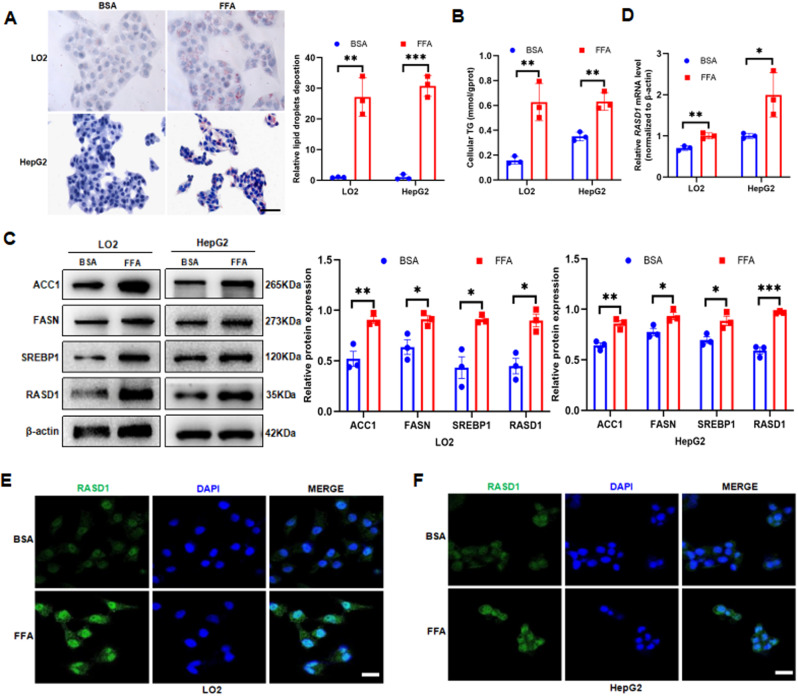
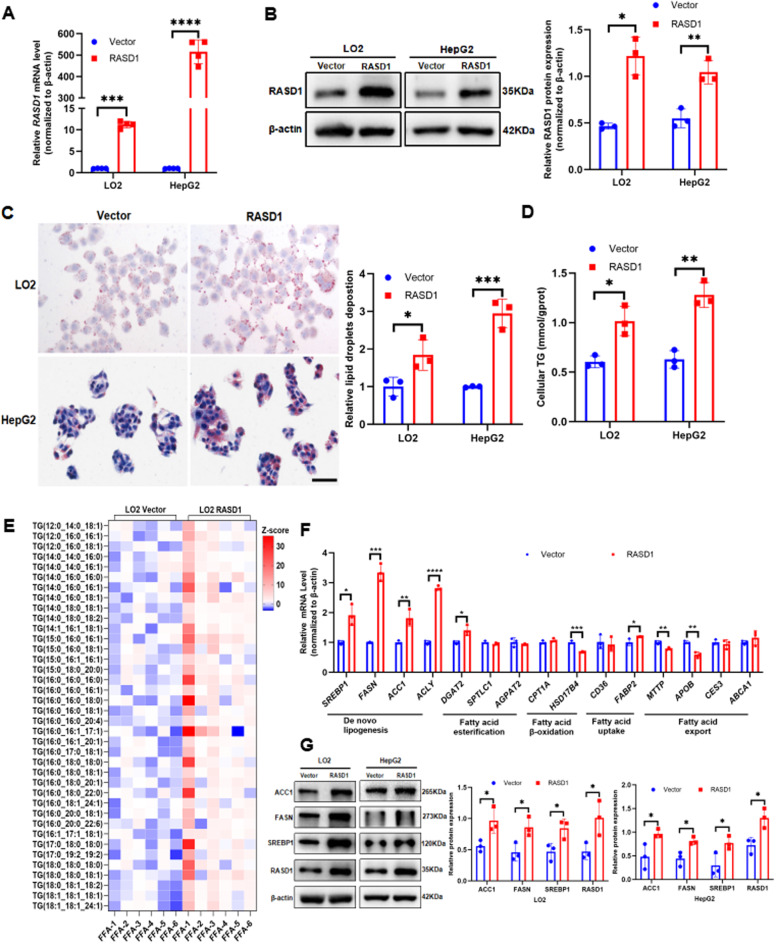
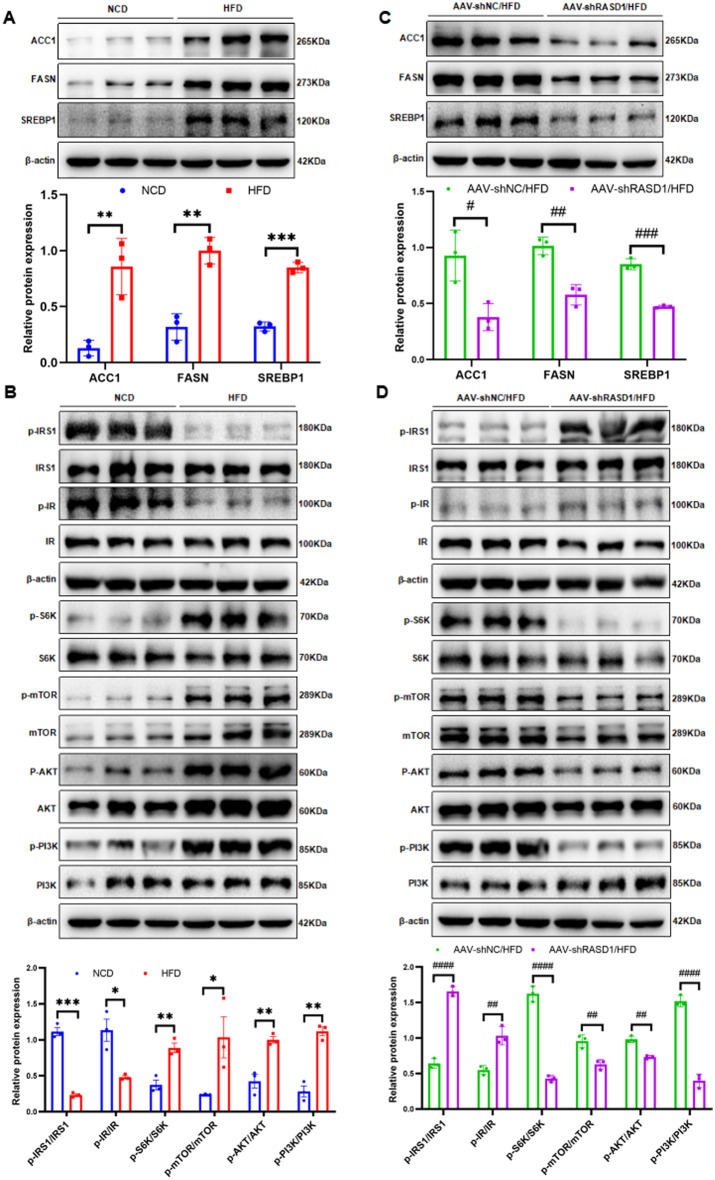
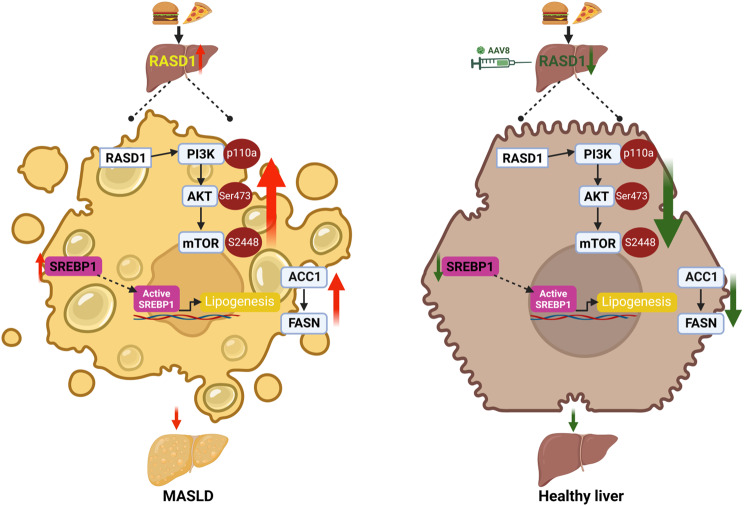
Results: Hepatic RASD1 expression was upregulated in MASLD. Lipid deposition was significantly reduced in RASD1-knockdown hepatocytes and mice, accompanied by a marked downregulation of key genes in the signaling pathway of de novo lipogenesis. Conversely, RASD1 overexpression in hepatocytes had the opposite effect. Mechanistically, RASD1 regulated lipid metabolism in MASLD through the PI3K/AKT/mTOR signaling pathway.

Conclusions: We discovered a novel role of RASD1 in MASLD by regulating lipogenesis via the PI3K/AKT/mTOR pathway, thereby identifying a potential treatment target for MASLD.

Keywords: Lipid metabolism; MASLD; PI3K/AKT/mTOR pathway; Ras-related dexamethasone-induced 1.


Conflict of interest statement

Declarations. Ethics approval and consent to participate: The Ethics Committee of the Fifth Affiliated Hospital of Sun Yat-sen University approved this study (approval number: [2020] L173-1). Informed consent was obtained from all patients before surgery. All animal experiments and related protocols were reviewed and approved by the Animal Ethics Committee of the Fifth Affiliated Hospital of Sun Yat-sen University (NO. 00287). Consent for publication: Not applicable. Competing interests: The authors declare no competing interests.

Figures

Fig. 1
Fig. 1
Hepatic RASD1 was upregulated in patients with MASLD. (A) qPCR analysis showing the RASD1 mRNA expression levels in liver tissues from both groups (n = 15 each). (B) WB analysis of RASD1 protein levels and the corresponding quantitative analysis of liver tissues from the Normal and MASLD groups (n = 6). (C) Representative HE and IHC staining of liver tissues from the Normal and MASLD groups (scale bar, 50 μm), on the right of which the IHC staining data is quantified and shown (n = 3). (D) Representative IF staining of liver tissues from the Normal and MAFLD groups (scale bar: 20 μm). **P < 0.01, ****P < 0.0001, comparing to those data of the Normal group. All data presented in the figure are means ± SDs
Fig. 2
Fig. 2
RASD1 expression was elevated in FFA-treated hepatocytes. (A) Representative ORO staining of hepatocytes that were treated with BSA or FFA and the corresponding quantitative analysis are presented on the right (scale bar: 50 μm). (B) Cellular TG content of hepatocytes that were treated with BSA or FFA. (C) WB determination and the quantification of the RASD1 protein in hepatocytes, with or without FFA or BSA treatment. (D)RASD1 mRNA levels were shown by qPCR analysis results, of hepatocytes treated with BSA or FFA. (E, F) Representative IF staining images of hepatocytes treated by either BSA or FFA (the scale bar shown as 20 μm). n = 3 in all groups. *P < 0.05, **P < 0.01, ***P < 0.001, as are compared to BSA treatment. All data presented in this figure here are means ± SDs
Fig. 3
Fig. 3
Overexpression of RASD1 promoted lipid deposition in FFA-treated hepatocytes. (A, B) The successful overexpression of RASD1 was confirmed by qPCR and WB (n = 3–4). The protein levels of RASD1 is quantified and shown on the right. (C) Representative ORO staining of Vector and RASD1 cell lines (scale bar: 50 μm). The corresponding quantitative analysis is presented on the right (n = 3). (D) Cellular TG contents of the Vector and RASD1 cell lines (n = 3). (E) Lipidomic analysis further demonstrated that TG synthesis was increased in the LO2 RASD1 cell line (n = 6). (F) Gene expression in lipid metabolism of the LO2 RASD1 cell line was measured and determined by qPCR. (G) WB determination of the protein levels was quantified in the Vector and RASD1 cell lines (n = 3). As are compared to Vector, *P < 0.05, **P < 0.01, ***P < 0.001, ****P < 0.0001. All data presented in the figure are means ± SDs
Fig. 4
Fig. 4
RASD1 knockdown inhibited lipid deposition in FFA-treated hepatocytes. (A, B) The successful knockdown of RASD1 was confirmed by qPCR and WB (n = 3–4). The protein levels of RASD1 are quantified and shown on the right. (C) Representative ORO staining of the Scramble and shRASD1 cell lines with the corresponding quantification (n = 3, the scale bar shown as 50 μm). (D) Cellular TG contents derived from the Scramble and shRASD1 cell lines (n = 3). (E) Lipidomic analysis further demonstrated that TG synthesis was increased in the LO2 shRASD1 cell line (n = 6). (F) Gene expression of lipid metabolism in the LO2 shRASD1 cell line was measured by qPCR. (G) The quantification of WB detection in the Scramble and shRASD1 cell lines(n = 3). As comparing to Scramble as control, *P < 0.05, **P < 0.01, ***P < 0.001, ****P < 0.0001. Unless otherwise noted, all data presented in the figure are means ± SDs
Fig. 5
Fig. 5
RASD1 modulated cellular lipid metabolism via PI3K/AKT/mTOR pathway. (A,B) WB and the corresponding quantitative analysis of the expression of the pathway in stable cell lines (n = 3). (C, D) Representative ORO staining of the stable cell lines treated with 1 mM FFA with or without inhibitors for 24 h (scale bar shown as 50 μm) and the corresponding quantification (n = 3). (E-F) WB analysis and its quantification results, in the stable cell lines treated in1 mM FFA, with or without inhibitors for 24 h (n = 3). As compared to Vector, *P < 0.05, **P < 0.01, ***P < 0.001, ****P < 0.0001 vs. Vector; As compared to Scramble, £P < 0.05, ££P < 0.01, £££P < 0.001; #P < 0.05, ##P < 0.01, ###P < 0.001, ####P < 0.0001, as compared to RASD1. Unless otherwise noted, all the data presented in the figure are means ± SDs
Fig. 6
Fig. 6
RASD1 knockdown improved MASLD development in vivo. (A) Schematic diagram of the animal study. (B) Hepatic Rasd1 mRNA levels in mice from four groups (n = 5–6). (C) Hepatic RASD1 protein levels and the corresponding quantitative analysis of mice from four groups (n = 3). (D) Representative images showing the gross look of the liver as well as staining of HE, IHC and ORO under microscope (scale bar: 50 μm) of mice from four groups. The quantitative analysis results of IHC and ORO staining are shown on the right (n = 3). (E) Body weights of the mice from four groups (n = 5). (F, G) results of the GTT and ITT detected in different time in the mice assigned to each group (n = 5–6). (H-K) AUC and AOC for the GTT and ITT results (n = 5–6). (L-P) Serum levels of liver function assays and insulin in the mice from four groups (n = 5–6). (Q) TG levels in the mice liver tissues from four groups (n = 5–6). With the NCD group as control comparison, *P < 0.05, **P < 0.01, ***P < 0.001, ****P < 0.0001; With the AAV-shNC/HFD group as control comparison, #P < 0.05, ##P < 0.01, ####P < 0.0001, which are compared to the group. All data presented in the figure are means ± SDs
Fig. 7
Fig. 7
RASD1 knockdown inhibited hepatic DNL-related genes and PI3K/AKT/mTOR signaling but restored the insulin signaling in the HFD-fed mice model. (A-D) WB analysis and corresponding quantification detecting DNL-related genes, PI3K/AKT/mTOR signaling and the insulin signalling in the liver tissues from the NCD, HFD, AAV-shNC/HFD and AAV-shRASD1/HFD groups of mice (n = 3). As are compared to the NCD group, *P < 0.05, **P < 0.01, ***P < 0.001, ****P < 0.0001; #P < 0.05, ##P < 0.01, ###P < 0.0001, which are compared to the AAV-shNC/HFD group. All data shown in the figure are presented as means ± SDs
Fig. 8
Fig. 8
Graphical abstract of this study. Hepatic RASD1 expression is upregulated in MASLD induced by HFD. When hepatic RASD1 is knocked down using AAV, the PI3K/AKT/mTOR signaling is thus inhibited, which prevents MASLD by suppressing DNL-related genes including SREBP1, ACC1, and FASN [Image created using bioRender]

Similar articles

References

    1. Rinella ME, Lazarus JV, Ratziu V, Ratziu V, Francque SM, Sanyal AJ, et al. A multisociety Delphi consensus statement on new fatty liver disease nomenclature. J Hepatol. 2023;79:1542–56. - PubMed
    1. Eslam M, Newsome PN, Sarin SK, Anstee QM, Targher G, Romero-Gomez M, et al. A new definition for metabolic associated fatty liver disease: an international expert consensus statement. J Hepatol. 2020;73:202–9. - PubMed
    1. Miao L, Targher G, Byrne CD, Cao YY, Zheng MH. Current status and future trends of the global burden of MASLD. Trends Endocrinol Metab. 2024;29:S1043. -2760(24)00036 – 5. - PubMed
    1. Calzadilla BL, Adams LA. The natural course of non-alcoholic fatty liver disease. Int J Mol Sci. 2016;17:774. - PMC - PubMed
    1. Badmus OO, Hillhouse SA, Anderson CD, Hinds TD, Stec DE. Molecular mechanisms of metabolic associated fatty liver disease (MAFLD): functional analysis of lipid metabolism pathways. Clin Sci (Lond). 2022;136:1347–66. - PMC - PubMed

MeSH terms

LinkOut - more resources