. 2024 Dec 28;21(1):337.
doi: 10.1186/s12985-024-02611-8.

Transcriptional analysis reveals the suppression of RAD51 and disruption of the homologous recombination pathway during PEDV infection in IPEC-J2 cells

Affiliations

Transcriptional analysis reveals the suppression of RAD51 and disruption of the homologous recombination pathway during PEDV infection in IPEC-J2 cells

Li Sun et al. Virol J. .

Abstract

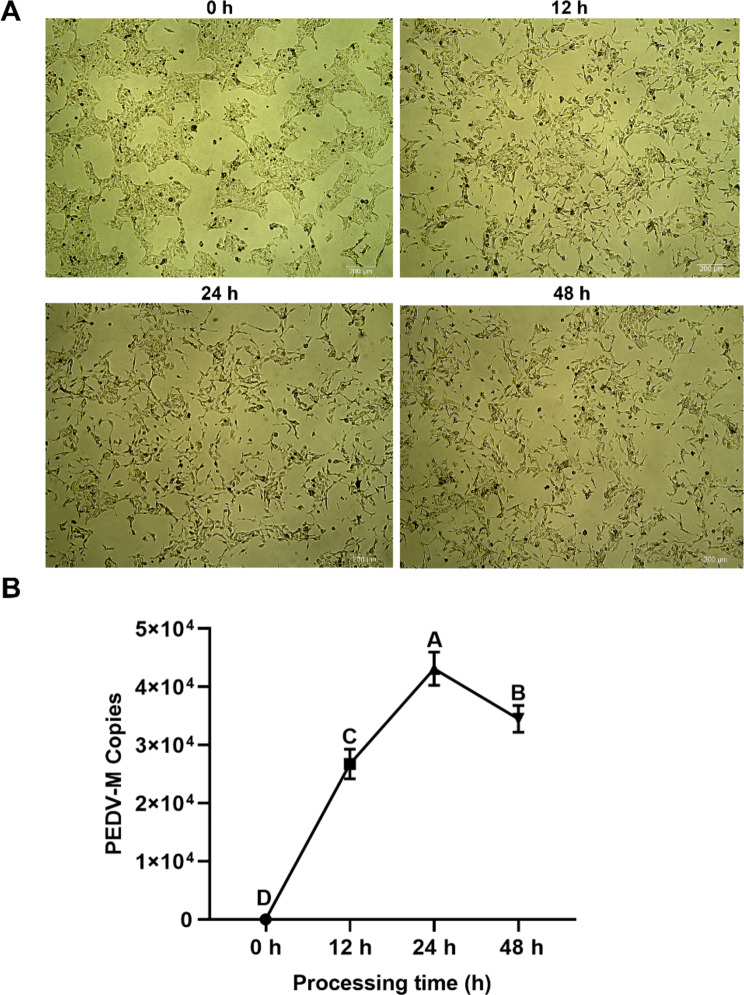
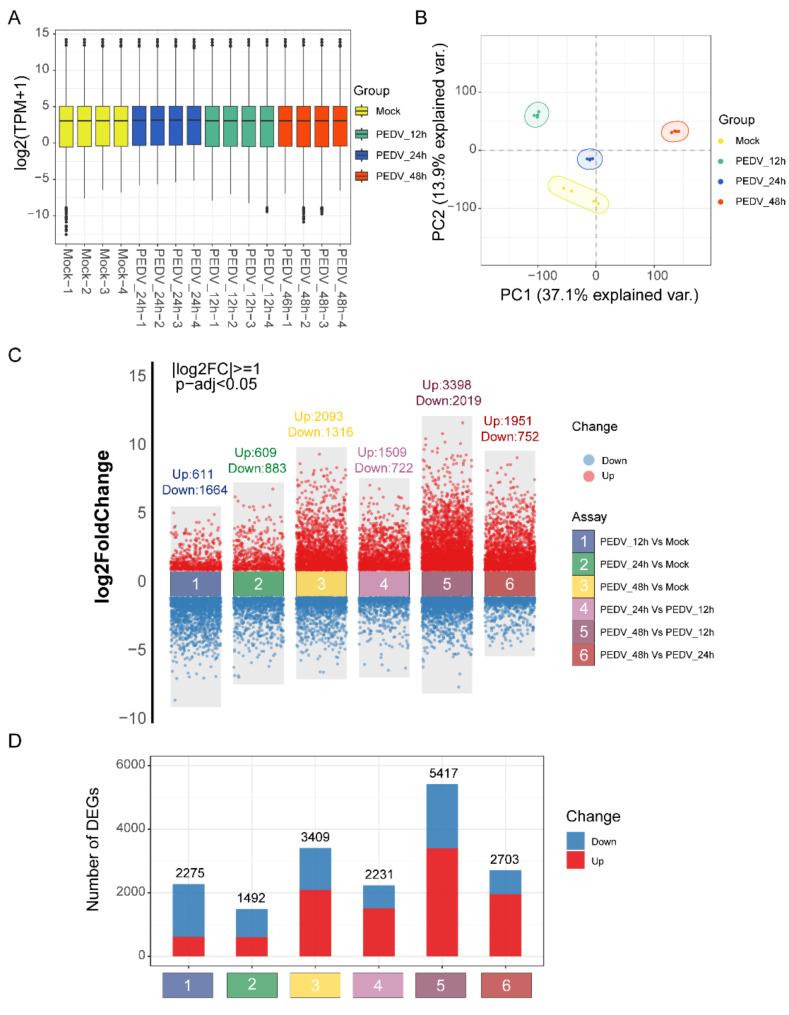
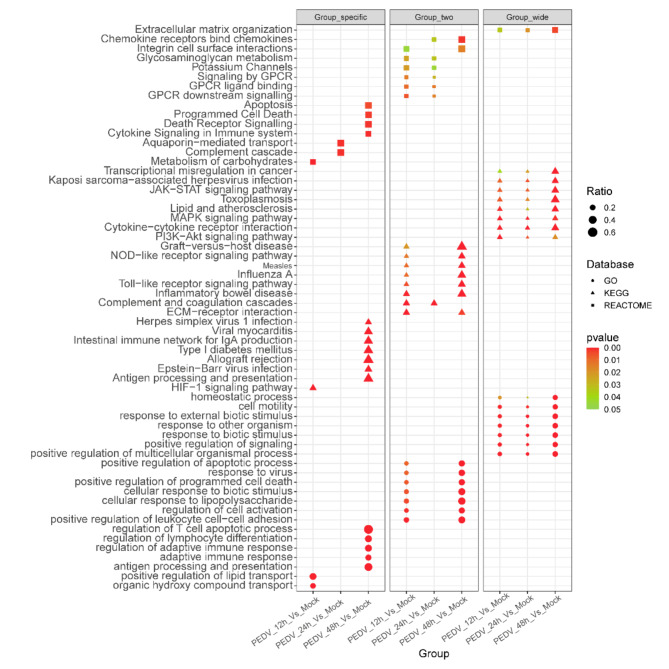
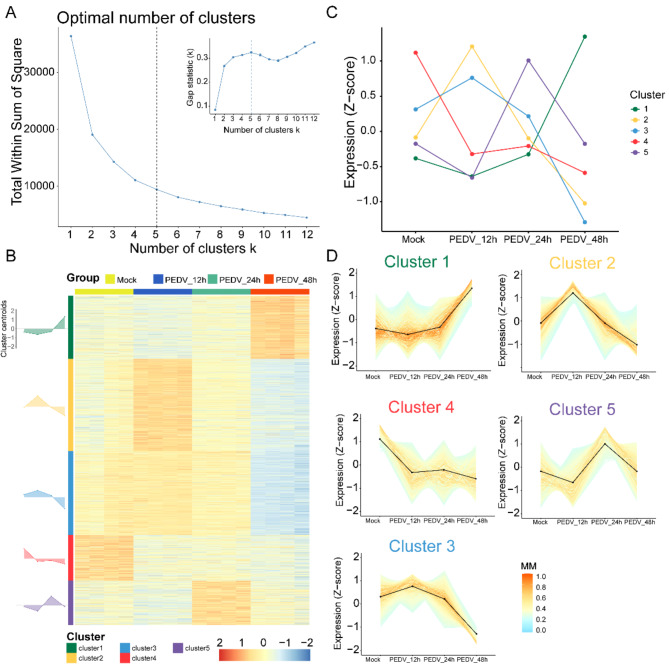
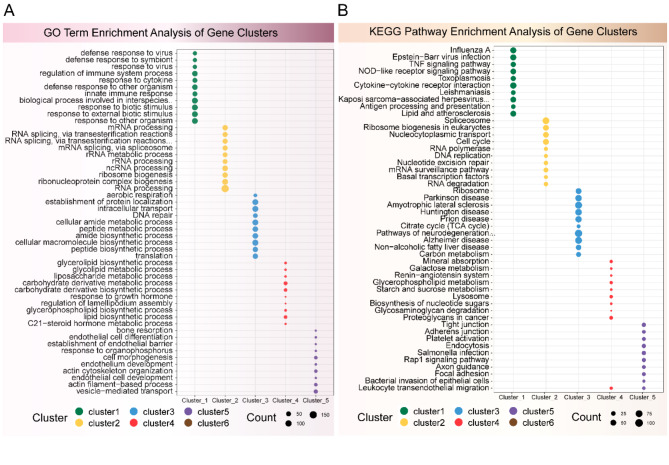
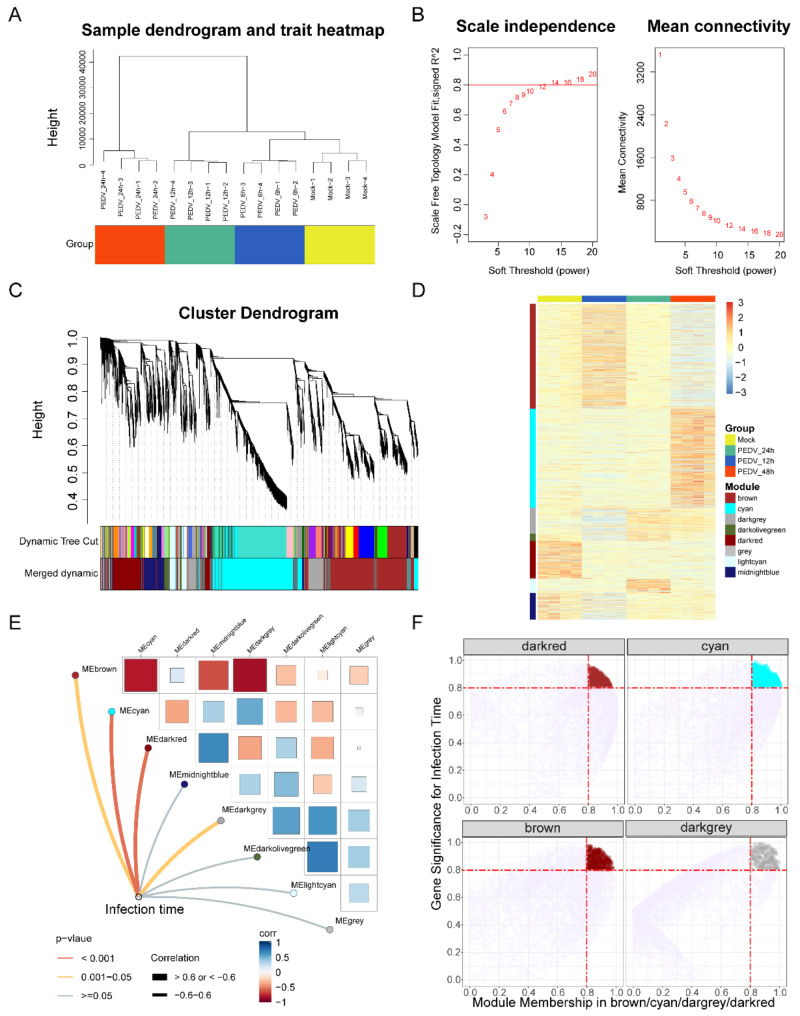
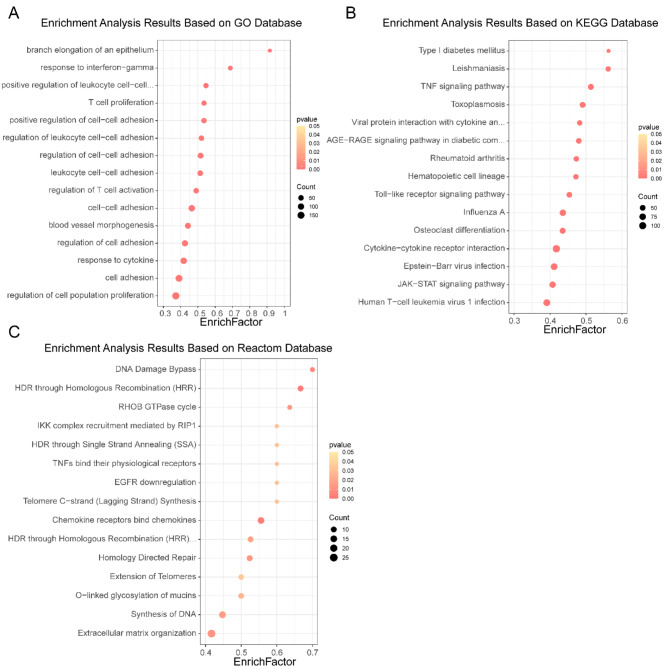
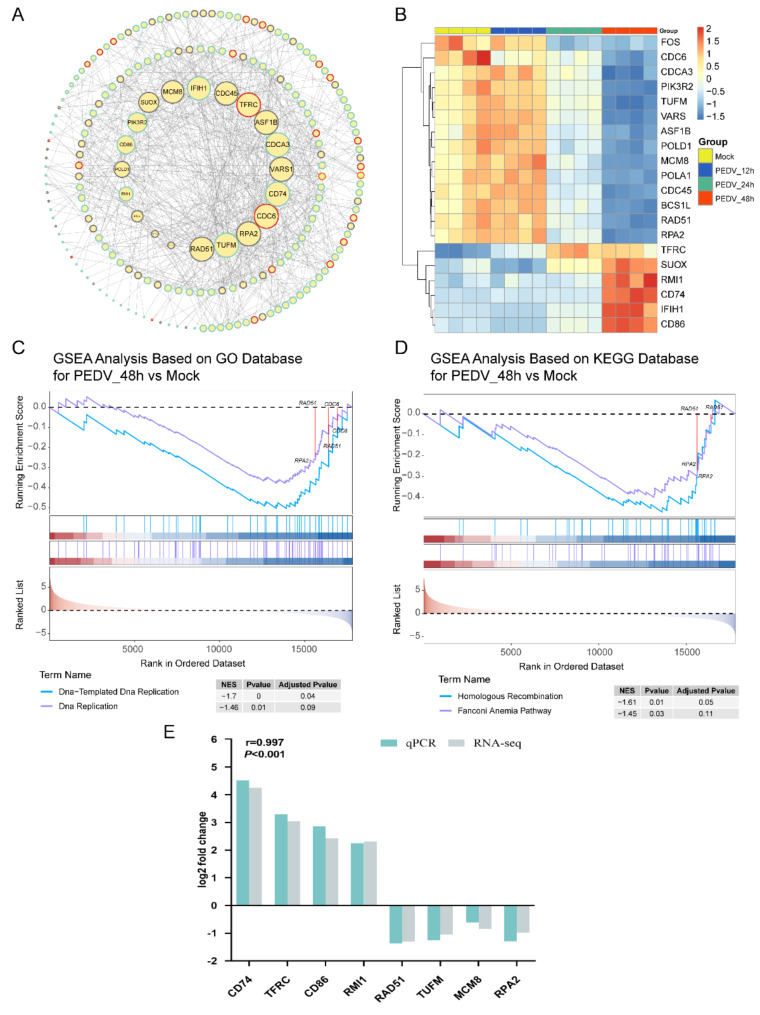
PEDV is a highly contagious enteric pathogen that can cause severe diarrhea and death in neonatal pigs. Despite extensive research, the molecular mechanisms of host's response to PEDV infection remain unclear. In this study, differentially expressed genes (DEGs), time-specific coexpression modules, and key regulatory genes associated with PEDV infection were identified. The analysis revealed 2,275, 1,492, and 3,409 DEGs in infected vs. mock-treated pigs at 12 h, 24 h, and 48 h, respectively. Time series analysis revealed that the upregulated genes were involved mainly in antiviral pathways such as the viral defense response and the regulation of immune system processes. Protein-protein interaction network analysis identified the top 20 core genes in the interaction network, which included six upregulated genes (TFRC, SUOX, RMI1, CD74, IFIH1, and CD86) and 14 downregulated genes (FOS, CDC6, CDCA3, PIK3R2, TUFM, VARS, ASF1B, POLD1, MCM8, POLA1, CDC45, BCS1L, RAD51, and RPA2). In addition, GSEA enrichment analysis revealed that pathways such as DNA replication and homologous recombination involving RAD51, CDC6, and RPA2 were significantly inhibited during viral infection. Our findings not only reveal dynamic changes in the transcriptome profile of PEDV-infected IPEC-J2 cells but also provide novel insights into the mechanism of PEDV infection of the host.

Keywords: DEGs; IPEC-J2; Molecular mechanism; PEDV; Transcriptome.


Conflict of interest statement

Declarations. Ethics approval and consent to participate: Not applicable. Consent for publication: Not applicable. Competing interests: The authors declare no competing interests.

Figures

Fig. 1
Fig. 1
PEDV infection induces damage to IPEC-J2 cells at different time points. (A) Observation under an optical microscope. (B) PEDV copy numbers in IPEC-J2 cells at different time points postinfection. Data are presented as the mean ± SD, n = 3. Different letters indicate significant differences, P < 0.01
Fig. 2
Fig. 2
Analysis of differentially expressed genes. (A) Box plot of log2(TPM) values for mRNAs across different time points. (B) PCA diagram of normalized mRNA expression values illuminating the general relationships among datasets. (C) Differential gene expression results showing up- and downregulated genes in the six comparison groups (12 h vs. Mock, 24 h vs. Mock, 48 h vs. Mock, 24 h vs. 12 h, 48 h vs. 12 h and 48 h vs. 24 h). The threshold used to define the DEGs was a |log2(FC)| >1 and an adjusted p value < 0.05. The blue dots indicate downregulated genes, and the red dots indicate upregulated genes. (D) Histograms of the number of differentially expressed genes
Fig. 3
Fig. 3
GO, KEGG, and REACTOME enrichment analyses. The y-axis represents pathway entries, and the x-axis represents the grouping of differentially expressed genes. The shape of the plot represents different databases, with circles representing the GO database, triangles representing the KEGG database, and squares representing the REACTOME database. The color represents the magnitude of the p value, with redder color indicating a smaller p value. Group Specific: pathways enriched only in the differential genes of a single group. Group Two: pathways enriched in the differential genes of exactly two groups. Group Wide: pathways enriched in the differential genes of exactly three groups
Fig. 4
Fig. 4
Global changes in gene expression across multiple time points. (A) Analysis plot for determining the optimal number of gene clusters on the basis of the total within-cluster sum of squares and the “gap” statistic. (B) Heatmap of genes highlighting the different expression patterns. The colors on the y-axis indicate the different gene expression pattern clusters, whereas the colors on the x-axis indicate the different sample groups. The intensity of the heatmap colors indicates the relative expression levels, with red representing increased expression and blue representing decreased expression. (C) Line plots showing the average gene expression trends for different expression patterns. (D) Line plots of the differential gene expression patterns. The line colors represent the membership of genes in the clusters, with darker red indicating stronger membership and darker blue indicating weaker membership in the respective cluster
Fig. 5
Fig. 5
Enrichment analysis of different gene expression pattern clusters. (A) Enrichment analysis based on the GO database. (B) Enrichment analysis based on the KEGG database. The x-axis represents the different gene expression pattern clusters, and the y-axis indicates the pathway entries. The color of the points also indicates the gene expression pattern clusters. The size of the points represents the number of genes in the indicated pathway, with larger points indicating a greater number of genes
Fig. 6
Fig. 6
WGCNA identified gene coexpression modules at different time points after PEDV infection. (A) Sample clustering tree at different time points postinfection. (B) Selection of the soft-thresholding power (β). The left panel displays the scale-free fit index in relation to the soft-thresholding power. The right panel shows the mean connectivity versus the soft-thresholding power. A power of 14 was chosen because the fit index curve flattens out at higher values (> 0.8). (C) Hierarchical cluster dendrogram of samples at different time points postinfection, showing the coexpression modules generated via WGCNA. Modules belonging to branches are color-coded according to the interconnectedness of genes. Eight modules represented by colors in the horizontal bar were found via a 0.25 threshold for merging. (D) Heatmap showing the gene expression of the 8 modules across the four time points. (E) Relationships between modules and time points after PEDV infection. The correlation heatmap displays the correlations between modules, with the color intensity representing the strength of the correlation. A deeper red color indicates a stronger positive correlation between modules, whereas a deeper blue color indicates a stronger negative correlation. The lines connecting the time points and the 8 modules represent the associations between the traits and the coexpression modules. The line thickness represents the strength of the association, with thicker lines indicating stronger associations. The line colors represent the p values of the associations, with deep red for p < 0.01, orange for 0.01 < p < 0.05, and gray for p > 0.05. (F) Scatter plot of gene significance vs. module membership for modules associated with different postinfection time points. The y-axis represents gene significance, which indicates the degree of association between a gene and the infection time point trait. Genes with high significance may have particularly important biological functions or regulatory roles under specific phenotypic conditions. The x-axis represents module membership, with higher values indicating that a gene expression pattern is more closely correlated with the overall module. The color of the points corresponds to the four modules associated with each time point (deep red, cyan, brown, and dark gray)
Fig. 7
Fig. 7
Enrichment analysis of genes within coexpression modules associated with PEDV infection time. (A) Bubble plot of the GO enrichment analysis results. (B) Bubble plot of the KEGG enrichment analysis results. (C) Bubble plot of the Reactome enrichment analysis results. The x-axis represents the enrichment factor, which is the ratio of the number of DEGs in a pathway to the total number of genes in that pathway. The size of the dots represents the number of genes, with larger dots indicating a greater number of genes. The color of the dots represents the magnitude of the p value
Fig. 8
Fig. 8
Protein interaction network revealing core genes and GSEA enrichment analysis. (A) Protein–protein interaction network. The size of the nodes represents the importance of the genes in the protein interaction network, with larger nodes indicating proteins with more interaction partners. The top 20 core genes are labeled. (B) Heatmap of the top twenty core genes. The colors of the horizontal axis represent different sample groups. The depth of color in the heatmap represents the level of expression, with red indicating high gene expression and blue indicating low gene expression. (C-D) GSEA enrichment analysis plot. The x-axis represents the ranking of gene sets, with the ranking decreasing from left to right, whereas the y-axis represents the enrichment score. The enrichment score curve shows the degree of enrichment of a gene set during the PEDV infection process, with a larger absolute value of the curve peak indicating a greater degree of enrichment of the gene set during the PEDV infection process. (E) Bar plot of the fold change in core gene RNA-seq and qPCR expression. The y-axis shows the log2FoldChange, and the x-axis indicates the analyzed gene. Data are presented as the mean ± SD, n = 3

Similar articles

References

    1. Jung K, Annamalai T, Lu Z, Saif LJ. Comparative pathogenesis of US porcine epidemic diarrhea virus (PEDV) strain PC21A in conventional 9-day-old nursing piglets vs. 26-day-old weaned pigs. Vet Microbiol. 2015;178:31–40. 10.1016/j.vetmic.2015.04.022. - PMC - PubMed
    1. Cavanagh D. Nidovirales: a new order comprising Coronaviridae and Arteriviridae. Arch Virol. 1997;142:629–33. - PubMed
    1. Pensaert MB, de Bouck P. A new coronavirus-like particle associated with diarrhea in swine. Arch Virol. 1978;58:243–7. 10.1007/bf01317606. - PMC - PubMed
    1. Cheun-Arom T, Temeeyasen G, Tripipat T, Kaewprommal P, Piriyapongsa J, Sukrong S, Chongcharoen W, Tantituvanont A, Nilubol D. Full-length genome analysis of two genetically distinct variants of porcine epidemic diarrhea virus in Thailand. Infect Genet Evol. 2016;44:114–21. 10.1016/j.meegid.2016.06.046. - PMC - PubMed
    1. Davies PR. The dilemma of rare events: Porcine epidemic diarrhea virus in North America. Prev Vet Med. 2015;122:235–41. 10.1016/j.prevetmed.2015.08.006. - PMC - PubMed

Publication types

MeSH terms

Substances

LinkOut - more resources