. 2025 Jun 21;27(5):1210-1226.
doi: 10.1093/neuonc/noae280.

Autophagy modulates glioblastoma cell sensitivity to Selinexor-mediated XPO1 inhibition

Affiliations

Autophagy modulates glioblastoma cell sensitivity to Selinexor-mediated XPO1 inhibition

Yongjian Tang et al. Neuro Oncol. .

Abstract

Background: Selinexor is a selective inhibitor of exportin-1 (XPO1), a key mediator of the nucleocytoplasmic transport for molecules critical to tumor cell survival. Selinexor's lethality is generally associated with the induction of apoptosis, and in some cases, with autophagy-induced apoptosis. We performed this study to determine Selinexor's action in glioblastoma (GBM) cells, which are notoriously resistant to apoptosis.

Methods: Patient-derived GBM cells were treated with Selinexor, and drug response and autophagy levels were monitored. Homozygous C528S XPO1 mutant GBM43 cells were generated by CRISPR/Cas9 editing. Single Selinexor or combination treatment with autophagy inhibitors was evaluated. In addition, bulk-tissue, single-cell, and spatial transcriptome were analyzed, and molecular docking was performed.

Results: Although all cell lines exhibited a dose- and time-dependent reduction of cell viability, the most profound molecular response to Selinexor was induction of autophagy instead of apoptosis. Selinexor-induced autophagy was an on-target consequence of XPO1 inhibition, and could be mitigated by expression of a mutant, Selinexor-resistant form of XPO1, and Selinexor-induced autophagy was related at least in part to nuclear trapping of the transcription factor TFEB. Furthermore, genetic or pharmacologic suppression of autophagy sensitized the cells to Selinexor-induced toxicity in association with the induction of apoptosis. Finally, in intracranial PDX studies, the combination of Selinexor with the autophagy inhibitor chloroquine significantly impeded tumor growth and extended mouse survival relative to single-agent treatment.

Conclusion: These results suggest that activation of autophagy confers a protective mechanism against Selinexor in GBM cells, and that the combination of Selinexor with autophagy inhibitors may serve as a viable means to enhance Selinexor-induced cell death.

Keywords: Selinexor; XPO1; autophagy; glioma; nuclear export.


Conflict of interest statement

The authors have no conflicts of interest to declare.

Figures
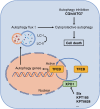
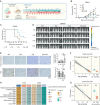
Graphical Abstract
Graphical Abstract
Autophagy provides a defense mechanism against the lethality of Selinexor and the combination of Selinexor with inhibitors of autophagy may be a viable means to increase cell death in glioblastoma cells caused by Selinexor.
Figure 1.
Figure 1.
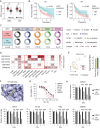
Selinexor’s target XPO1 has glioma clinical significance and glioblastoma cells exhibit Selinexor sensitivity. (A) The expression of XPO1 mRNA in glioma (n = 163 in glioblastoma (GBM) and n = 518 in low-grade glioma (LGG)) and normal tissues (n = 207) based on GEPIA2.0. (B) Kaplan-Meier survival analysis of gliomas with high (n = 174) and low XPO1 (n = 173) mRNA expression in the Cancer Genome Atlas (TCGA) dataset. (C) Tumor grades and subtypes in gliomas with high (n = 163) and low (n = 163) XPO1 mRNA expression in TCGA dataset. (D) The expression of XPO1 mRNA across distinct cell types within the single-cell RNA sequencing (scRNA-seq) datasets. (E) The expression of XPO1 mRNA in tumor core or periphery from GBMSeq portal. (F) The visualization of molecular docking between XPO1 protein and XPO1 inhibitors KPT-330 (Selinexor, Slx). (G) Cell viability (CellTiter-Glo) of GBM cell lines (GBM43, LN229, SF188, T98G, GBM39) following 72 h continuous incubation with varying concentrations of the XPO1 inhibitor Selinexor. (H) Viable number of cells (relative to controls) monitored daily during continuous exposure to IC50 concentrations of Selinexor as in panel G. All values are normalized to controls and are the means + standard deviation of 3 experiments done in triplicate. Survival metrics (OS, Overall survival; PFI, Progression-free interval). Subtype (CL, Classic; MES, Mesenchymal; PN, Pro-neural; NE, Neural). *P ≤ .05; **P ≤ .01; ***P ≤ .001.
Figure 2.
Figure 2.
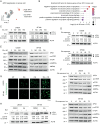
Selinexor increases autophagic flux in glioblastoma cell lines. (A) UMAP plot of GBM cells with high and low XPO1 mRNA expression in scRNA-seq datasets from Tumor Immune Single-cell Hub 2 (TISCH2) platform. (B) Gene Ontology (GO) enrichment of feature genes in the low XPO1 GBM cells presented in panel A. (C, D) Representative Western blot analysis of LC3B (LC3B-I), phosphatidylethanolamine-conjugated LC3B (LC3B-II), and ACTIN levels in LN229 and SF188 cells incubated with varying concentrations of Selinexor (Slx, 0–750 nM) for 48 h (C), or with fixed concentrations of Slx (250 nM in LN229 and SF188 cells) for varying times (D). LC3B-II/LC3B-I ratios in control cells were normalized to 1 and LC3B-II/I ratios in experimental groups were expressed relative to their matched control. (E, F) Representative Western blot analysis of XPO1, mTOR, p-mTOR, AMPKα, p-AMPKα, and ACTIN dose- (72 h, E) and time- (250 nM Selinexor, F) responses in LN229 and SF188 cells. (G) Representative immunofluorescence analysis of LN229 and SF188 cells stained with a dye that selectively identifies autophagosomes following incubation with Selinexor (250 nM, 48 h), chloroquine (CQ, 3 µM, 48 h), or both Selinexor and CQ. Scale bar, 50 um. (H) Representative Western blot analysis of LC3B (LC3B-I), phosphatidylethanolamine-conjugated LC3B (LC3B-II), and ACTIN levels in LN229 and SF188 cells incubated for 72 h with vehicle or Selinexor (250 nM for LN229 and SF188) and/or Bafilomycin (Baf, 200 nM, last 2 h).
Figure 3.
Figure 3.
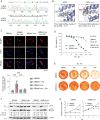
Enhanced autophagic flux is an on-target effect of Selinexor in glioblastoma cells. (A) DNA sequence read from GBM43 cells (bottom) and GBM43 cells in which a CRISPR knock-in approach (top) encoding C528S mutant (mut) XPO1. (B) The visualization (top) and lowest bind energy (bottom) of molecular docking between Selinexor (Slx) and XPO1 wildtype/mut protein. (C) Representative immunofluorescence analysis (top) and quantitation (bottom) of GBM43 and GBM43mut cells incubated for 24 h with 0 or 1000 nM Selinexor, then analyzed for RanBP1 co-localization with nuclear DAPI staining (10–15 cells/group). (D) (Left) cell viability (normalized to control cells) of GBM43 and GBM43mut cell lines following 72 h continuous incubation with varying concentrations of Selinexor, and (right) IC50 values of Selinexor for GBM43 and GBM43mut cell lines. (E) Representative photos of clonogenic assays performed using GBM43 and GBM43mut cells continuously exposed to 0, 100, 200, or 400 nM Selinexor for 14 days. (F) Representative Western blot analysis of LC3B-I, LC3B-II, and ACTIN levels in GBM43 and GBM43mut cells lines incubated with DMSO, Selinexor (750 nM, 72 h) or rapamycin (500 nM, 16 h), or with non-targeted siRNA or a pool of siRNA targeting XPO1 (48 h after a 24-h siRNA incubation). (G) Viable number of GBM43 and GBM43mut cells (normalized to control cells) monitored daily after incubation with non-targeted siRNA or a pool of siRNA targeting XPO1 as in (F). Except where noted, all quantitated values listed are the means of 3 experiments. CYS, Cysteine; SER, Serine. ***, P ≤ .001.
Figure 4.
Figure 4.
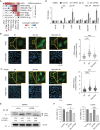
Nuclear sequestration of TFEB contributes to Selinexor-induced increased autophagic flux. (A) Correlational analysis between the activity scores of autophagy transcription factors (TFs) and XPO1 mRNA expression levels in GBM cells within scRNA-seq datasets. Arrow represents the selected autophagy TF with its activity score showing the strongest negative correlation to XPO1 mRNA expression. (B, C) Representative immunofluorescence images of GBM43 (B) and LN229 (C) cells stained with antibody to TFEB (top) or also with DAPI (bottom) following incubation in serum-free media (starvation, 4 h) or with Selinexor (Slx, 0 or 750 nM, 24 hours). In top panels the large yellow box is a 16× magnification of the smaller boxed area. Scale bar, 50 µm. Right panels (B, C), quantitation of the ratio of TFEB nuclear staining to TFEB cytoplasmic staining (> 200 cells per group in LN229 cells, > 100 cells per group in GBM43 cells). (D) Mean ± standard deviation of RNA expression levels of the indicated genes, normalized to controls, in GBM43 cells 72 h after incubation with siRNA targeting TFEB (24 h) and/or a 48-h exposure to 750 nM Selinexor as determined by triplicate qPCR analysis. (E) Representative Western blot of LC3B-I, LC3B-II, and ACTIN in cells from panel D. (F) Cell viability (normalized to control cells) of LN229 and GBM43 cells 72 h after incubation with siRNA targeting TFEB (24 h) and/or a 48-h exposure to 200nM Selinexor. All quantitated values listed are the means of 3 experiments. *P ≤ .05; **P ≤ .01; ***P ≤ .001.
Figure 5.
Figure 5.
Inhibition of autophagy increases Selinexor-induced cytotoxicity and apoptosis and Selinexor sensitivity in glioblastoma cells. (A) Representative Western blot analysis of ATG7, LC3B-I, LC3B-II, and ACTIN levels in GBM43 and LN229 cells 72 h after incubation with siRNA targeting ATG7 (24 h) and/or a 48-h exposure to 250 nM or 750 nM Selinexor (Slx). (B) Cell viability (normalized to controls) of GBM43 and LN229 cells 72 h after incubation with 0–6 µM CQ and the listed concentration of Selinexor. (C, D) Plots of combination index (CI) values (C) and HSA synergy scores (D) generated from the data in panel B and Supplementary Figure S5C (6 µM CQ values). (E) Representative photos of clonogenic assays performed using GBM43 and LN229 cells continuously exposed to 0 or 100 nM Selinexor plus 0 or 3 µM CQ for 14 days. (F) Representative flow cytometric analysis of the percentage of listed cells staining positively for both annexin V and PI after incubation with 3 µM CQ and 750 or 250 nM Selinexor (96 h), respectively. (G) Representative immunofluorescence analysis of LN229 cells from (F) staining with both annexin V and PI (arrows). (H) UMAP plot of Selinexor-sensitive and Selinexor-resistant GBM cells evaluated by PRISM in scRNA-seq datasets. (J) Comparison of CQ responses assessed by Beyondcell between Selinexor-sensitive and Selinexor-resistant GBM cells from panel H.
Figure 6.
Figure 6.
The Selinexor/CQ combination improves the survival of glioblastoma mice and the prognosis prediction for glioma patients when compared with single-agent treatment. (A) Flowchart of the in vivo experiments of intracranially-implanted GBM39 cells. (B) Growth of intracranially implanted GBM39 cells in vehicle (NT), Selinexor (Slx), CQ, or Selinexor plus CQ treated mice as measured by bioluminescence imaging. Arrow indicates the start of drug dosing. (C) Kaplan-Meier curves showing the cumulative survival probabilities for the mice in panel B. (D) Bioluminescence imaging data overlayed on actual mice from panel B at days 9, 16, 19, and 26 following implantations. (E) (left) 40X images of representative fixed sections derived from mice in panel B 30 days after implantation and stained with antibodies recognizing cleaved caspase 3 or Ki67. (Right), quantitation of the percentage of positively-stained cells derived from 2–4 random fields, 3 sections per group. (F, G) Correlation between Selinexor sensitivity and CQ sensitivity and the difference of CQ sensitivity in the Selinexor sensitivityhigh and Selinexor sensitivitylow glioma patients in the TCGA (n = 70, F) and CGGA (n = 32, G) datasets after propensity score matching (PSM). (H) List of ensemble machine learning algorithms to predict OS in glioma patients based on Selinexor/CQ combination sensitivity or single-agent sensitivity, using a 10-fold cross-validation methodology. The C-index of each model was computed using a TCGA training dataset (n = 650) and a CGGA validating dataset (n = 313). *P ≤ .05; **P ≤ .01; ***P ≤ .001.

References

    1. Ohno M, Fornerod M, Mattaj IW.. Nucleocytoplasmic transport: the last 200 nanometers. Cell. 1998;92(3):327–336. - PubMed
    1. Fukuda M, Asano S, Nakamura T, et al. CRM1 is responsible for intracellular transport mediated by the nuclear export signal. Nature. 1997;390(6657):308–311. - PubMed
    1. Fu SC, Huang HC, Horton P, Juan HF.. ValidNESs: a database of validated leucine-rich nuclear export signals. Nucleic Acids Res. 2013;41(Database issue):D338–D343. - PMC - PubMed
    1. Wickramasinghe VO, Laskey RA.. Control of mammalian gene expression by selective mRNA export. Nat Rev Mol Cell Biol. 2015;16(7):431–442. - PubMed
    1. Kim J, McMillan E, Kim HS, et al. XPO1-dependent nuclear export is a druggable vulnerability in KRAS-mutant lung cancer. Nature. 2016;538(7623):114–117. - PMC - PubMed

MeSH terms