. 2025 Feb;12(7):e2412229.
doi: 10.1002/advs.202412229. Epub 2024 Dec 27.

Action Potential Firing Patterns Regulate Dopamine Release via Voltage-Sensitive Dopamine D2 Autoreceptors in Mouse Striatum In Vivo

Affiliations

Action Potential Firing Patterns Regulate Dopamine Release via Voltage-Sensitive Dopamine D2 Autoreceptors in Mouse Striatum In Vivo

Xiaoxuan Sun et al. Adv Sci (Weinh). 2025 Feb.

Abstract

Dopamine (DA) in the striatum is vital for motor and cognitive behaviors. Midbrain dopaminergic neurons generate both tonic and phasic action potential (AP) firing patterns in behavior mice. Besides AP numbers, whether and how different AP firing patterns per se modulate DA release remain largely unknown. Here by using in vivo and ex vivo models, it is shown that the AP frequency per se modulates DA release through the D2 receptor (D2R), which contributes up to 50% of total DA release. D2R has a voltage-sensing site at D131 and can be deactivated in a frequency-dependent manner by membrane depolarization. This voltage-dependent D2R inhibition of DA release is mediated via the facilitation of voltage-gated Ca2+ channels (VGCCs). Collectively, this work establishes a novel mechanism that APs per se modulate DA overflow by disinhibiting the voltage-sensitive autoreceptor D2R and thus the facilitation of VGCCs, providing a pivotal pathway and insight into mammalian DA-dependent functions in vivo.

Keywords: action potential; auto‐inhibition; dopamine receptor 2; dopamine release in vivo; firing pattern.


Conflict of interest statement

The authors declare no conflict of interest.

Figures

Figure 1
Figure 1
Modulation of dopamine release by GPCR‐D2R autoreceptor is dependent on the frequency of action potentials in mouse striatum in vivo. A) Diagram of the experimental setup (left) of real‐time recording of action potential (AP)‐induced DA overflow [DA] (right) in a mouse striatum in vivo (see the Experimental Section). Right, a typical amperometric recording (I amp) of [DA] following 36 E‐stim pulses at 80 Hz at the MFB. The amplitude and charge are defined to quantify the [DA]. B) DA transmission model in a striatal terminal. DA release is evoked by Ca2+ influx through voltage‐gated Ca2+ channels (VGCCs) opened by the APs. The released DA in turn targets the presynaptic D2R auto‐receptor to regulate DA release. C,D) Pharmacology in WT‐mice, with the low (C, [20 Hz, 36 P]) or high (D, [80 Hz, 36 P]) frequency AP‐pattern stimuli at the MFB by the D2R‐antagonist haloperidol (HP, 0.4 mg kg−1, i.p.) and subsequent D2R‐agonist quinpirole (QP, 8 mg kg−1, i.p.) [One‐way ANOVA, post hoc Tukey's multiple comparisons test; (C) and (D) were from the same nine mice]. E,F) Typical traces and statistics of E‐stim (20 Hz vs 80 Hz)‐evoked DA release in WT or D2R‐KO mice pre‐ and post‐HP treatment [paired Student's t‐test for (E) and (F), n = 9 for each group]. G) Statistics of DA release in WT and D2R‐KO mice show significant difference at Estim 20 Hz but not 80 Hz (Welch's t‐test, n = 9 for each group). H) AP frequency‐dependence of [DA] ratio (HP/Ctrl) in WT versus D2R‐KO mice at different frequencies. Increasing AP frequency from 20 to 100 Hz gradually reduces HP/Ctrl in WT mice (black line), but not in D2R‐KO mice (gray line), indicating that (1) the effect of HP on [DA] is via D2R; (2) the D2R modulation of [DA] depends on AP frequency in vivo (two‐way ANOVA test; n = 9 for each group). Data are presented as the mean ± SEM. **p < 0.01, ***p < 0.001; p > 0.05, n.s., not significant.
Figure 2
Figure 2
The modulation of AP‐evoked DA release and I Ca are frequency‐dependent in WT but not D2R‐KO striatal slices. A) Diagram of real‐time DA recording in striatal slice. Coronary slices (300‐µm thick) were cut from the caudate putamen (CPu) or striatum region of the mouse brain and are bathed in 1 × 10⁻⁶ m DHβE to block the CTDT pathway (for details see Figure S9, Supporting Information). A stimulating electrode is used to generate different AP patterns and trigger DA release. The evoked DA signals are recorded by the CFE (200‐µm long). Drugs are delivered to the slices via a puffing system. B,C) In WT mice, representative traces of evoked DA release before and after D2R agonist QP (0.5 × 10⁻⁶ m) treatment with E‐stim patterns of 6 pulses at 2 Hz versus 6 pulses at 100 Hz. The enlarged insets show details of DA signals by 6 pulses (P1–P6) of E‐stim. D,E) Same as (B) and (C) but in D2R‐KO mice. F,G) Typical traces of QP inhibition on I Ca with or without a prepulse depolarization effect in WT and D2R‐KO DA neurons. H) Statistics of (B) and (C) showing the effect of QP on total DA release (sum of I P1 + I P2 +…+ I P6) at two E‐stim frequencies: [2 Hz 6 P] versus [100 Hz 6 P] (paired Student's t‐test, ***p < 0.001, n = 11 slices from 5 mice). I) Statistics showing that a prepulse depolarization (100 mV, 100 ms) mostly removed the blockade effect of QP on I Ca in WT DA neurons (QP inhibition on I Ca ratio, P−: 25.54% ± 2.70% vs P+: 11.36% ± 1.18%, paired Student's t‐test, p < 0.001, n = 14 cells). J) Statistics of (D) and (E). QP does not alter DA release at both AP frequencies, indicating that the AP frequency‐dependence of the D2R modulation of DA release is abolished in D2R‐KO slices (paired Student's t‐test, p = 0.31, n.s., not significant, n = 10 slices from 4 mice). K) Statistics showed no effect of prepulse depolarization on I Ca in D2R‐KO DA neurons (QP inhibition on I Ca ratio, P−: 1.64% ± 1.28% vs P+: 1.78% ± 1.16%, paired Student's t‐test, p = 0.9120, n = 14 cells). Data are presented as the mean ± SEM. ***p < 0.001; p > 0.05, n.s., not significant.
Figure 3
Figure 3
The voltage dependence of D2R is validated in native secretary adrenal chromaffin cells (ACCs) overexpressing D2R. A) Diagram of combined patch‐clamp and CFE recordings in an ACC over‐expressing D2R. ACCs were bathed in 2 × 10⁻⁶ m QP and 0 Ca2+ extracellular solution, and whole‐cell dialysis with 1 × 10⁻³ m intracellular Ca2+ in the patch pipette was used to trigger quantal release, which can be real‐time recorded by a CFE as I amp current. Simultaneously, through the whole‐cell patch‐clamp, two AP frequencies (1 Hz vs 20 Hz) stimulus were used to depolarize the ACCs during quantal vesicular release. Dashed boxes show a single AP waveform (left) and an averaged quantal spike signal (right), respectively. B) A representative amperometric recording of vesicle quantal release (I amp, lower trace) evoked by the stimulation protocol shown in panel A in ACCs transfected with GFP control plasmid (ACC‐Ctrl). Insets show the averaged quantal size (QS) corresponding to three periods of stimulation at [1 Hz 30 s] (gray) versus [20 Hz 30 s] (blue). C) Same as (B) but in ACCs transfected with D2R plasmid (ACC‐D2R). D) Statistics of normalized QS. For ACC‐Ctrl, statistics show that QS does not change significantly during 1 Hz versus 20 Hz stimulation. For ACC‐D2R, statistics show that high frequency (20 Hz) significantly increases QS compared to low frequency (1 Hz) (one‐way ANOVA test, post hoc Tukey's multiple comparisons test, p > 0.05, n.s.; **p < 0.01, n = 16 cells for ACC‐Ctrl and n = 12 cells for ACC‐D2R). e) Statistics of the quantal release amplitude during 1 Hz versus 20 Hz stimulation in ACCs transfected with control (ACC‐Ctrl) or D2R‐expressing (ACC‐D2R) plasmid. (One‐way ANOVA, post hoc Tukey's multiple comparisons test, p > 0.05, n.s., not significant, n = 16 cells for ACC‐Ctrl and n = 12 cells for ACC‐D2R). Data are presented as the mean ± SEM. **p < 0.01, ***p < 0.001; p > 0.05, n.s., not significant.
Figure 4
Figure 4
A D2R voltage‐sensing site (D131) as revealed with a reconstituted GIRK system overexpressing D2R. A) Left, cartoon illustration of the D2R‐Gi‐βγ‐GIRK current assay. GIRK1/4 and D2R plasmids are co‐expressed in HEK293A cells, and the D2R agonist QP activates the D2R‐Gi pathway to induce GIRK current (I GIRK) in 140 × 10−3 m KCl (140K) solution. Right, Whole‐cell recording of I GIRK following 10 and 500 × 10−9 m QP treatment (ΔI 10 and ΔI 500 are I GIRK induced by 10 and 500 × 10−9 m QP). Note, I GIRK is larger at 500 × 10−9 m that at 10 × 10−9 m QP. B) Left, I GIRK evoked by 10 or 500 × 10−9 m QP measured at a holding Vm of −40 or −100 mV in cells co‐expressing D2R‐WT and GIRK1/4. The I GIRK ratio is defined as γ(Vm) = ΔI 10I 500 = I GIRK (10 × 10−9 m)/I GIRK (500 × 10−9 m). Right, statistics of γ(Vm) at the two holding potentials. γ(Vm) is potentiated at −100 mV versus −40 mV (***p < 0.001, Wilcoxon test, n = 62 cells). C) Similar to panel (B), but here in cells with D2R‐D131N mutation and GIRK1/4 co‐expression. The γ(Vm) shows no significant difference at Vm of −40 and −100 mV (p  = 0.19, n.s., not significant, Wilcoxon test, n = 43 cells). D) Log [QP] − normalized I GIRK curves for D2R‐WT (left) and D131N (right) at holding potentials of −40 and −100 mV; the EC50 of QP for WT and D131N are calculated by fitting from log [agonist] versus normalized IGIRK (normalized to I GIRK evoked by 1000 × 10−9 m QP) responses. The dose‐dependent curve of the WT at −40 mV is significantly right shifted than at −100 mV (n = 17 cells) but not D131N (n = 26 cells), indicating that D2R‐WT is Vm‐dependent, while D131N mutation abolishes the initial Vm‐dependence. Inset, cartoon showing the D2R topology and positions of those transmembrane, charged and conserved amino acids in D2R, including D80, D114, and DRY motif‐D131and R132. D131 is identified as the voltage‐sensor in D2R by the reconstituted GIRK system via screening. Data are presented as the mean ± SEM (B, C). ***p < 0.001; p > 0.05, n.s., not significant.
Figure 5
Figure 5
The D2R voltage‐sensing site (D131) validated by quantal vesicle release in reconstituted adrenal chromaffin cells (ACCs). A) Left, representative amperometric recordings (I amp) of quantal vesicle release triggered by 20 × 10−3 m caffeine (Caf) in ACCs overexpressing D2R‐WT (ACC‐D2R WT) bathed in 2 × 10⁻⁶ m QP and 0 Ca2+ solution. Insets show the averaged quantal size (QS) in each recording. Right, statistics of normalized QS. Results show that depolarization induced by 70 × 10−3 m KCl (70K) notably increases QS and the increment is abolished when 70K is removed (**p < 0.01, Friedman test, post hoc Dunn's multiple comparisons test, n = 21 cells). B) Similar to panel (A), but in RACCs overexpressing the D2R‐D131N mutation (ACC‐D2R‐D131N). Statistics show that the normalized QS does not change during 70K‐induced depolarization (p  = 0.25, n.s., not significant, Friedman test, post hoc Dunn's multiple comparisons test, n = 21 cells). C) Representative amperometric recording (left) and statistics (right) of quantal vesicle release triggered by whole‐cell dialysis of 1 × 10⁻³ m Ca2+ at 1 and 20 Hz AP frequency stimulation in ACC‐D2R‐WT cells bathed in QP. Insets show the averaged QS corresponding to the different AP frequencies. A high frequency (20 Hz) markedly increases QS compared to a low frequency (1 Hz) (**p < 0.01, one‐way ANOVA, post hoc Tukey's multiple comparisons test, n = 14 cells). D) Similar to panel (C), but in cells with the D2R mutation ACC‐D2R‐D131N. Normalized QS shows no difference between 1 and 20 Hz (p  = 0.96, n.s., not significant, one‐way ANOVA, post hoc Tukey's multiple comparisons test, n = 12 cells). Data are presented as the mean ± SEM (A–D). **p < 0.01; p > 0.05, n.s., not significant.
Figure 6
Figure 6
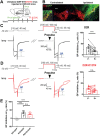
Validation of D2R‐D131 as voltage‐sensing site mediating the calcium channel facilitation in the striatum in situ. A) Diagram of unilateral injection of D2R‐WT and D131N AAV into the SNpc of D2R‐KO mice. Four weeks after virus injection, the anterograde AAV infects both the DA somata (SNpc) and terminal (striatum) areas. B) TH immunostaining (red) in contralateral/ipsilateral (without/with AAV) SNpc slice of a D2R‐KO mouse (scale bar, 200 µm). Inset, enlargement of demarcated SNpc region (scale bar, 50 µm). C,D) Representative traces and statistics showing the inhibitory effect of QP on I Ca with or without prepulse depolarization in D2R‐KO mice overexpressing D2R (C) or D2R‐D131N (D). D2R rescued both the inhibitory effect of QP on I Ca and the prepulse relieving of QP‐inhibition, while the neutralized D131N‐D2R mutant failed to rescue the alleviation effect (QP inhibition on I Ca ratio, for D2R, P−: 33.26% ± 5.180% vs P+: 17.14% ± 3.033%; for D2R‐D131N, P−: 24.42% ± 3.332% vs P+: 19.00% ± 2.835%; paired Student's t‐test, n = 12 for D2R, n = 17 for D131N). E) Statistics showing that both D2R and mutant D131N similarly rescued the inhibitory effect of QP on I Ca compared to D2R‐KO (QP inhibition on I Ca ratio, GFP: −9.098% ± 4.795% vs D2R: 33.26% ± 5.180% vs D2R‐D131N: 24.42% ± 3.332%; one‐way ANOVA test, n = 12 for GFP, n = 12 for D2R, n = 17 for D131N). Data are presented as the mean ± SEM. ***p < 0.001; p > 0.05, n.s., not significant.
Figure 7
Figure 7
Validation of D2R‐D131 as voltage‐sensing site mediating activity‐dependent modulation of DA release in the striatum in vivo. A) Representative amperometric recordings and statistics of evoked [DA] in vivo before and after HP treatment at 20 and 80 Hz E‐stim in D2R‐KO mice overexpressing control virus tagged with GFP (Blank ctrl). B) Similar to panel (A), but in D2R‐KO mice overexpressing D2R‐WT virus (D2R‐WT‐rescue). C) Similar to panel (B), but in D2R‐KO mice overexpressing D2R‐D131N virus (D2R‐D131N‐rescue). D) AP frequency‐dependence of [DA] amplitude ratio (HP/Ctrl) in WT‐rescue and D131N‐rescue mice (for comparison among groups#, two‐way ANOVA test; for comparison in groups*, paired Student's t‐test; n = 7 mice for each group). E) Statistics of in vivo [DA] amplitude ratio (HP/Ctrl) at 20 Hz in D2R‐KO mice overexpressing D2R‐WT and D2R‐D131N virus [paired Student's t‐test for (C)–(E), G; n = 7 mice for each group]. Notably, the HP/Ctrl ratio decreased almost half in D2R‐D131N rescue compared to D2R‐WT, indicating that the Vm‐D2R effect contributes up to ≈50% of voltage induced DA release at the physiological 20 Hz frequency in vivo. F) Model of voltage‐sensitive D2R regulation of DA release in the striatal dopaminergic terminal in vivo. Collectively, voltage (AP) can increase DA release by disinhibiting D2R via Vm↑ → D2R (D131) ↓→ VGCCs↑ → DA release↑, a novel pathway (②) coexisting with the canonical Ca2+‐triggered vesicular secretion pathway (①) for DA release following physiological APs in the striatum in vivo. Data are presented as the mean ± SEM (C–G). *p < 0.05; **p < 0.01; ***/### p < 0.001; p > 0.05, n.s., not significant.

Similar articles

References

    1. a) Mohebi A., Pettibone J. R., Hamid A. A., Wong J. T., Vinson L. T., Patriarchi T., Tian L., Kennedy R. T., Berke J. D., Nature 2019, 570, 65; - PMC - PubMed
    2. b) da Silva J. A., Tecuapetla F., Paixao V., Costa R. M., Nature 2018, 554, 244; - PubMed
    3. c) Howe M. W., Dombeck D. A., Nature 2016, 535, 505; - PMC - PubMed
    4. d) Liu C., Cai X., Ritzau‐Jost A., Kramer P. F., Li Y., Khaliq Z. M., Hallermann S., Kaeser P. S., Science 2022, 375, 1378. - PMC - PubMed
    1. a) Tritsch N. X., Sabatini B. L., Neuron 2012, 76, 33; - PMC - PubMed
    2. b) Chen Y., Gu Y., Wang B., Wei A., Dong N., Jiang Y., Liu X., Zhu L., Zhu F., Tan T., Jing Z., Mao F., Zhang Y., Yao J., Yang Y., Wang H., Wu H., Li H., Zheng C., Duan X., Huo J., Wu X., Hu S., Zhao A., Li Z., Cheng X., Qin Y., Song Q., Zhan S., Qu Q., et al., Nat. Commun. 2024, 15, 10571. - PMC - PubMed
    1. a) Lotharius J., Brundin P., Nat. Rev. Neurosci. 2002, 3, 932; - PubMed
    2. b) Dauer W., Przedborski S., Neuron 2003, 39, 889; - PubMed
    3. c) Jankovic J., J. Neurol., Neurosurg. Psychiatry 2008, 79, 368. - PubMed
    1. a) Wightman R. M., Robinson D. L., J. Neurochem. 2002, 82, 721; - PubMed
    2. b) Kiyatkin E. A., Rebec G. V., Neuroscience 1998, 85, 1285; - PubMed
    3. c) Hyland B. I., Reynolds J. N., Hay J., Perk C. G., Miller R., Neuroscience 2002, 114, 475; - PubMed
    4. d) Grace A. A., Bunney B. S., J. Neurosci. 1984, 4, 2866; - PMC - PubMed
    5. e) Venton B. J., Zhang H., Garris P. A., Phillips P. E., Sulzer D., Wightman R. M., J. Neurochem. 2003, 87, 1284. - PubMed
    1. a) Schultz W., Annu. Rev. Neurosci. 2007, 30, 259; - PubMed
    2. b) Grace A. A., Neuroscience 1991, 41, 1; - PubMed
    3. c) Glimcher P. W., Proc. Natl. Acad. Sci. USA 2011, 108, 15647; - PubMed
    4. d) Schultz W., Dayan P., Montague P. R., Science 1997, 275, 1593; - PubMed
    5. e) Jain S., Yee A. G., Maas J., Gierok S., Xu H., Stansil J., Eriksen J., Nelson A. B., Silm K., Ford C. P., Edwards R. H., Proc. Natl. Acad. Sci. USA 2023, 120, e2309843120. - PMC - PubMed

LinkOut - more resources