. 2025 Dec;16(1):2445238.
doi: 10.1080/21505594.2024.2445238. Epub 2024 Dec 28.

The PA-X host shutoff site 100 V exerts a contrary effect on viral fitness of the highly pathogenic H7N9 influenza A virus in mice and chickens

Affiliations

The PA-X host shutoff site 100 V exerts a contrary effect on viral fitness of the highly pathogenic H7N9 influenza A virus in mice and chickens

Xia Chen et al. Virulence. 2025 Dec.

Abstract

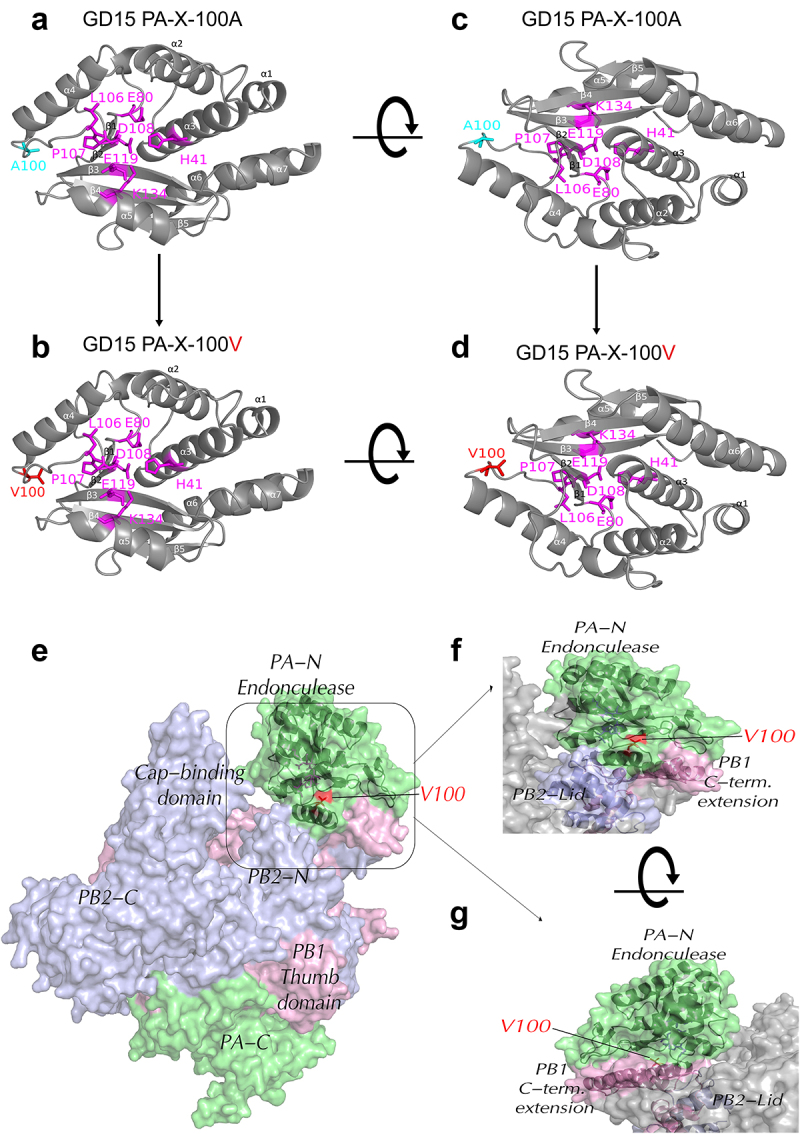
Several viruses, including influenza A virus (IAV), encode viral factors to hijack cellular RNA biogenesis processes to direct the degradation of host mRNAs, termed "host shutoff." Host shutoff enables viruses to simultaneously reduce antiviral responses and provides preferential access for viral mRNAs to cellular translation machinery. IAV PA-X is one of these factors that selectively shuts off the global host genes. However, the specific role of PA-X host shutoff activity in viral fitness of IAV remains poorly understood. Herein, we successfully mapped PA-X 100 V as a novel site important for host shutoff of the H7N9 and H5N1 viruses. By analysing the polymorphism of this residue in various subtype viruses, we found that PA-X 100 was highly variable in H7N9 viruses. Structural analysis revealed that 100 V was generally close to the PA-X endonuclease active site, which may account for its host shutoff activity. By generating the corresponding mutant viruses derived from the parental H7N9 virus and the PA-X-deficient H7N9 virus, we determined that PA-X 100 V significantly enhanced viral fitness in mice while diminishing viral virulence in chickens. Mechanistically, PA-X 100 V significantly increased viral polymerase activity and viral replication in mammalian cells. Furthermore, PA-X 100 V highly blunted the global host response in 293T cells, particularly restraining genes involved in energy metabolism and inflammatory response. Collectively, our data provided information about the intricate role of the PA-X host shutoff site in regulating the viral fitness of the H7N9 influenza virus, which furthers our understanding of the complicated pathogenesis of the influenza A virus.

Keywords: H7N9 avian influenza virus; PA-X; chickens; host shutoff; mice; viral fitness.


Conflict of interest statement

No potential conflict of interest was reported by the author(s).

Figures

Figure 1.
Figure 1.
PA-X 100 V is more prevalent in other subtype viruses rather than in H7N9 virus. (a, b) Frequency of PA-X 100 V in avian H5N1 virus by pie (a) or sequence logo (b). (c, d) Frequency of PA-X 100 V in human H5N1 virus by pie (c) or sequence logo (d). (e)-(f) Frequency of PA-X 100 V in avian H7N9 virus by pie (e) or sequence logo (f). (g)-(h) Frequency of PA-X 100 V in human H7N9 virus by pie (g) or sequence logo (h). (i) Frequency of PA-X 100 V in avian H5N1 virus over time. (j) Frequency of PA-X 100 V in human H5N1 virus over time. (k) Frequency of PA-X 100 V in avian H7N9 virus over time. (l) Frequency of PA-X 100 V in human H7N9 virus over time. The sequence logo based on Weblogo was aligned using BioEdit software.
Figure 2.
Figure 2.
PA-X 100 V contributes to host shutoff activity of H7N9 and H5N1 PA-X proteins in 293T cells. (a) Effect of PA-X protein on the expression of GFP. 293T cells were cotransfected with the pires-hrGFP-1a plasmid encoding GFP and the H7N9 individual PA-X mutant (p-GD15-PA-X, p-GD15-PA-X-A100 V) or the H5N1 individual PA-X mutant (p-CK10-PA-X, p-CK10-PA-X-V100 A, p-CK10-PA-X-V100I) or the pcDNA3.1-flag vehicle. At 48 h post transfection (p.t.), cells were observed under a fluorescence microscope. (b) The intensity of GFP expression in panel a was calculated by image J. (c) Impact of PA-X on the global host gene expression. 293T cells were co-transfected with the individual PA-X plasmids p-GD15-PA-X, p-GD15-PA-X-A100 V, p-CK10-PA-X, p-CK10-PA-X-V100 A, p-CK10-PA-X-V100I or the pcDNA3.1-flag empty vector together with renilla pRL-TK. At 24 h p.t., luciferase production was measured using reagents in the Renilla luciferase reporter assay system. (d) PA-X and cellular β-Tubulin protein expression levels in panel 2c were analysed by western blot using cell extracts and antibodies specific to the flag-tag (to detect PA-X protein) and β-Tubulin. Western blots were quantified by image J. Data were shown as the mean ± standard deviation (SD) of the representative results from three independent experiments.
Figure 3.
Figure 3.
PA-X 100 V significantly enhances viral fitness of H7N9 virus in mice. (a) Schematic representation of PA and PA-X proteins synthesized from the segment 3 transcripts. Continued ORF translation produces full-length viral polymerase subunit PA, while + 1 frameshifiting at 191 codon produces smaller PA-X protein. (b) Three H7N9 recombintant viruses based on the parental GD15 virus were generated, including the PA and PA-X A100 V mutant virus (named GD15-A100 V), the PA-X- deficient virus (named GD15-FS) and the corresponding mutant PA-X- deficient virus carrying only the PA A100 V mutation (named GD15-FS-A100 V). (c) The protein expression levels of PA-X and cellular β-tubulin in panel c. Cells were collected and analysed by western blot using cell extracts and antibodies specific to PA-X mouse polyclonal antibody (prepared in our lab) and β-tubulin. Western blots were quantified by image J. (d) The expression levels of PA-X mRNA by viral infection. MDCK cells were infected with the indicated viruses at a MOI of 2. At 24 h post transfection (p.t.), cells were collected and analysed by qRT-PCR. (e)-(g) Effect of PA-X 100 V on viral replication in MDCK (e), A549 (f) and 293T cells (g). Different cells were inoculated at a multiplicity of infection (MOI) of 0.01 of the indicated viruses. Virus titres were determined as TCID50 in MDCK cells at the indicated time points. The data was represented as one of the three independent experiments and shown as the mean ± SD of three independent infections. (h)-(j) Body weight change of the infected mice. Body weight was presented as percentage of the weight on the day of inoculation (day 0). Mice were humanely killed when they lost > 25% of their initial body weight. Mice were infected with a dose of 104.0 EID50 (h), 105.0 EID50 (i) or 106.0 EID50 (j). (k)-(n) Survival rate of the virus-infected mice. Mice were infected with parental GD15 (k), or the mutant GD15-A100 V (l), the PA-X- deficient virus GD15-FS (m) or the mutant GD15-FS-A100 V virus (n). (o)-(p) Effect of 100 V on viral replication in mice. Groups of mice were infected with the indicated recombinant virus. Three mice of each group were euthanized on days 3 (o) and 5 (p) p.t. For determination of viral load in mice infected with 106.0 EID50 of the viruses. For statistical analysis, orange “*” means significant difference between GD15-A100 V and the parental GD15 virus, purple “*” represents for significant difference between GD15-FS-A100 V and the parental GD15-FS virus.
Figure 4.
Figure 4.
Effect of PA-X 100 V on H7N9 virus-induced histopathological and innate immune response in mice. (a-b) Histopathology and scores of the histopathological changes in the mouse lung-infected with the indicated virus in a dose of 106.0 EID50 on day 3 (a) and 5 (b) p.t. formula image, lung congestion and haemorrhage; formula image, necrotic detached cells were seen in the bronchiolar lumen; formula image, lymphocyte infiltration in pulmonary alveoli bronchiolar lumen and around blood vessel. (c) Innate immune response in mice. Groups of mice were infected with each of the indicated recombinant virus at a dose of 106.0 EID50. Three mice of each group were euthanized on day 3 and 5 p.t. For determination of cytokine response in mouse lung. The concentration of cytokines/chemokines and complements derived components in mouse lung was analysed by ELISA. Values were shown as the means ± SD of three samples.
Figure 5.
Figure 5.
PA-X 100 V obviously restrains the viral fitness of the H7N9 virus in chickens. (a) Effect of PA-X 100 V on GFP expression in DF-1 cells. Cells were cotransfected with pires-hrGFP-1a plasmid which expressing GFP and the individual PA-X mutant or the pcDNA3.1-flag vehicle. At 48 h p.t., cells were observed under a fluorescence microscope. (b) The intensity of GFP in panel a were calculated by image J. (c) Impact of PA-X 100 V on Renilla pRL-tk expression in DF-1 cells. Cells were cotransfected with pRL-TK and the indicated PA-X expression plasmids or the pcDNA3.1 vehicle. After 48 h p.t., luciferase production was measured using reagents in the Renilla luciferase reporter assay system. (d) PA-X and cellular β-Tubulin protein expression levels in panel 5c were analyzed by western blot using cell extracts and antibodies specific to the flag-tag (to detect PA-X protein) and β-Tubulin. Western blots were quantified by image J. (e)-(f) Effect of PA-X 100 V on viral replication in DF-1 (e) and CEF (f) cells. Different cells were inoculated at a multiplicity of infection (MOI) of 0.01 of the indicated viruses. Virus titers were determined as TCID50 in MDCK cells at the indicated time points. The data was represented as one of the three independent experiments and shown as the mean ± SD of three independent infections. (g)-(i) Groups of 5-week-old chickens were infected with the indicated recombinant virus at a dose of 106.0 EID50. (g) Body weight of the infected birds. Body weight was presented as percentage of the weight on the day of inoculation (day 0). Chickens were humanely killed when they lost > 25 % of their initial body weight. (h) Survival rate of the infected birds. (i) Death time of the birds. (j)-(k) Viral loads in birds. Three birds of each group were euthanized on day 1 (j) and 3 (k) p.t. For determination of viral load in vivo.
Figure 6.
Figure 6.
Effect of PA-X 100 V on H7N9 virus-induced histopathological and innate immune response in chickens. (a-b) Histopathology and scores of the histopathological changes in chicken lungs-infected with the indicated virus in a dose of 106.0 EID50 on day 1 (a) and 3 (b) p.t. formula image, lung haemorrhage; formula image, lung congestion; formula image, dilation of parabrochus and structure disappearance of the lung chamber; formula image, lymphocyte infiltration in blood vessels or parabrochus and/or pulmonary chamber; formula image, eosinophilic material can be seen in the cavity; formula image, the structure of the exhale capillary was unclear; formula image, water degeneration, cell swelling and cytoplasm light dye of the epithelial cells in bronchus; formula image, a small amount of epithelial cells was lost in the accessory bronchus. (c) Groups of chickens were infected with each of the indicated recombinant virus at a dose of 106.0 EID50. Three chickens of each group were euthanized on day 1 and 3 p.t. for the determination of cytokine response in chicken lungs. The concentration of cytokine/chemokine and complement-derived components in chicken lungs was analysed by qRT-PCR. Values were shown as the means ± SD of three samples.
Figure 7.
Figure 7.
PA-X 100 V enhances viral polymerase activity both in 293T cells and DF-1 cells. 293T cells and DF-1 cells were transfected in triplicate with luciferase reporter plasmid p-Luci and internal control plasmid Renilla pRL-tk, together with plasmids expressing PB2, PB1, NP, PA or the mutant PA from GD15 virus. At 24 h p.t., cell lysates were used to measure firefly and Renilla luciferase activities. Values are shown as the means ± SD of the representative results from three independent experiments and are standardized to those of parental p-GD15 (100%) or p-GD15-FS (100%). (a) Polymerase activity of the parental PA protein p-GD15 and mutant protein p-GD15-A100 V in 293T cells; (b) polymerase activity of the parental p-GD15-FS and mutant p-GD15-FS-A100 V in 293T cells; (c) the expression of PB2, PB1, PA and NP proteins in panel a and panel b were determined by western blotting; (d) the relative expression level of PB2, PB1, PA and NP in panel c were normalized to β-actin. (e) Polymerase activity of the parental p-GD15 and mutant p-GD15-A100 V in DF-1 cells; (f) polymerase activity of the parental p-GD15-FS and mutant p-GD15-FS -A100 V in DF-1 cells; (g) the expression of PB2, PB1, PA and NP proteins in panel e and panel f were determined by western blotting; (h) the relative expression level of PB2, PB1, PA and NP in panel g were normalized to β-actin.
Figure 8.
Figure 8.
PA-X 100 V has no significant effect on PA and NP nuclear accumulation of H7N9 virus in MDCK cells. (a-d) MDCK cells were infected with GD15 (a), or GD15-A100 V (b) or GD15-FS (c) or GD15-FS-A100 V (d) at a MOI of 2, cell cultures were then fixed and processed for immunofluorescence observation at the indicated time points using anti-pa or NP antibodies. Cell nuclei were stained with DAPI (4,’6-diamidino-2-phenylindole). (e) MDCK cells were infected under the same conditions as for immunofluorescence analysis, followed by fractionation at 7 and 11 h p.t. The cells were then separated into the nuclear fraction (designed as N) and the cytoplasmic fraction (designed as c). Each fraction was analysed by immunoblotting for the distribution of the viral proteins, and the purity of the fractions was controlled by blotting for GAPDH and H3 histone proteins. (f) The relative expression level of PA and NP in the nuclear fraction of the infected cells calculated from panel e. Values were normalized to expression levels of the fraction markers ± SD of the representative data from three independent experiments.
Figure 9.
Figure 9.
Structural modelling of PA-X 100 V in PA-X protein and assembled polymerase complex. (a-d) the amino acid residues at 100 were mapped onto a ribbon diagram of the structure of the N-terminal region of PA (PDB accession of 2W69.2.A) by SWISS-MODEL (SWISS-MODEL.Expasy.org) using the PyMOL software. Amino acid residues that form the endonuclease active site were shown in magenta. (a and c) the parental PA-X protein GD15 PA-X-100 A; (b and d) the mutant PA-X protein GD15 PA-X-100V. (e-g) Surface diagrams showed the information about the position of PA-X 100 V in the assembled polymerase complex using SWISS-MODEL homology modelling (ProMod3 3.3.0). The PDB: 6evj.2 Cryo-em structure of influenza RNA polymerase was served as the template. Colors used are PA (green), PB2 (blue), PB1 (pink). (e) Schematic of the three subunits showing major domains. (f) Enlarged form of the specific location of PA-X 100 V in assembled polymerase complex. (g) Rotation of the Figure 9f.
Figure 10.
Figure 10.
PA-X 100 V exhibits different roles in regulating the global host response in 293T cells and DF-1 cells. (a) The 293T cells and DF-1 cells were either transfected or un-transfected with 2 µg of each plasmid for 24 or 48 h in triplicates. Total RNA was collected for RNA-Seq analysis. (b)-(c) PA-X and cellular β-Tubulin protein expression levels in 293T cells (b) and DF-1 cells (c) in panel a were analyzed by western blot using cell extracts and antibodies specific to the flag-tag (to detect PA-X protein) and β-Tubulin. Western blots were quantified by image J. (d) Numbers of the SDE genes at 24 h p.t. In 293T cells (p < 0.05, Fold change > 2). (e)-(f) Venn diagram showing the distribution of the down regulated SDE genes (E) or up regulated SDE genes (f) at 24 h p.t. In 293T cells. (g) Numbers of the SDE genes at 48 h p.t. In 293T cells (p < 0.05, Fold change > 2). (h)-(i) Venn diagram showing the distribution of the down regulated SDE genes (H) or up regulated SDE genes (i) at 48 h p.t. In 293T cells. (j) Numbers of the SDE genes at 24 h p.t. In DF-1 cells (p < 0.05, Fold change > 1.41). (k)-(l) Venn diagram showing the distribution of the down regulated SDE genes (k) or up regulated SDE genes (l) at 24 h p.t. In DF-1 cells. (m) Numbers of the SDE genes at 48 h p.t. In DF-1 cells (p < 0.05, Fold change > 1.41). (n)-(o) Venn diagram showing the distribution of the down regulated SDE genes (n) or up regulated SDE genes (o) at 48 h p.t. In DF-1 cells.
Figure 11.
Figure 11.
PA-X 100 V exhibits a remarkable role in regulate genes involved in negative regulation of protein phosphorylation and MAPK signalling pathway in 293T cells. (a) Top 5 GO biological process (BPs) induced by the parental PA-X protein p-GD15-PA-X at 48 h p.t. (b) Top 20 GO BPs induced by the mutant PA-X protein p-GD15-PA-X-A100 V at 48 h p.t. (c) Top 20 KEGG pathways induced by the parental PA-X protein p-GD15-PA-X at 48 h p.t. (d) Top 20 KEGG pathways induced by the mutant PA-X protein p-GD15-PA-X-A100 V at 48 h p.t.
Figure 12.
Figure 12.
PA-X 100 V shows a substantial role in degrading host genes in 293T cells. (a-b) top 10 down regulated SDE genes regulated by the parental PA-X protein p-GD15-PA-X (a) or the mutant PA-X protein p-GD15-PA-X-A100 V (b) at 24 h p.t. (c)-(d) top 10 up regulated SDE genes regulated by the parental PA-X protein p-GD15-PA-X (c), or the mutant PA-X protein p-GD15-PA-X-A100 V (d) at 24 h p.t. (e-f) top 10 down regulated SDE genes regulated by the parental PA-X protein p-GD15-PA-X (e) or the mutant PA-X protein p-GD15-PA-X-A100 V (f) at 48 h p.t. (g)-(h) top 10 up regulated SDE genes regulated by the parental PA-X protein p-GD15-PA-X (g), or the mutant PA-X protein p-GD15-PA-X-A100 V (h) at 48 h p.t. (i)-(j) qRT-PCR analysis of the selected top-regulated SDE genes regulated by the parental PA-X protein or the mutant PA-X protein at 24 h p.T (I) and 48 h p.t. (j).
Figure 13.
Figure 13.
PA-X 100 V strongly and preferentially degrades genes involved in cellular energy metabolism and inflammatory response in 293T cells. (a) The top 15 GO BPs-mediated by the down regulated SDE genes induced by the mutant p-GD15-PA-X-A100 V at 48 h p.t. (b) The energy metabolism related-sde genes that down regulated by the mutant p-GD15-PA-X-A100 V. (c) The expression pattern of the mitochondrial respiratory chain complex I-related genes was verified by qRT‒PCR. (d-i) Heat maps were shown as the gene expression profile of the top GO BPs induced by the mutant p-GD15-PA-X-A100 V. (d) Electron transport chain. (e) Establishment of protein localization to membrane. (f) Negative regulation of protein phosphorylation. (g) Positive regulation of cytokine production. (h) Intrinsic apoptotic signalling pathway. (i) Neutrophil activation.
Figure 14.
Figure 14.
PA-X 100 V shows obvious advantages in suppressing genes involved in cellular energy metabolism signalling pathways and inflammatory response at 48 h p.I. In MDCK cells. MDCK cells were infected with the indicated viruses with a MOI of 2, at 48 h p.I., cells were collected for qRT‒PCR analysis of the cytokines. Among these genes, 6 genes were related to the respiratory electron transport chain (NDUFA11, NDUFA13, NDUFA2, NDUFB7, NDUFC2-KCTD14, TIMM13) and 12 genes were related with inflammatory response (RAB7B, POLR2L, ZFPM1, HIC1, BCL2L11, CCL5, OSCAR, ITGAM). (a) Schematic representation of the qRT-PCR experiments for the virus infection samples. (b-o) Expression pattern of each gene.

Similar articles

Cited by

References

    1. Bercovich-Kinori A, Tai J, Gelbart IA, et al. A systematic view on influenza induced host shutoff. Elife. 2016;5:e18311. doi: 10.7554/eLife.18311 - DOI - PMC - PubMed
    1. Klemm C, Boergeling Y, Ludwig S, et al. Immunomodulatory nonstructural proteins of influenza a viruses. Trends Microbiol. 2018;26(7):624–31. doi: 10.1016/j.tim.2017.12.006 - DOI - PubMed
    1. DeDiego ML, Nogales A, Lambert-Emo K, et al. NS1 protein mutation I64T affects interferon responses and virulence of circulating H3N2 human influenza a viruses. J Virol. 2016;90(21):9693–9711. doi: 10.1128/JVI.01039-16 - DOI - PMC - PubMed
    1. Nemeroff ME, Barabino SM, Li Y, et al. Influenza virus NS1 protein interacts with the cellular 30 kDa subunit of CPSF and Inhibits 3′ end formation of cellular pre-mRNAs. Mol Cell. 1998;1(7):991–1000. doi: 10.1016/S1097-2765(00)80099-4 - DOI - PubMed
    1. Rosario-Ferreira N, Preto AJ, Melo R, et al. The central role of non-structural protein 1 (NS1) in influenza biology and infection. Int J Mol Sci. 2020;21(4):21. doi: 10.3390/ijms21041511 - DOI - PMC - PubMed

Publication types

MeSH terms

Substances