. 2025 Jan:111:105530.
doi: 10.1016/j.ebiom.2024.105530. Epub 2024 Dec 27.

Shared genetic architecture and bidirectional clinical risks within the psycho-metabolic nexus

Affiliations

Shared genetic architecture and bidirectional clinical risks within the psycho-metabolic nexus

Xiaonan Guo et al. EBioMedicine. 2025 Jan.

Abstract

Background: Increasing evidence suggests a complex interplay between psychiatric disorders and metabolic dysregulations. However, most research has been limited to specific disorder pairs, leaving a significant gap in our understanding of the broader psycho-metabolic nexus.

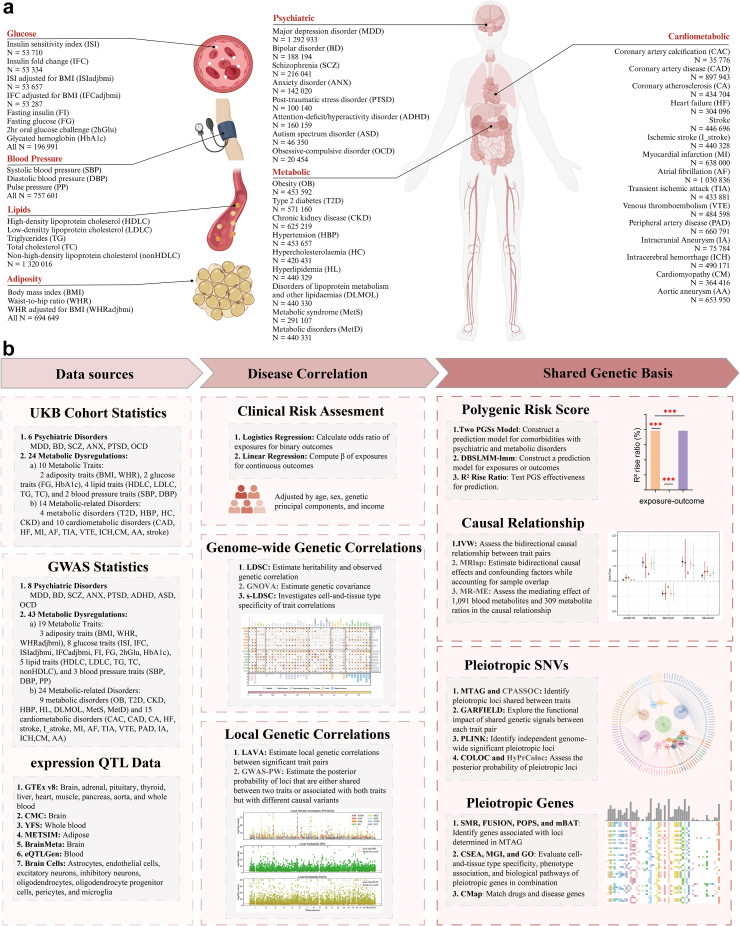
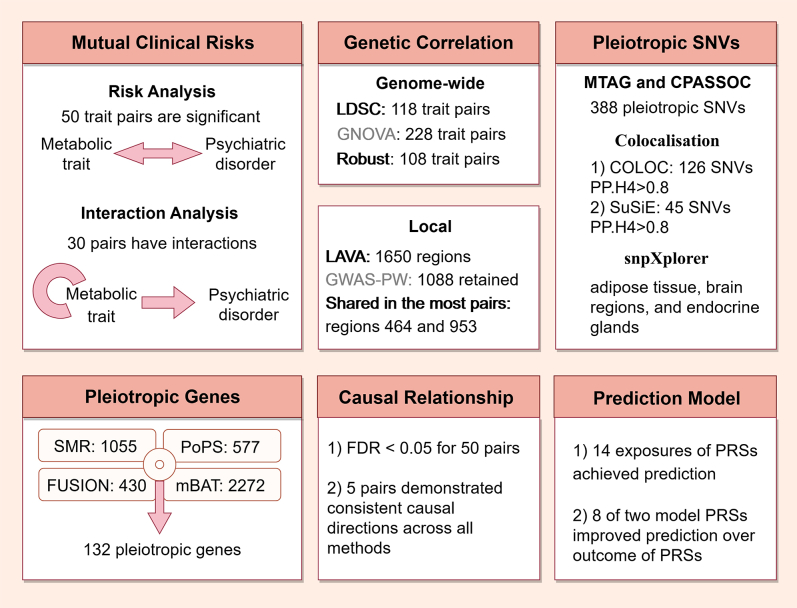
Methods: This study leveraged large-scale cohort data and genome-wide association study (GWAS) summary statistics, covering 8 common psychiatric disorders and 43 metabolic traits. We introduced a comprehensive analytical strategy to identify shared genetic bases sequentially, from key genetic correlation regions to local pleiotropy and pleiotropic genes. Finally, we developed polygenic risk score (PRS) models to translate these findings into clinical applications.

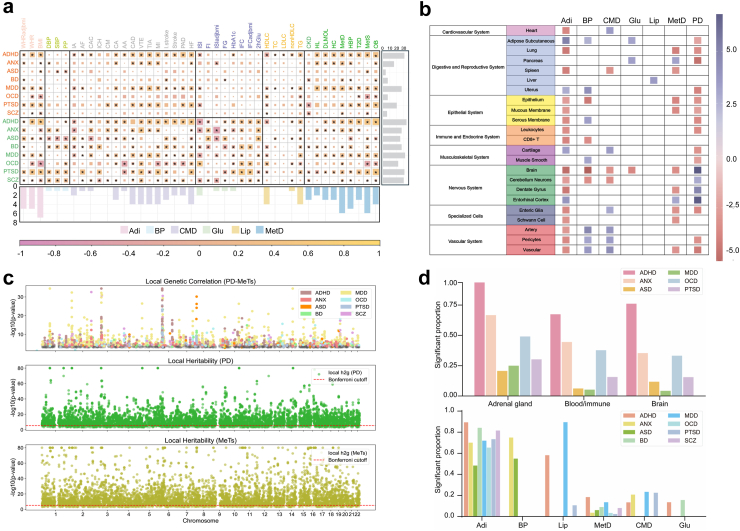
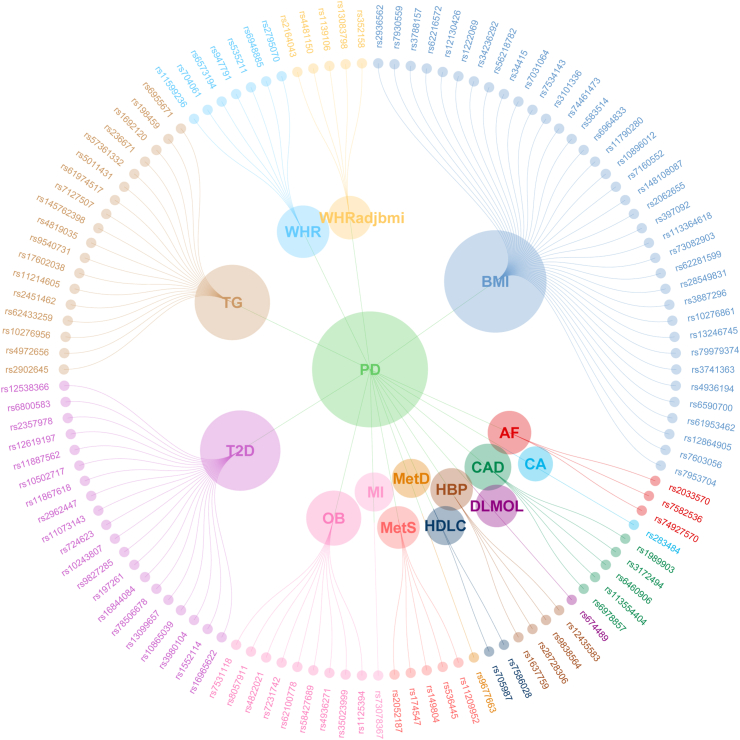
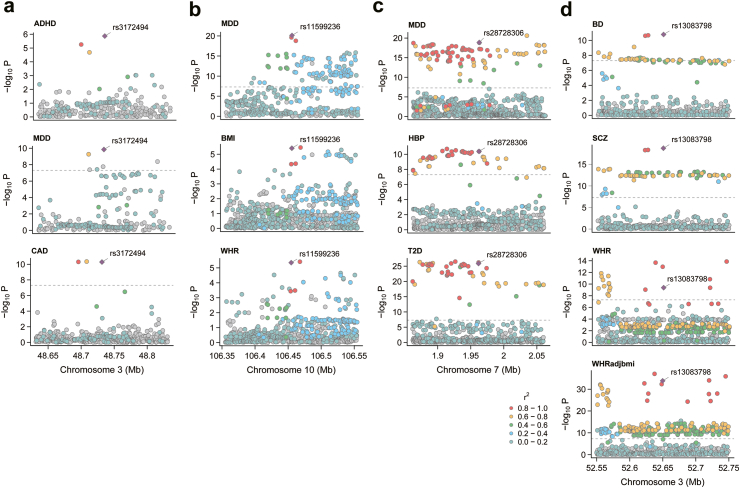
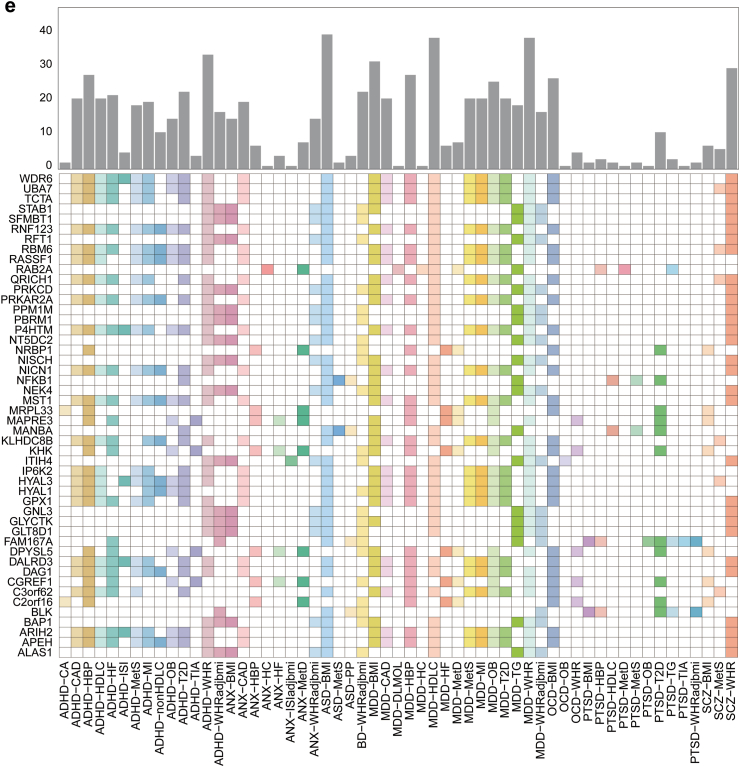
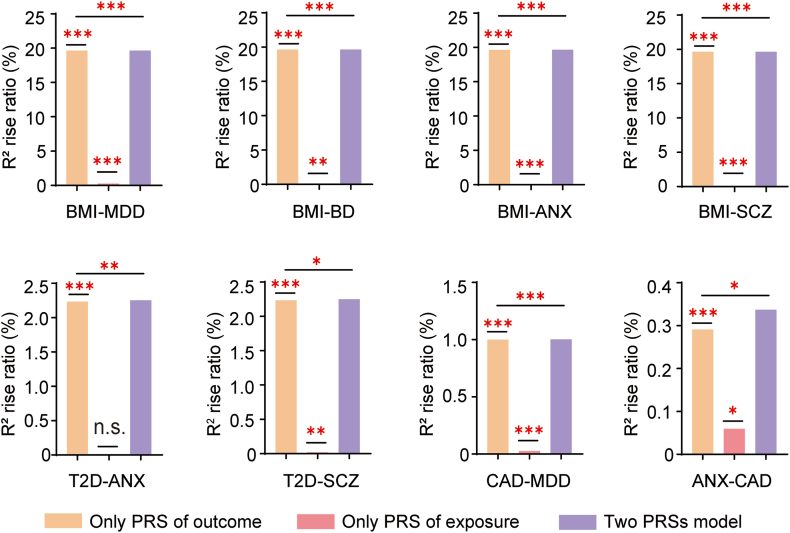
Findings: We identified significant bidirectional clinical risks between psychiatric disorders and metabolic dysregulations among 310,848 participants from the UK Biobank. Genetic correlation analysis confirmed 104 robust trait pairs, revealing 1088 key genomic regions, including critical hotspots such as chr3: 47588462-50387742. Cross-trait meta-analysis uncovered 388 pleiotropic single nucleotide variants (SNVs) and 126 shared causal variants. Among variants, 45 novel SNVs were associated with psychiatric disorders and 75 novel SNVs were associated with metabolic traits, shedding light on new targets to unravel the mechanism of comorbidity. Notably, RBM6, a gene involved in alternative splicing and cellular stress response regulation, emerged as a key pleiotropic gene. When psychiatric and metabolic genetic information were integrated, PRS models demonstrated enhanced predictive power.

Interpretation: The study highlights the intertwined genetic and clinical relationships between psychiatric disorders and metabolic dysregulations, emphasising the need for integrated approaches in diagnosis and treatment.

Funding: The National Key Research and Development Program of China (2023YFC2506200, SHH). The National Natural Science Foundation of China (82273741, SY).

Keywords: Clinical risks; Genetic association; Metabolism; Polygenic risk score; Psychiatric disorder.


Conflict of interest statement

Declaration of interests No conflicts of interest, financial or otherwise, are declared by the authors. All authors were not paid to write this article by a pharmaceutical company or other agency.

Figures

Fig. 1
Fig. 1
Study workflow. a, We listed the trait categories, aberrations and sample size of 8 psychiatric disorders, 19 metabolic traits (8 glucose traits, 3 blood pressure traits, 5 lipid traits, and 3 adiposity traits), 9 metabolic disorders, and 15 cardiometabolic disorders GWAS results used in the genetic pleiotropy analysis. b, Study overview. For data sources, we obtained prospective cohort data from 6 psychiatric disorders and 24 metabolic profiles in UKBB, large European GWAS data from 8 psychiatric disorders and 43 metabolic profiles, and several eQTL sources. Then, we estimated the mutual clinical risks through regression analyses, global genetic correlations through LDSC and GNOVA, and local genetic correlations through LAVA and GWAS-PW, between psychiatric disorders and metabolic dysregulations. Last, we explored the genetic liability in causal relationships in MR and prediction performance in PRSs, with pleiotropic variants and genes derived under the framework of local genetic correlations.
Fig. 2
Fig. 2
Genetic correlations and tissue-specific functional impact between psychiatric and metabolic disorders. a, Genome-wide genetic correlations between psycho-metabolic traits were identified by LDSC (top) and GNOVA (bottom). The right grey bar represented the summation number of significantly correlated trait pairs for each psychiatric disorder. The bottom colour bar represented the summation number of significantly correlated trait pairs in both LDSC and GNOVA for each metabolic dysregulation. b, Functional impact of the 104 paired traits (discerned from robustness in both LDSC and GNOVA) revealed tissue type specificity in the psycho-metabolic profiles. The colour plot represented functional enrichment degrees (Z value) in each tissue type. Adi, Adipposity; BP, Blood pressure; Lip, Lipids; MetD, Metabolic disorder; CMD, Cardiometabolic disorder; Glu, Glucose. c, Manhattan plots from top to bottom displayed LAVA results of PD-MeTs, PD, and MetS. The red line indicated the significance threshold (P = 0.05/2495). PD, Psychiatric disorder; MeTs, Metabolic traits. d, Functional impacts of 91 trait pairs on genetic signalling across various tissue types were explored via GARFIELD, with a focus on SNVs more significant in MTAG than in any individual trait.
Fig. 3
Fig. 3
Potential pleiotropic variants between psychiatric and metabolic disorders. A network diagram of 126 causal shared SNVs with colocalisation (PP.H4 ≥ 0.8) using COLOC analysis categorised by metabolic traits. A network diagram of 126 causal shared SNVs categorised by psychiatric disorders can be seen in Supplementary Fig. S2. PD, Psychiatric disorder.
Fig. 4
Fig. 4
Potential pleiotropic variants in trait pairs and shared genes. a–d, The x-axis showed position within the genome and the y-axis denoted the −log10P for the association. Colour denoted the LD between different variants. 4 SNVs indicated by purple colour were colocalised across more than one trait pair and validated by HyPrColoc. Panels a–d represented rs3172494 in ADHD/MDD-CAD, rs11599236 in MDD-BMI/WHR, rs28728306 in MDD-high blood pressure/T2D, and rs13083798 in BD-WHRadjbmi and SCZ-WHR, respectively. The grey line indicated the significance threshold (P = 5 × 10−8). e, 132 robust pleiotropic genes were identified across all SMR, FUSION, PoPS, and mBAT approaches. Inclusion criteria for the final credible pleiotropic genes required: 1) Bonferroni-adjusted P < 0.05 in SMR, FUSION, and mBAT; 2) P HEIDI >0.01 in SMR; 3) PoPS Score > 1. The grey bar represented the summation number of genes found within each trait pair.
Fig. 4
Fig. 4
Potential pleiotropic variants in trait pairs and shared genes. a–d, The x-axis showed position within the genome and the y-axis denoted the −log10P for the association. Colour denoted the LD between different variants. 4 SNVs indicated by purple colour were colocalised across more than one trait pair and validated by HyPrColoc. Panels a–d represented rs3172494 in ADHD/MDD-CAD, rs11599236 in MDD-BMI/WHR, rs28728306 in MDD-high blood pressure/T2D, and rs13083798 in BD-WHRadjbmi and SCZ-WHR, respectively. The grey line indicated the significance threshold (P = 5 × 10−8). e, 132 robust pleiotropic genes were identified across all SMR, FUSION, PoPS, and mBAT approaches. Inclusion criteria for the final credible pleiotropic genes required: 1) Bonferroni-adjusted P < 0.05 in SMR, FUSION, and mBAT; 2) P HEIDI >0.01 in SMR; 3) PoPS Score > 1. The grey bar represented the summation number of genes found within each trait pair.
Fig. 5
Fig. 5
PRSs with both metabolic and psychiatric traits improved the prediction efficacy. 8 of 24 groups demonstrated improved prediction performance in two model PRSs significantly over the only outcome of PRSs. Trait pairs were organised as exposure-outcome. We constructed 3 types of PRSs (only PRS of outcome, only PRS of exposure, and two PRSs model) to test the prediction efficacy of outcome. All PRSs were constructed using DBSLMM based on GWAS statistics for psychiatric disorders and metabolic profiles. Continuous traits were modelled with Gaussian linear models and binary traits with generalised logistic regression, testing PRSs effectiveness for each exposure trait. Adjustments were made for age, sex, the top 10 genetic PCs, and income. Prediction efficacy of different PRSs evidenced by R2 rise ratio. Models with two PRSs were assessed for improved predictive performance beyond outcome-specific PRS. Pearson's R2 and McFadden's pseudo-R2 evaluated model performance with FDR correction. We labelled the significance of prediction efficacy of only PRS of exposure, two PRSs model, and the difference between two PRSs model two PRSs model and only PRS of outcome. ∗P < 0.05, ∗∗P < 0.01, and ∗∗∗P < 0.001.
Graphical Abstract
Graphical Abstract
Graphic abstract. This graphic abstract summarised the key findings on the relationship between metabolic traits and psychiatric disorders. Risk analysis identified significant associations in 50 trait pairs between metabolic traits and psychiatric disorders, with 30 pairs showing interactions between metabolic traits. Genome-wide genetic correlation analysis (LDSC and GNOVA) identified 118 and 228 significant trait pairs, respectively, with 108 pairs robustly correlated. Additionally, LAVA identified 1650 regions and 1088 regions retained in GWAS-PW with the highest overlap in regions 464 and 953. MTAG and CPASSOC analyses uncovered 388 pleiotropic SNVs, with further colocalisation analyses (COLOC and SuSiE) highlighting 126 and 45 SNVs, respectively, active in adipose tissue, brain regions, and endocrine glands. Additionally, pleiotropic gene analysis identified 132 shared genes across traits, using methods like SMR, FUSION, PoPS, and mBAT. Causal inference confirmed consistent causal directions across 5 trait pairs and identified significant associations in 50 pairs (FDR < 0.05), highlighting causal relationships between traits. Finally, PRS analysis demonstrated significant predictive performance in 14 exposure-based PRS models, with 8 two-model PRS configurations improving predictive power over outcome-only PRS models.

Similar articles

Cited by

References

    1. Penninx B.W.J.H., Lange S.M.M. Metabolic syndrome in psychiatric patients: overview, mechanisms, and implications. Dialogues Clin Neurosci. 2018;20:63–73. - PMC - PubMed
    1. Vancampfort D., Stubbs B., Mitchell A.J., et al. Risk of metabolic syndrome and its components in people with schizophrenia and related psychotic disorders, bipolar disorder and major depressive disorder: a systematic review and meta-analysis. World Psychiatry. 2015;14:339–347. - PMC - PubMed
    1. Goldfarb M., De Hert M., Detraux J., et al. Severe mental illness and cardiovascular disease: JACC state-of-the-art review. J Am Coll Cardiol. 2022;80:918–933. - PubMed
    1. Chen W., Feng J., Jiang S., et al. Mendelian randomization analyses identify bidirectional causal relationships of obesity with psychiatric disorders. J Affect Disord. 2023;339:807–814. - PubMed
    1. Karhunen V., Bond T.A., Zuber V., et al. The link between attention deficit hyperactivity disorder (ADHD) symptoms and obesity-related traits: genetic and prenatal explanations. Transl Psychiatry. 2021;11:455. - PMC - PubMed