Clinical Trial
. 2025 Jan 21;6(1):101882.
doi: 10.1016/j.xcrm.2024.101882. Epub 2024 Dec 27.

Coupling of response biomarkers between tumor and peripheral blood in patients undergoing chemoimmunotherapy

Affiliations
Clinical Trial

Coupling of response biomarkers between tumor and peripheral blood in patients undergoing chemoimmunotherapy

Wee Loong Chin et al. Cell Rep Med. .

Abstract

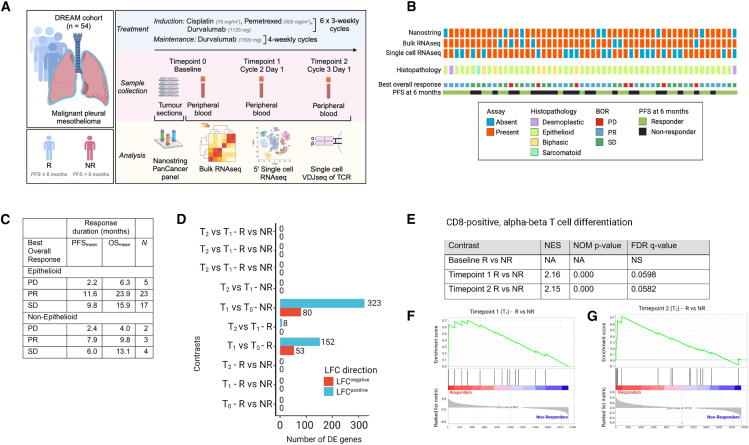
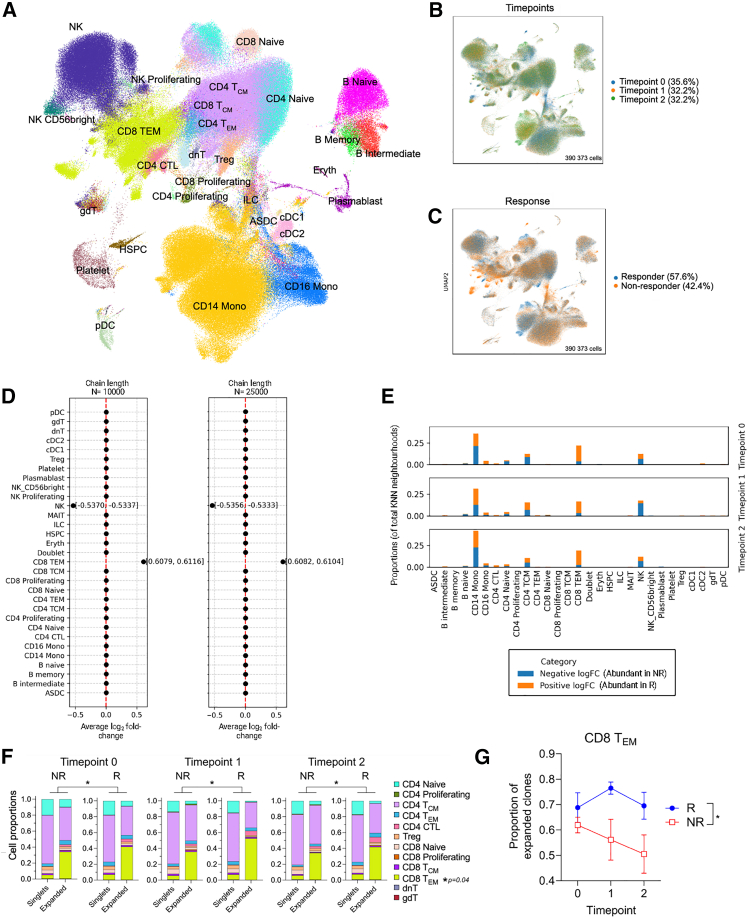
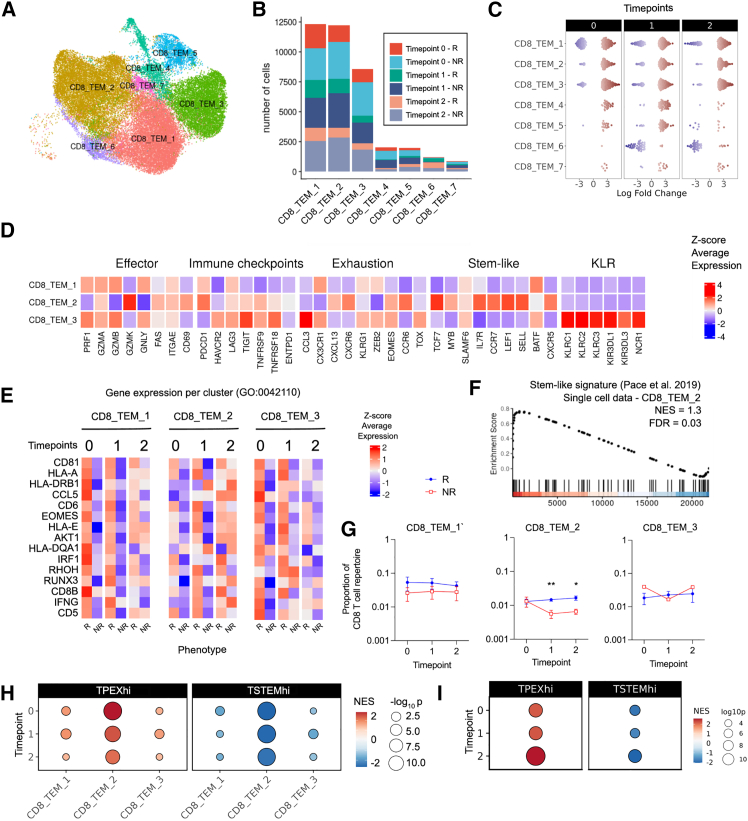
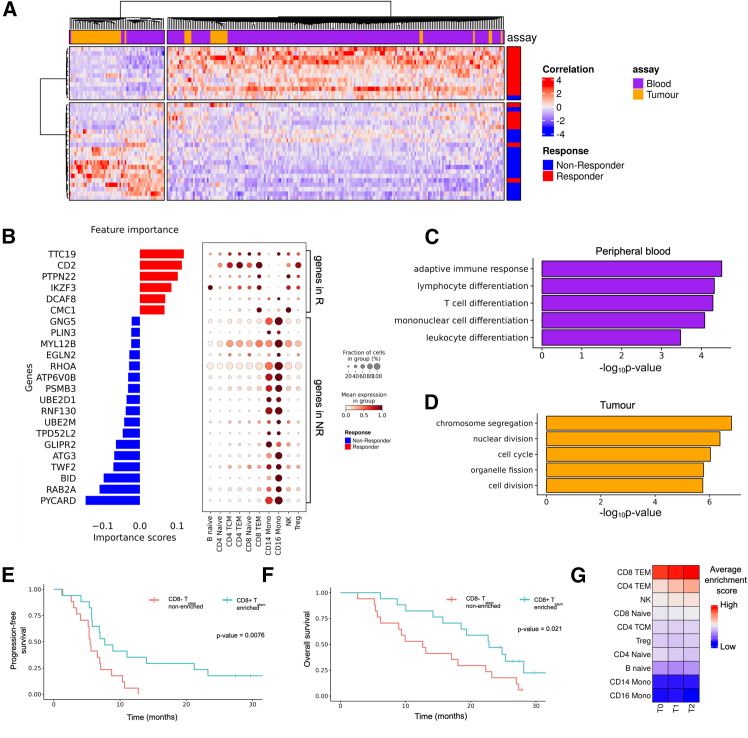
Platinum-based chemotherapy in combination with anti-PD-L1 antibodies has shown promising results in mesothelioma. However, the immunological mechanisms underlying its efficacy are not well understood and there are no predictive biomarkers to guide treatment decisions. Here, we combine time course RNA sequencing (RNA-seq) of peripheral blood mononuclear cells with pre-treatment tumor transcriptome data from the single-arm, phase 2 DREAM trial (N = 54). Single-cell RNA-seq and T cell receptor sequencing (TCR-seq) reveal that CD8+ T effector memory (TEM) cells with stem-like properties are more abundant in peripheral blood of responders and that this population expands upon treatment. These peripheral blood changes are linked to the transcriptional state of the tumor microenvironment. Combining information from both compartments, rather than individually, is most predictive of response. Our study highlights complex interactions between the tumor and immune cells in peripheral blood during objective tumor responses to chemoimmunotherapy. This trial is registered with the Australian New Zealand Clinical Trials Registry, number ACTRN12616001170415.

Keywords: CD8(+) T effector memory cells; ICT; PD-L1; biomarkers; cancer; immune checkpoint therapy; mesothelioma; peripheral blood; platinum chemotherapy; response; single-cell RNA sequencing.


Conflict of interest statement

Declaration of interests W.J.L. declares consultancy for Douglas Pharmaceuticals and research funding from Douglas Pharmaceuticals, AstraZeneca, and ENA therapeutics. W.J.L. is a director of the Cancer Research Trust, which has funded parts of this work, but is not involved in any funding decisions, which are based on independent external peer review. W.J.L. is a founder and director of Setonix Pharmaceuticals, which is not related to the presented work. W.J.L. is an inventor on patent applications unrelated to the presented work. A.K.N. declares consultancy for Douglas Pharmaceuticals and Bristol-Myers Squibb, institutional research funding from AstraZeneca, and consultancy (unrelated to this work) from AstraZeneca.

Figures

None
Graphical abstract
Figure 1
Figure 1
Peripheral blood bulk transcriptomics reveals immune pathways that differentiate responders from non-responders to chemoimmunotherapy (A) DREAM chemoimmunotherapy protocol. (B) Participant characteristics and biospecimen availability for each participant, with the first three rows describing biospecimens available for each participant. (C) Participant response by histology. (D) Differentially expressed genes across pairwise comparisons, subdivided by log2FC direction. (E–G) (E) Enrichment scores, raw p values, and FDR values for gene set enrichment analysis (GSEA) using the GO:0043374 (CD8-positive alpha beta T cell differentiation) gene set for response contrasts with enrichment plots displayed for statistically significant contrasts (F, G). BOR, best overall response; R, responder; NR, non-responder; NES, normalized enrichment score; NOM p value, nominal p value.
Figure 2
Figure 2
Activated CD8+ TEMs are more abundant in chemoimmunotherapy responders before and shortly after treatment (A–C) (A) Uniform manifold approximation and projection (UMAP) of all cells in single-cell transcriptomics dataset, grouped by (B) time point and (C) response. (D) Forest plot depicting compositional analysis using scCODA, repeated using two chain lengths for the No-U-Turn (NUTS) sampler, with positive log-fold changes indicating differential abundance with respect to responders. (E) Bar chart of Milo analysis showing the proportions of neighbourhoods across cell types, with statistically significant positive (LFC+) and negative (LFC−) log-fold changes, normalized against the total number of neighbourhoods, at an FDR threshold of <0.05. (F) Proportion of expanded clones in CD8 TEMs across time points grouped by response. Bar plots show the frequency of clonally expanded T cells at different time points and PFS groups. Expanded T cell clones were defined as >1 cell that expressed the same TCRαβ sequence, and non-expanded cells (singlets) were individual cells each with a unique TCRαβ sequence. Asterisks indicate significance after multiple-testing correction, comparing distribution of expanded and singlet cells for all T cell subsets, responder versus non-responders (logistic regression using two-sided t test with Benjamini-Hochberg FDR correction to compare between all T cell subsets). (G) Proportion of expanded clones in CD8+ TEMs across time points grouped by response. Mean ± SEM CD8 TEM proportion of T cell repertoire per participant depicted. Each sample was downsampled to 500 cells. Blue dots depict responding participants, and red open squares depict non-responding participants. A mixed-model ANOVA corrected for multiple comparisons with a Bonferroni’s test was used to compare differences between time and response groups. (∗p < 0.05).
Figure 3
Figure 3
Chemoimmunotherapy responders are enriched for CD8+ TEMs with stem-like properties (A) Subclusters of CD8+ TEM using Leiden-based clustering. (B) Cluster composition, grouped by both treatment response and time point. (C) Differential abundance analysis across CD8+ TEM clusters. (D) Average (gene-scaled) expression of CD8+ T cell activation, differentiation, and exhaustion markers. (E) Average (gene-scaled) expression of genes associated with T cell activation (GO:0042110), by time point and CD8+ TEM cluster. (F) GSEA of stem-like signature in CD8_TEM_2 cluster. (G) Proportion of persistent clones in CD8+ TEM clusters across time and response. Mean ± SEM proportion of cluster CD8_TEM_1, CD8_TEM_2, and CD8_TEM_3 cells persistent clones per participant depicted. Blue dots depict responding participants, and red open squares depict non-responding participants. Repeated measures two-way ANOVA with Sidak’s multiple comparisons test was used to compare differences between time and response groups. Data presented as mean ± SEM; ∗p < 0.05, ∗∗p < 0.01. (H) Tpex and Tstem enrichment per single-cell cluster across time points. Positive NES is with respect to responders. (I) Tpex and Tstem enrichment in bulk transcriptomics data across time points.
Figure 4
Figure 4
Stem-like CD8+ TEM expansion in responders is linked to a permissive pre-treatment tumor microenvironment (A) Feature correlation matrix visualizing correlation strength between DIABLO-extracted genes (x axis) and samples (y axis) using tumor and peripheral bulk transcriptomics data from the first two time points. (B) Combined factor loading plot and expression dot plot showing the top genes selected by DIABLO in peripheral blood in responders (red) and non-responders (blue). Displayed genes were expressed in at least 25% of cells in the single-cell dataset. (C) Enrichment analysis of predictive genes in peripheral blood (bulk transcriptomics) assay. (D–F) (D) Enrichment analysis of predictive genes in tumor (NanoString) assay. Kaplan-Meier analysis for (E) PFS and (F) OS for participants, stratified by stem-like CD8+ T cell signature enrichment in peripheral blood. (G) Average gene set enrichment of the DIABLO signature (at N = 50 features) in each of the top 10 most common cell populations in single-cell data.

References

    1. Vogelzang N.J., Rusthoven J.J., Symanowski J., Denham C., Kaukel E., Ruffie P., Gatzemeier U., Boyer M., Emri S., Manegold C., et al. Phase III study of pemetrexed in combination with cisplatin versus cisplatin alone in patients with malignant pleural mesothelioma. J. Clin. Oncol. 2003;21:2636–2644. doi: 10.1200/JCO.2003.11.136. - DOI - PubMed
    1. Baas P., Scherpereel A., Nowak A.K., Fujimoto N., Peters S., Tsao A.S., Mansfield A.S., Popat S., Jahan T., Antonia S., et al. First-line nivolumab plus ipilimumab in unresectable malignant pleural mesothelioma (CheckMate 743): a multicentre, randomised, open-label, phase 3 trial. Lancet. 2021;397:375–386. doi: 10.1016/S0140-6736(20)32714-8. - DOI - PubMed
    1. Nowak A.K., Lesterhuis W.J., Kok P.-S., Brown C., Hughes B.G., Karikios D.J., John T., Kao S.C.-H., Leslie C., Cook A.M., et al. Durvalumab with first-line chemotherapy in previously untreated malignant pleural mesothelioma (DREAM): a multicentre, single-arm, phase 2 trial with a safety run-in. Lancet Oncol. 2020;21:1213–1223. doi: 10.1016/S1470-2045(20)30462-9. - DOI - PubMed
    1. Kok P.S., Forde P.M., Hughes B., Sun Z., Brown C., Ramalingam S., Cook A., Lesterhuis W.J., Yip S., O’Byrne K., et al. Protocol of DREAM3R: DuRvalumab with chEmotherapy as first-line treAtment in advanced pleural Mesothelioma—a phase 3 randomised trial. BMJ Open. 2022;12 doi: 10.1136/bmjopen-2021-057663. - DOI - PMC - PubMed
    1. Piccirillo M.C., Chu Q., Bradbury P., Tu W., Coschi C.H., Grosso F., Florescu M., Mencoboni M., Goffin J.R., Pagano M., et al. Brief Report: Canadian Cancer Trials Group IND.227: A Phase 2 Randomized Study of Pembrolizumab in Patients With Advanced Malignant Pleural Mesothelioma (NCT02784171) J. Thorac. Oncol. 2023;18:813–819. doi: 10.1016/j.jtho.2023.02.003. - DOI - PubMed

Publication types

Substances