. 2024 Dec 28;24(1):1474.
doi: 10.1186/s12879-024-10367-3.

Evaluation of population immunity against SARS-CoV-2 variants, EG.5.1, FY.4, BA.2.86, JN.1, JN.1.4, and KP.3.1.1 using samples from two health demographic surveillance systems in Kenya

Affiliations

Evaluation of population immunity against SARS-CoV-2 variants, EG.5.1, FY.4, BA.2.86, JN.1, JN.1.4, and KP.3.1.1 using samples from two health demographic surveillance systems in Kenya

Doreen Lugano et al. BMC Infect Dis. .

Abstract

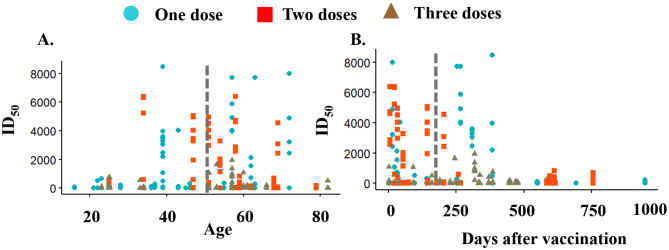
Increased immune evasion by emerging and highly mutated SARS-CoV-2 variants is a key challenge to the control of COVID-19. The majority of these mutations mainly target the spike protein, allowing the new variants to escape the immunity previously raised by vaccination and/or infection by earlier variants of SARS-CoV-2. In this study, we investigated the neutralizing capacity of antibodies against emerging variants of interest circulating between May 2023 and October 2024 using sera from representative samples of the Kenyan population. From our genomics data, we identified the most prevalent Kenyan and global variants and performed pseudoviruses neutralization assays with the most recent SARS-CoV-2 variants. Our data show that antibodies from individuals in the general population in Kenya were less effective against the recent prevalent SARS-CoV-2 omicron variants (i.e. EG.5.1, FY.4, BA.2.86, JN.1, JN.1.4, and KP.3.1.1) compared to the ancestral wildtype strain. Although there was increased neutralization following multiple doses of vaccine, antibodies from > 40% of the vaccinated individuals did not neutralize the omicron variants, suggesting that individuals were susceptible to infection by these variants.

Keywords: Neutralization; Population immunity; SARS-CoV-2 variants; Vaccination.


Conflict of interest statement

Declarations. Ethical approval: This study was approved by the Scientific and Ethics Review Unit (SERU) of the Kenya Medical Research Institute (SERU ID: 4085 and 4807). Written informed consent was obtained from participants for the collection, storage, and further use of their sample sets in the research. Consent for publication: Not applicable. Competing interests: The authors declare no competing interests.

Figures

Fig. 1
Fig. 1
SARS-CoV-2 lineage frequency (%) between May 2023 and October 2024. This figure presents worldwide, European, and Kenyan SARS-CoV-2 lineage frequency % maps from GISAID. (A) Shows the lineage frequency % in all countries (n = 775112) (B) Shows the lineage frequency % in Europe (n = 232081). (C) Shows the lineage frequency % in Kenya (n = 616). The legends in A, B, and C show the top circulating variants in each region within the period of interest, with the colors corresponding to the frequency. (D) Shows the phylogenetic analysis of 616 sequences collected and sequenced from Kenya between May 2023 and March 2024. The legend shows the lineages corresponding to the colors on the tree
Fig. 2
Fig. 2
A comparison of inhibitory dilutions (ID50) between wildtype and omicron variants EG.5.1, FY.4, BA.2.86, JN.1, JN.1.4, and KP.3.1.1 in Kenyan population samples (n=78). (A) Represents the log ID50 between wildtype and EG.5.1 where 41/78 in EG.5.1 showed neutralization. (B) Represents the log ID50 between wildtype and FY.4 where 23/78 samples showed neutralization. (C) Represents the log ID50 between wildtype and BA.2.86 where 25/78 samples showed neutralization. (D) Represents the log ID50 between wildtype and JN.1 where 29/78 samples showed neutralization. (E) Represents the log ID50 between wildtype and JN.1.4 where 31/78 samples showed neutralization. (F) Represents the log ID50 between wildtype and KP.3.1.1 where 24/78 samples showed neutralization. The numbers above each variant plot represent the mean ID50 compared to wildtype. (G) Shows the statistical analysis of ID50 between wildtype and each variant. A statistical significance of P< 0.0001 (***) was recorded between wildtype and all strains, based on Mann-Whitney tests. The box plots larger quartiles represent the majority of the data points, the horizontal line shows the median with 95% C.I., and the whiskers represent the highest and lowest values. The sample colors represent SARS-CoV-2 variants where red is wildtype, blue is EG.5.1, yellow is FY.4, green is BA.2.86, orange is JN.1, brown is JN.1.4, and purple is KP.3.1.1. The dotted line represents the cut-off neutralization ID50 of 101
Fig. 3
Fig. 3
Evaluation of naturally- acquired (n = 20) and vaccine-induced immunity (n = 58) in Kenyan population samples. A & B. Shows neutralization ( log ID50 ) after natural infection (n = 20) or vaccination with one dose (n = 20), two doses (n = 19), and three doses (n = 19). The legend represents SARS-CoV-2 variants where red is Wildtype (D614G), blue is EG.5.1, yellow is FY.4, green is BA.2.86, orange is JN.1, brown is JN.1.4, and purple is KP.3.1.1. The box plots larger quartiles represent the majority of the data points, the horizontal line shows the median with 95% C.I., and the whiskers represent the highest and lowest values.Statistical significance was determined by Mann-Whitney tests where P < 0.05 (*), P < 0.001 (**), and P < 0.0001 (***).The dotted line represents the cut-off neutralization ID50 of 10 and the values above the boxplots represent the median [1]
Fig. 4
Fig. 4
Distribution of ID50 based on age and days post-vaccination. (A) Represents the distribution of ID50 based on age between individuals administered with one, two, and three doses of vaccine. The dotted line separates individuals below and above 50 years old. (B) Shows the distribution based on days post-vaccination with administering one, two, and three vaccine doses. The dotted line represents a cut-off of 6 months after vaccination. A & B Circles represent one dose, boxes represent two doses, and triangles represent three doses

Similar articles

Cited by

References

    1. Altawalah H. Antibody responses to natural sars-cov-2 infection or after covid-19 vaccination. Vaccines (Basel). 2021;9. - PMC - PubMed
    1. Herzberg J et al. SARS-CoV-2-antibody response in health care workers after vaccination or natural infection in a longitudinal observational study. Vaccine. 2022;40. - PMC - PubMed
    1. Lotfi M, Hamblin MR, Rezaei N. COVID-19: Transmission, prevention, and potential therapeutic opportunities. Clinica Chimica Acta vol. 508 Preprint at 10.1016/j.cca.2020.05.044 2020. - PMC - PubMed
    1. Changrob S et al. Cross-Neutralization of Emerging SARS-CoV-2 Variants of Concern by Antibodies Targeting Distinct Epitopes on Spike. mBio 2021;12. - PMC - PubMed
    1. Suryadevara N et al. Neutralizing and protective human monoclonal antibodies recognizing the N-terminal domain of the SARS-CoV-2 spike protein. Cell. 2021;184. - PMC - PubMed

MeSH terms

Substances

Supplementary concepts

LinkOut - more resources