Comparative Study
. 2024 Dec 28;23(1):454.
doi: 10.1186/s12933-024-02565-9.

Evaluating sex-specific responses to western diet across the lifespan: impact on cardiac function and transcriptomic signatures in C57BL/6J mice at 530 and 640/750 days of age

Affiliations
Comparative Study

Evaluating sex-specific responses to western diet across the lifespan: impact on cardiac function and transcriptomic signatures in C57BL/6J mice at 530 and 640/750 days of age

Ani Stepanyan et al. Cardiovasc Diabetol. .

Abstract

Background: Long-term consumption of Western Diet (WD) is a well-established risk factor for the development of cardiovascular disease (CVD); however, there is a paucity of studies on the long-term effects of WD on the pathophysiology of CVD and sex-specific responses.

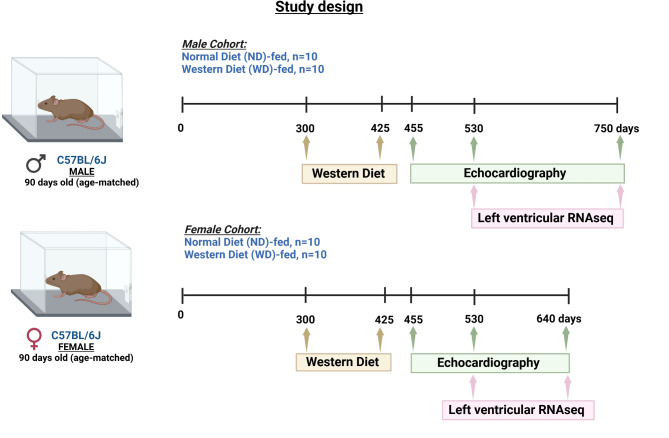
Methods: Our study aimed to investigate the sex-specific pathophysiological changes in left ventricular (LV) function using transthoracic echocardiography (ECHO) and LV tissue transcriptomics in WD-fed C57BL/6 J mice for 125 days, starting at the age of 300 through 425 days.

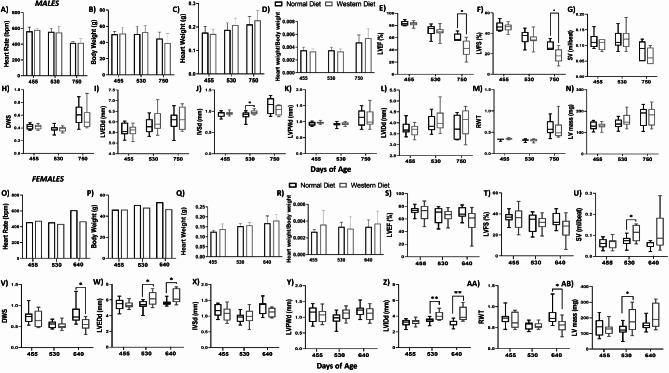
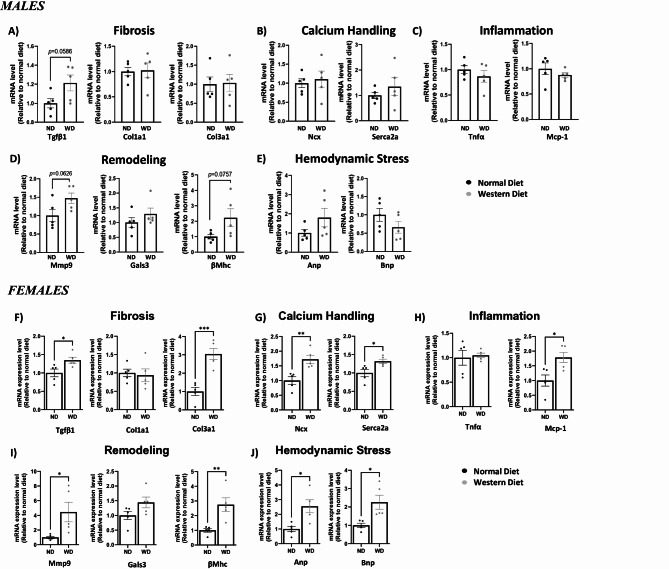
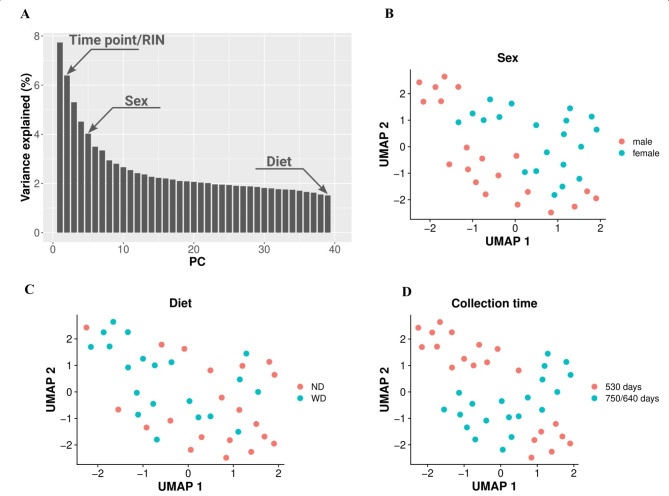
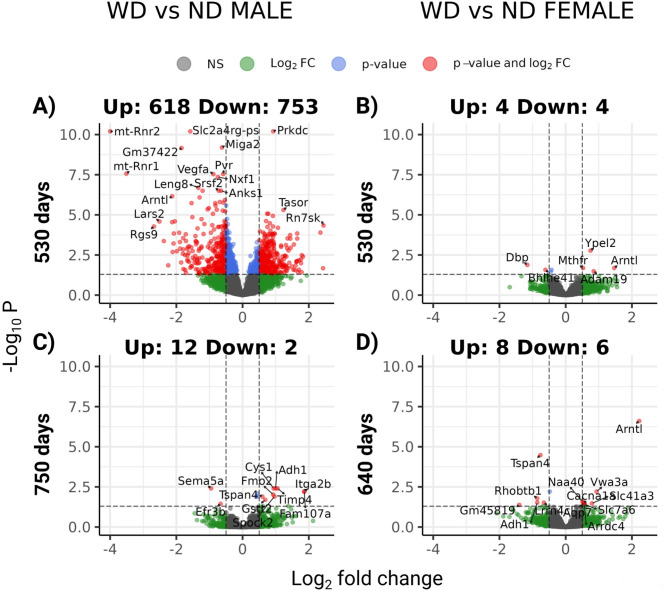
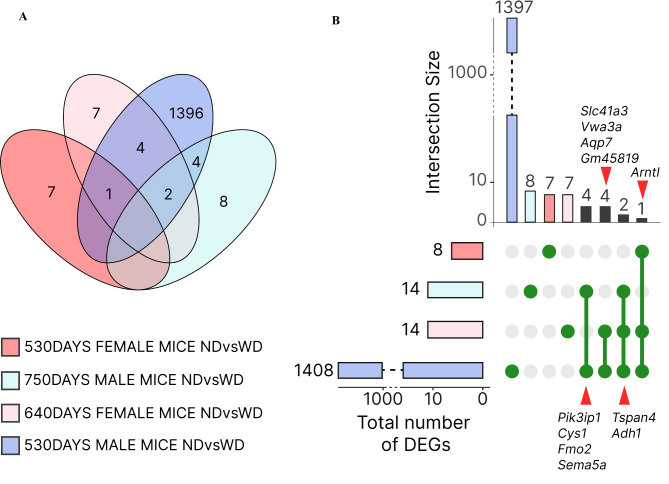
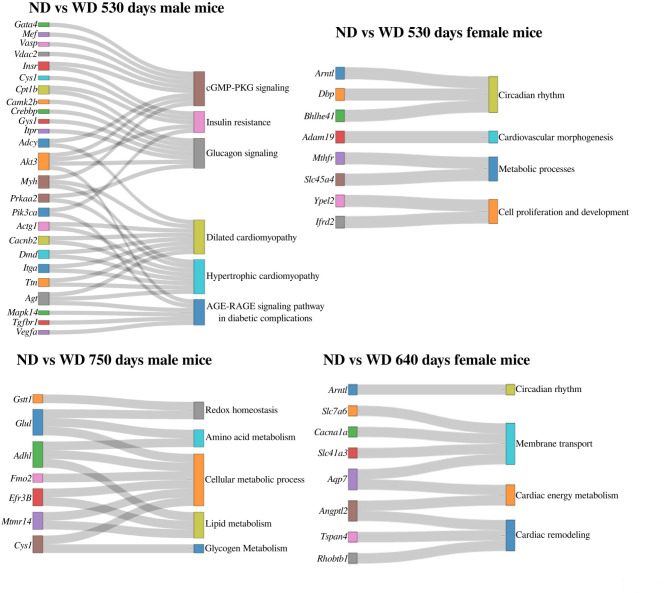
Results: In female mice, consumption of the WD diet showed long-term effects on LV structure and possible development of HFpEF-like phenotype with compensatory cardiac structural changes later in life. In male mice, ECHO revealed the development of an HFrEF-like phenotype later in life without detectable structural alterations. The transcriptomic profile revealed a sex-associated dichotomy in LV structure and function. Specifically, at 530-day, WD-fed male mice exhibited differentially expressed genes (DEGs), which were overrepresented in pathways associated with endocrine function, signal transduction, and cardiomyopathies. At 750 days, WD-fed male mice exhibited dysregulation of several genes involved in various lipid, glucagon, and glutathione metabolic pathways. At 530 days, WD-fed female mice exhibited the most distinctive set of DEGs with an abundance of genes related to circadian rhythms. At 640 days, altered DEGs in WD-fed female mice were associated with cardiac energy metabolism and remodeling.

Conclusions: Our study demonstrated distinct sex-specific and age-associated differences in cardiac structure, function, and transcriptome signature between WD-fed male and female mice.

Keywords: Cardiovascular; Heart; RNA sequencing; Sex; Western Diet.


Conflict of interest statement

Declarations. Ethics approval and consent to participate: All animal procedures were performed following the standards of the Guide for the Care and Use of Laboratory Animals for the National Institutes of Health and approved by the Animal Care and Use Committees at Brookhaven National Laboratory (BNL) (Upton, NY) (BNL IACUC Protocol #502) and the Icahn School of Medicine at Mount Sinai (NY, NY) (ISMMS IACUC Protocol #2019-0017). Consent for publication: Not applicable. Competing interests: The authors declare no competing interests.

Figures

Fig. 1
Fig. 1
Study design overview: timeline and methodology. Wild Type C57BL6/J male and female mice were fed normal (ND) or a western diet (WD) for 150 days (n = 10 mice in each group). Transthoracic echocardiography was performed on all mice at 455, 530, and 750/640 days. Bulk mRNA sequencing was performed on left ventricular cardiac tissue samples collected at 530 and 750 days for male mice (n = 5 mice in each group), and 530 and 640 days for female mice (n = 5 mice in each group)
Fig. 2
Fig. 2
Longitudinal echocardiography results in C57BL/6 J male and female mice fed with ND and WD. We assessed left ventricle (LV) function by transthoracic echocardiography (ECHO) at 455, 530, and 640/750 days. Normal diet (ND)-fed mice served as negative control. LV function and structure in male mice: (A) Heart rates were obtained during ECHO while mice were anesthetized using isoflurane (3% induction, 1–2% maintenance), (B) Mice body weights. (C) Heart weight (D) Heart weights/Body weight ratio. Left Ventricular (LV) function is represented by (E) ejection fraction, (F) fractional shortening, (G) stroke volume (SV), and (H) radial wall strain (DWS). Parameters of LV dimensions and remodeling are represented by (I) LV end diastolic diameter, (J) intraventricular septal thickness, (K) LV posterior wall thickness, (L) LV internal cavity diameter, (M) relative wall thickness, and (N) LV mass. N = 7–10 animals; p-values were calculated using unpaired t test. *p < 0.05. LV function and structure in female mice: (O) Heart rates, (P) Mice body weights. (Q) Heart weight (R) Heart weights/Body weight ratio. Left Ventricular (LV) function is represented by (S) ejection fraction, (T) fractional shortening, (U) stroke volume (SV), and (V) radial wall strain (DWS). Parameters of LV dimensions and remodeling are represented by (W) LV end diastolic diameter, (X) intraventricular septal thickness, (Y) LV posterior wall thickness, (Z) LV internal cavity diameter, (AA) relative wall thickness, and (BB) LV mass. N = 7–10 animals; p-values were calculated using unpaired t test. *p < 0.05
Fig. 3
Fig. 3
Gene expression analyses in LV tissue from male and female mice at 750/640 day fed with normal versus western diet. Gene expression was assessed for: A Cardiac fibrosis markers: Tgfβ1 (transforming growth factor beta 1), Col1a1 (type I fibrillar collagen), and Col3a1 (type III fibrillar collagen). B Calcium handling proteins: Ncx (cardiac sodium-calcium exchanger) and Serca2a (Sarcoplasmic Reticulum Ca2⁺ ATPase). C Inflammation markers: TNFα (tumor necrosis factor alpha) and MCP1 (monocyte chemoattractant protein-1). D Cardiac remodeling enzymes: Mmp9 (matrix metalloproteinase-9), Gals3 (galectin 3), and βMhc (cardiac beta myosin heavy chain). E) Hemodynamic stress hormones: Anp (atrial natriuretic peptide) and Bnp (brain natriuretic peptide). Expression levels were normalized to GAPDH. Data are presented as mean ± SEM. Each dot represents an individual mouse, with n = 5 animals per diet group. Statistical significance was assessed using an unpaired t-test, *p < 0.05, **p < 0.01, ***p < 0.001
Fig. 4
Fig. 4
Analysis of principal components and UMAP clustering of left ventricular mRNA expression data. A Elbow plot illustrating the variance percentages explained by each principal component. Annotated bars indicate the principal components that exhibit the most significant separation for the specified condition. BD Uniform manifold approximation and projection (UMAP) clustering of left ventricular mRNA expression data. Each dot represents a sample, with color coding corresponding to sex (B) (male/female; red/green), age (C) (530 and 750/640 days; red/green), and dietary regimen (D) (normal diet (ND)/western diet (WD); red/green)
Fig. 5
Fig. 5
Differentially expressed genes (DEGs) across study groups are represented as volcano plots. A 530 days normal diet (ND) vs western diet (WD) males, B 750 days ND vs WD males, (C) 530 days ND vs WD females, (D) 640 days ND vs WD females. Volcano plot of data with log base 2-transformed fold change values plotted on the X-axis and negative log10 p values plotted on the Y-axis, representing the significance level. The dotted horizontal line signifies p = 0.05 (-log10(1.3)). The two vertical lines correspond to a fold change of 2 (−2), with up-regulated and downregulated genes plotted on the right and left sides of these lines, respectively
Fig. 6
Fig. 6
Number of overlapping and unique differentially expressed genes (DEGs) between comparison groups. A The number of DEGs for each comparison, as well as overlapping DEGs between groups. B UpSet plot summarizes differentially expressed gene overlaps in four different comparisons (normal diet (ND) vs western diet (WD) for 530 days females; ND vs. WD for 750 days males; ND vs. WD 640 days females; ND vs. WD 530 days males). The horizontal bar graph at the bottom left, labeled 'Set Size', illustrates the total number of DEGs on the X-axis, categorized by each comparison on the Y-axis. The top vertical graph represents the intersection of gene sets. Each column corresponds to a specific comparison (first four columns), and instances where more than one comparison share the same DEGs are indicated by dots connected by lines below the X-axis
Fig. 7
Fig. 7
Top differentially regulated genes in the four comparison groups, along with the pathways and processes in which they are enriched. Four Sankey plots represent the following comparisons: normal diet (ND) vs western diet (WD) 530 days male mice, ND vs. WD 750 days male mice, ND vs. WD 530 days female mice, and ND vs. WD 640 days female mice. The left side illustrates the genes, which are linked to the corresponding processes and pathways on the right side

Similar articles

Cited by

References

    1. Tsao CW, Aday AW, Almarzooq ZI, Anderson CAM, Arora P, Avery CL, Baker-Smith CM, Beaton AZ, Boehme AK, Buxton AE, et al. Heart disease and stroke statistics-2023 update: a report from the american heart association. Circulation. 2023;147(8):e93–621. - PubMed
    1. Zhao Y, Li D, Huang T. Associations of dietary flavonoids and subclasses with total and cardiovascular mortality among 369,827 older people: the NIH-AARP Diet and Health Study. Atherosclerosis. 2023;365:1–8. - PubMed
    1. Said MA, Verweij N, van der Harst P. Associations of combined genetic and lifestyle risks with incident cardiovascular disease and diabetes in the UK biobank study. JAMA Cardiol. 2018;3(8):693–702. - PMC - PubMed
    1. Pazoki R, Dehghan A, Evangelou E, Warren H, Gao H, Caulfield M, Elliott P, Tzoulaki I. Genetic predisposition to high blood pressure and lifestyle factors: associations with midlife blood pressure levels and cardiovascular events. Circulation. 2018;137(7):653–61. - PubMed
    1. Charbonneau B, O’Connor HM, Wang AH, Liebow M, Thompson CA, Fredericksen ZS, Macon WR, Slager SL, Call TG, Habermann TM, et al. Trans fatty acid intake is associated with increased risk and n3 fatty acid intake with reduced risk of non-Hodgkin lymphoma. J Nutr. 2013;143(5):672–81. - PMC - PubMed

Publication types

MeSH terms