. 2024 Dec 28;23(1):282.
doi: 10.1186/s12943-024-02180-y.

THBS2 + cancer-associated fibroblasts promote EMT leading to oxaliplatin resistance via COL8A1-mediated PI3K/AKT activation in colorectal cancer

Affiliations

THBS2 + cancer-associated fibroblasts promote EMT leading to oxaliplatin resistance via COL8A1-mediated PI3K/AKT activation in colorectal cancer

Xing Zhou et al. Mol Cancer. .

Erratum in

Abstract

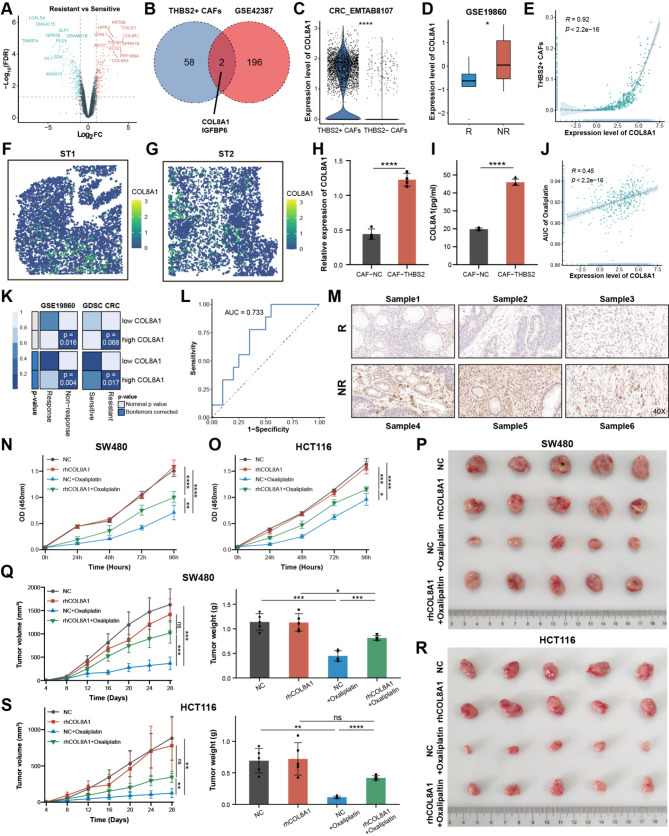
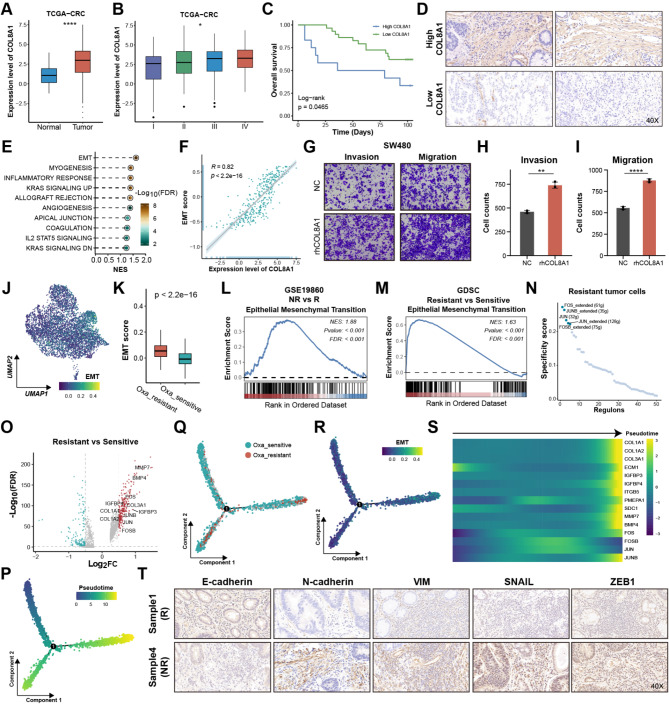
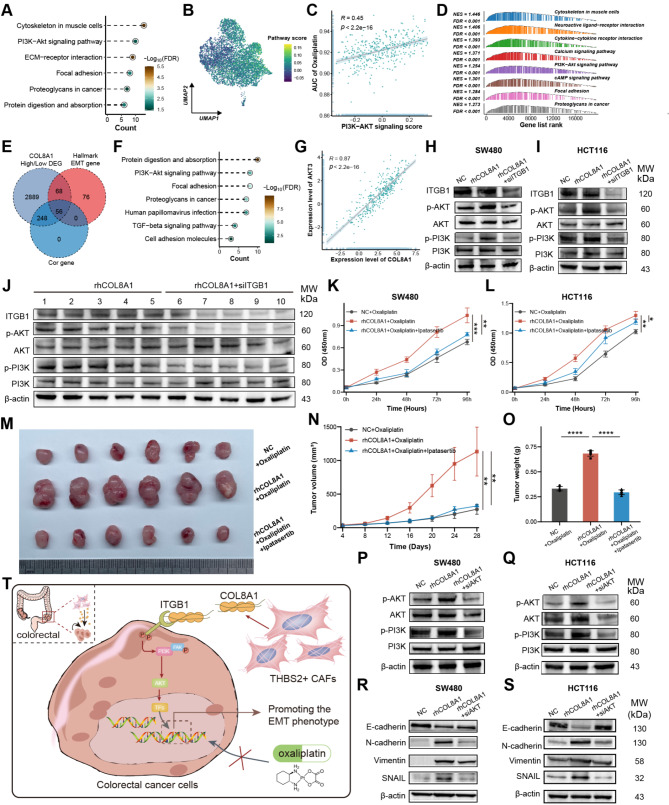
Cancer-associated fibroblasts (CAFs) exert multiple tumor-promoting functions and are key contributors to drug resistance. The mechanisms by which specific subsets of CAFs facilitate oxaliplatin resistance in colorectal cancer (CRC) have not been fully explored. This study found that THBS2 is positively associated with CAF activation, epithelial-mesenchymal transition (EMT), and chemoresistance at the pan-cancer level. Together with single-cell RNA sequencing and spatial transcriptomics analyses, we identified THBS2 specifically derived from subsets of CAFs, termed THBS2 + CAFs, which could promote oxaliplatin resistance by interacting with malignant cells via the collagen pathway in CRC. Mechanistically, COL8A1 specifically secreted from THBS2 + CAFs directly interacts with the ITGB1 receptor on resistant malignant cells, activating the PI3K-AKT signaling pathway and promoting EMT, ultimately leading to oxaliplatin resistance in CRC. Moreover, elevated COL8A1 promotes EMT and contributes to CRC oxaliplatin resistance, which can be mitigated by ITGB1 knockdown or AKT inhibitor. Collectively, these results highlight the crucial role of THBS2 + CAFs in promoting oxaliplatin resistance of CRC by activating EMT and provide a rationale for a novel strategy to overcome oxaliplatin resistance in CRC.

Keywords: COL8A1; Cancer-associated fibroblasts; Colorectal cancer; EMT; Oxaliplatin resistance.


Conflict of interest statement

Declarations. Consent for publication: All authors have consented to submit this article for publication. Competing interests: The authors declare no competing interests.

Figures

Fig. 1
Fig. 1
THBS gene family is generally upregulated and significantly associated with disease progression in pan-cancer. (A-B) The number of TCGA and GTEx samples applied in this study, respectively. (C) The mRNA expression differences between normal and tumor samples. (D-F) The mRNA expression differences in distinct stages of CRC, BLCA, and THCA, respectively. (G) The correlation of THBS family genes and OS in TCGA using the log-rank test. Genes with p < 0.05 and HR > 1 were considered risky, while those with p < 0.05 and HR < 1 were considered protective. (H) The number of normal and tumor samples in CPTAC applied in this study. (I) The protein expression differences between normal and cancer samples. (J) The protein expression differences in distinct stages of COAD. (K-L) The Spearman correlation between mRNA expression and methylation and CNV, respectively. Blue points represent negative correlation and red points represent positive correlation. (M) Mutation frequency of THBS family genes in 32 cancers. Numbers represent the number of samples with the corresponding mutated gene for a given cancer. ‘0’ indicates no mutation in the gene coding region, and the absence of a number indicates no mutation in any region of the gene. (N) SNV oncoplot showing the mutation distribution of THBS family genes and the classification of SNV types. ns, not significant, *p < 0.05, **p < 0.01, ***p < 0.001, ****p < 0.0001
Fig. 2
Fig. 2
THBS2 facilitated CAF activation and EMT phenotype. (A) The Spearman correlation of THBS family mRNA expression and stromal score calculated by ESTIMATE algorithm in TCGA. (B) The Spearman correlation of THBS family mRNA expression and CAFs abundance deconvoluted by EPIC and MCP-counter algorithms in TCGA. (C) The difference in THBS2 mRNA expression among distinct TME subtypes derived from Bagaev et al. (D) The six immune subtypes derived from Bagaev et al. distribution in the high-THBS2 group and low-THBS2 group. The Chi-square test was used and the samples were divided into a high-THBS2 group and a low-THBS2 group based on the median THBS2 mRNA expression. (E) The Spearman correlation of THBS family mRNA expression and Hallmark pathway activity calculated by the gene set variation analysis (GSVA) algorithm in TCGA. (F) The Pearson correlation of THBS family mRNA expression and EMT score calculated by GSVA algorithm in TCGA. (G) The Spearman correlation of THBS2 protein expression and CAFs and EMT scores derived from the CPTAC database. (H) UMAP plot of the identified cell types. Different colors represented the different cell types. (I-J) UMAP plot of the identified cells colored by THBS2 expression and the EMT score calculated by AddMouduleScore function, respectively. (K) Assignment of cell subtypes and their spatial distributions inferred by the CellTrek algorithm in CRC ST sample. (L-M) The expression of THBS2 and EMT score calculated by AddMouduleScore function based on ST of CRC, respectively. (N) The Spearman correlation of THBS2 mRNA expression and EMT score calculated by GSVA algorithm for each cancer type in TCGA. (O) The Spearman correlation of THBS2 mRNA expression and drug AUC derived from GDSC and CTRP for each cancer type in TCGA. The chemotherapeutic drug AUC values for each sample were predicted by pRRophetic algorithm. (P) The Spearman correlation of median THBS2 mRNA expression and median AUC of oxaliplatin across the cancer types in TCGA. The oxaliplatin AUC value for each sample was predicted by pRRophetic algorithm. (Q) The Spearman correlation of THBS2 mRNA expression and AUC of oxaliplatin for each cancer type. The oxaliplatin AUC value for each sample was predicted by pRRophetic algorithm. Points colored by red represented p < 2.2e-16
Fig. 3
Fig. 3
THBS2 + CAFs were associated with oxaliplatin resistance in CRC. (A) Representative images of IHC staining for THBS2, α-SMA and FAP in responder (R) group and non-responder (NR) group. (B) Representative images of mIF for THBS2 and α-SMA. (C) UMAP plot of the distinct CAFs subtypes identified by THBS2 expression level. Different colors represented the different subtypes. (D) UMAP plot showing THBS2 expression across different CAFs subtypes. (E) Kaplan–Meier curve of OS between high and low THBS2 + CAFs abundance deconvoluted by CIBERSORTx algorithm in TGCA-CRC. (F) Gene set enrichment analysis (GSEA) analysis showing EMT pathway was upregulated in high THBS2 + CAFs abundance subgroup. (G) The Spearman correlation of THBS2 + CAFs abundance and AUC of oxaliplatin in TCGA-CRC. The oxaliplatin AUC value for each sample in TCGA-CRC was predicted by pRRophetic algorithm. (H) SubMap algorithm evaluated the expression similarity and the chemotherapy response between TCGA-CRC and GSE19860 treated with mFOLFOX6 and GDSC CRC cell lines treated with oxaliplatin. (I) Number of interactions from THBS2 + CAFs to other cells inferred by CellChat algorithm. (J) Chord diagram showing the cell-cell interaction pathways among THBS2 + CAFs, THBS2- CAFs, and malignant cells inferred by CellChat algorithm. (K) The difference in collagen formation score calculated by AddMouduleScore function between THBS2 + CAFs and THBS2- CAFs. (L) UMAP plot of the distinct malignant cell subtypes identified via the Scissor algorithm. Different colors represented the different subtypes. (M) The counts of ligand-receptor interactions from CAFs subtypes to malignant cell subtypes inferred by CellChat algorithm. (N) Number of interactions from CAFs subtypes to malignant cell subtypes inferred by CellChat algorithm. (O) Chord diagram showing the cell-cell interaction pathways among CAFs subtypes and malignant cell subtypes inferred by CellChat algorithm. (P) The difference in integrin cell surface interaction score calculated by AddMouduleScore function between the resistant and sensitive subtype. (Q) Spatial cell charting of resistant malignant cells and THBS2 + CAFs using CellTrek algorithm. (R-T) Representative images of subcutaneous xenografts from SW480 cells mixed with CAF-THBS2 or combined with oxaliplatin treatment. Tumor weight and tumor volume were measured after implantation. **p < 0.01, ***p < 0.001, ****p < 0.0001
Fig. 4
Fig. 4
COL8A1 derived from THBS2 + CAFs facilitated oxaliplatin resistance in CRC. (A) Volcano plot showing the DEGs between resistant and sensitive cells in GSE42387. Those with log2FC > 1 and FDR < 0.05 were considered upregulated colored by red, while those with log2FC < -1 and FDR < 0.05 were considered downregulated colored by blue. (B) Venn-diagram intersected THBS2 + CAFs marker genes calculated by FindMarkers function and upregulated DEGs in oxaliplatin-resistant CRC cells. Genes with FDR < 0.05 and log2FC > 1 in THBS2 + CAFs were considered marker genes. (C) Violin plot showing COL8A1 expression level across different CAF subtypes. (D) The difference in COL8A1 expression between non-response (NR) and response (R) group in GSE19860. (E) The Spearman correlation of COL8A1 expression and THBS2 + CAFs abundance deconvoluted by CIBERSORTx algorithm in TCGA-CRC. (F-G) The expression level of COL8A1 based on ST analysis. (H) qPCR analysis of COL8A1 mRNA levels in CAF-THBS2 and CAF-NC. (I) ELISA quantification of COL8A1 levels in the supernatant of CAF-THBS2 and CAF-NC cultures. (J) The Spearman correlation of COL8A1 expression and AUC of oxaliplatin in TCGA-CRC. The oxaliplatin AUC value for each sample in TCGA-CRC was predicted by pRRophetic algorithm. (K) SubMap algorithm evaluated the expression similarity and the chemotherapy response between TCGA-CRC and GSE19860 treated with mFOLFOX6, and GDSC CRC cell lines treated with oxaliplatin. (L) ROC curve showing COL8A1 expression level predicting response efficiency to oxaliplatin-based chemotherapy. (M) Representative images of IHC staining for COL8A1 in responder (R) and non-responder (NR) groups. (N-O) The CCK8 assay compared the proliferation rates of CRC cells treated with oxaliplatin alone or combined with rhCOL8A1. (P-Q) Representative images of subcutaneous xenografts from SW480 cells treated with rhCOL8A1 alone or combined with oxaliplatin. Tumor weight and tumor volume were measured after implantation. (R-S) Representative images of subcutaneous xenografts from HCT116 cells treated with rhCOL8A1 alone or combined with oxaliplatin. Tumor weight and tumor volume were measured after implantation. ns, not significant, *p < 0.05, **p < 0.01, ***p < 0.001, ****p < 0.0001
Fig. 5
Fig. 5
COL8A1 activated EMT leading to oxaliplatin resistance in CRC. (A) The difference in COL8A1 expression between tumor and normal samples in TCGA-CRC. (B) The difference in COL8A1 expression across distinct stages in TCGA-CRC. (C) Kaplan-Meier curve of OS between high and low COL8A1 expression using clinical samples. (D) Representative images of IHC staining for COL8A1 in high COL8A1 group and low COL8A1 group. (E) GSEA showing pathway activity in high and low COL8A1 groups in TCGA-CRC. (F) The Spearman correlation of COL8A1 expression and EMT score calculated by GSVA in TCGA-CRC. (G-I) Representative data from invasion and migration assays performed in SW480 cells treated with rhCOL8A1 or NC. (J) UMAP plot of EMT score calculated by AddMouduleScore function in malignant cells. (K) The difference in EMT score calculated by AddMouduleScore function between oxaliplatin-resistant and sensitive cells at the single cell level. (L-M) GSEA showing the EMT signaling pathway was upregulated in the NR group of GSE19860 and oxaliplatin-resistant CRC cell lines of GDSC, respectively. (N) Identification of activated TFs in oxaliplatin-resistant cells using the SCENIC algorithm. (O) DEGs between oxaliplatin-resistant and sensitive cells at the single-cell level. Genes with FDR < 0.05 were considered significant. Those with log2FC > 0.5 were considered upregulated genes colored by red, while Those with log2FC < -0.5 were considered downregulated genes colored by blue. (P-R) Temporal analysis of the acquired resistance in malignant cells colored by Pseudotime, malignant cell subclusters, and EMT score using Monocle 2 algorithm. (S) Temporal increase in the expression of TFs and other genes associated with the EMT using Monocle 2 algorithm. (T) Representative images of IHC staining for E-cadherin, N-cadherin, VIM, ZEB1 and SNAIL in responder (R) group and non-responder (NR) group. *p < 0.05, **p < 0.01, ***p < 0.001, ****p < 0.0001
Fig. 6
Fig. 6
COL8A1 interacting with ITGB1 contributed to oxaliplatin resistance. (A) Interactions between THBS2 + CAFs and resistant malignant cells inferred by CellChat algorithm. (B) Visualization of COL8A1-ITGB1 interaction for ST data. (C) The difference in ITGB1 expression between resistant and sensitive malignant cells at the single-cell level. (D-E) The Spearman correlation of ITGB1 expression and resistant cell abundance deconvoluted by CIBERSORTx and AUC of oxaliplatin in TCGA-CRC, respectively. The oxaliplatin AUC value for each sample in TCGA-CRC was predicted by pRRophetic algorithm. (F) The Spearman correlation of ITGB1 expression and activity of oxaliplatin in CellMiner database. (G) The Spearman correlation of COL8A1 expression and ITGB1 expression in TCGA-CRC. (H) Representative images of IHC staining for ITGB1 in responder (R) group and non-responder (NR) group. (I) Molecular dynamics simulation of the COL8A1-ITGB1 complex, with structural visualization of key interacting residues. (J) Quantitative analysis of the COL8A1-ITGB1 complex stability over a 100-nanosecond simulation, showing Root Mean Square Deviation (RMSD), Radius of Gyration (Rg), and Buried Surface Area (SASA) values. (K) Co-IP demonstrated the protein interaction between COL8A1 and ITGB1 in CRC cells. (L) SubMap algorithm evaluated the similarity and the chemotherapy response between TCGA-CRC and GSE19860 treated with mFOLFOX6, and GDSC CRC cell lines treated with oxaliplatin. COL8A1-ITGB1 score was calculated based on the average ligand and receptor expression. (M-N) The CCK8 assay compared the proliferation rates of CRC cells treated with oxaliplatin plus rhCOL8A1 or combined with siITGB1. (O-Q) Representative images of subcutaneous xenografts from CRC cells treated with rhCOL8A1 alone or combined with oxaliplatin. Tumor weight and tumor volume were measured after implantation. (R-S) Western blotting showing EMT markers levels in CRC cells treated with rhCOL8A1 or combined with siITGB1. **p < 0.01, ***p < 0.001, ****p < 0.0001
Fig. 7
Fig. 7
COL8A1 interfered with PI3K-AKT signaling promoting oxaliplatin resistance. (A) The KEGG analysis of DEGs between malignant resistant cells and sensitive cells calculated by FindMarkers function at the single-cell level. (B) UMAP plot of PI3K-AKT pathway score calculated by AddMouduleScore function in malignant cells. (C) The Spearman correlation of PI3K-AKT pathway score calculated by GSVA algorithm and AUC of oxaliplatin in TCGA-CRC. The oxaliplatin AUC value for each sample in TCGA-CRC was predicted by the pRRophetic algorithm. (D) GSEA showing PI3K-AKT pathway was upregulated in the high COL8A1 group of TCGA-CRC. (E) Venn-diagram intersected DEGs between high and low COL8A1 group, Hallmark EMT genes and genes correlated with COL8A1 greater than 0.8. (F) The KEGG analysis of 56 intersected genes. (G) The Spearman correlation of AKT3 expression and COL8A1 expression in TCGA-CRC. (H-I) Western blotting showing PI3K-AKT pathway activity in CRC cells treated with rhCOL8A1 or combined with siITGB1. (J) Western blotting showing PI3K-AKT pathway activity treated with rhCOL8A1 or combined with siITGB1 in subcutaneous xenograft mouse model. (K-L) The CCK8 assay compared the proliferation rates of CRC cells treated with oxaliplatin plus rhCOL8A1 or combined with AKT inhibitor Ipatasertib. (M-O) Representative images of subcutaneous xenografts from SW480 cells treated with rhCOL8A1 alone or combined with AKT inhibitor Ipatasertib. Tumor weight and tumor volume were measured after implantation. (P-Q) Western blotting showing PI3K-AKT pathway activity in CRC cells treated with rhCOL8A1 or combined with siAKT. (R-S) Western blotting showing EMT markers levels in CRC cells treated with rhCOL8A1 or combined with siAKT. (T) Schematic representation of the suggested mechanism by which COL8A1 mediates cancer cell survival and tumor progression

References

    1. Morgan E, et al. Global burden of colorectal cancer in 2020 and 2040: incidence and mortality estimates from GLOBOCAN. Gut. 2023;72(2):338–44. 10.1136/gutjnl-2022-327736. - PubMed
    1. Xie Y-H, Chen Y-X, Fang J-Y. Comprehensive review of targeted therapy for colorectal cancer. Signal Transduct Target Therapy. 2020;5(1). 10.1038/s41392-020-0116-z. - PMC - PubMed
    1. de Gramont A, et al. Reintroduction of oxaliplatin is Associated with Improved Survival in Advanced Colorectal Cancer. J Clin Oncol. 2007;25(22):3224–9. 10.1200/jco.2006.10.4380. - PubMed
    1. Piccart MJ, et al. Oxaliplatin or paclitaxel in patients with platinum-pretreated advanced ovarian cancer: a randomized phase II study of the European Organization for Research and Treatment of Cancer Gynecology Group. J Clin Oncol. 2000;18(6):1193–202. 10.1200/JCO.2000.18.6.1193. - PubMed
    1. Montagnani F, et al. Effectiveness and safety of oxaliplatin compared to cisplatin for advanced, unresectable gastric cancer: a systematic review and meta-analysis. Gastric Cancer. 2011;14(1):50–5. 10.1007/s10120-011-0007-7. - PubMed

MeSH terms

LinkOut - more resources