. 2024 Dec 28;14(1):31248.
doi: 10.1038/s41598-024-82646-7.

Assessing COVID-19 transmission through school and family networks using population-level registry data from the Netherlands

Affiliations

Assessing COVID-19 transmission through school and family networks using population-level registry data from the Netherlands

Javier Garcia-Bernardo et al. Sci Rep. .

Abstract

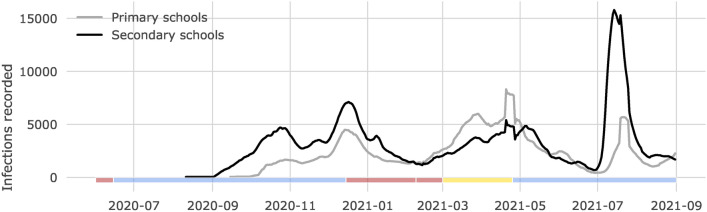
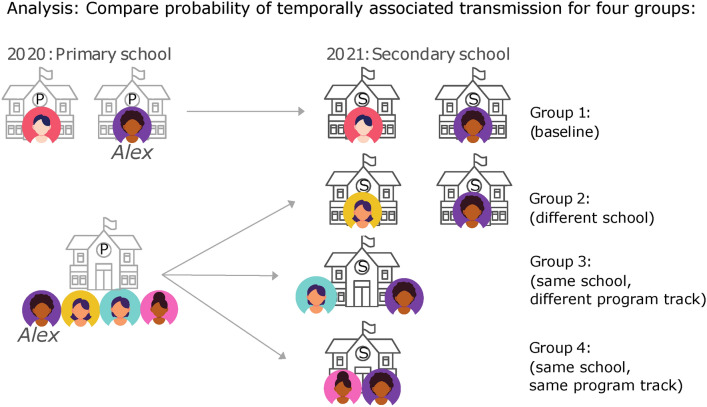
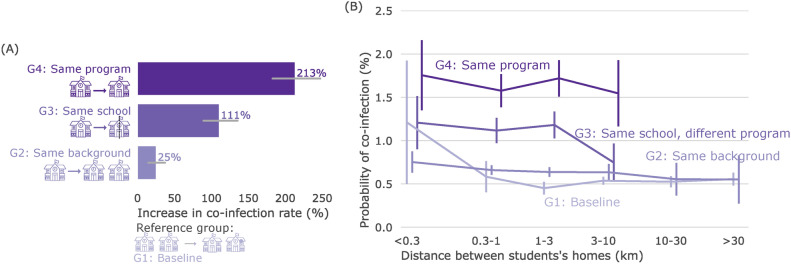
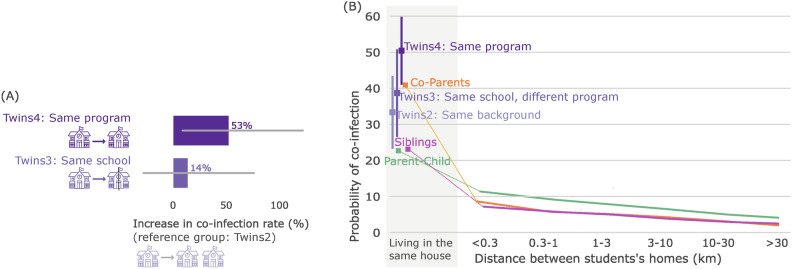
Understanding the impact of different types of social interactions is key to improving epidemic models. Here, we use extensive registry data-including PCR test results and population-level networks-to investigate the impact of school, family, and other social contacts on SARS-CoV-2 transmission in the Netherlands (June 2020-October 2021). We isolate and compare different contexts of potential SARS-CoV-2 transmission by matching pairs of students based on their attendance at the same or different primary school (in 2020) and secondary school (in 2021) and their geographic proximity. We then calculate the probability of temporally associated infections-i.e. the probability of both students testing positive within a 14-day period. Our results highlight the relative importance of household and family transmission in the spread of SARS-CoV-2 compared to school settings. The probability of temporally associated infections for siblings and parent-child pairs living in the same household ranged from 22.6-23.2%. Interestingly, a high probability (4.7-7.9%) was found even when family members lived in different households, underscoring the persistent risk of transmission within family networks. In contrast, the probability of temporally associated infections was 0.52% for pairs of students living nearby but not attending the same primary or secondary school, 0.66% for pairs attending different secondary schools but having attended the same primary school, and 1.65% for pairs attending the same secondary school. It is worth noting, however, that even small increases in school-related infection probabilities can trigger large-scale outbreaks due to the dense network of interactions in these settings. Finally, we used multilevel regression analyses to examine how individual, school, and geographic factors contribute to transmission risk. We found that the largest differences in transmission probabilities were due to unobserved individual (60%) and school-level (35%) factors. Only a small proportion (3%) could be attributed to geographic proximity of students or to school size, denomination, or the median income of the school area.

Keywords: COVID-19; Family networks; Registry data; School networks; Transmission dynamics.


Conflict of interest statement

Declarations. Ethical statement: Data is collected by Statistics Netherlands (CBS) and the National Institute for Public Health and the Environment (RIVM), and made available to researchers for well-defined projects and statistical analysis. Researchers need to be pre-approved before accessing the data, and all data is pseudoanomyzied, and available in a secure research environment. The data is safeguarded under the stringent privacy regulations set by the Statistics Netherlands Act (“Wet op het Centraal bureau voor de statistiek”) and the European Union’s General Data Protection Regulation, guaranteeing that individual personal information is not revealed during the analysis. All methods were carried out in accordance with relevant guidelines and regulations. Competing interests: The authors declare no competing interests. Declaration of generative AI and AI-assisted technologies in the writing process: During the preparation of this work the author(s) used https://www.deepl.com/write for copyediting and to improve readability. After using this tool/service, the author(s) reviewed and edited the content as needed and take(s) full responsibility for the content of the publication.

Figures

Fig. 1
Fig. 1
Number of SARS-CoV-2 infections. Infections are measured by the municipal health services using PCR-tests, and displayed for students attending primary (gray line) and secondary schools (black line), aggregated per week (using a rolling window) over the time studied. To preserve the privacy of those individuals and in line with CBS regulations, only weeks with at least 10 cases are shown. School closures are shown at the bottom of the figure. Time periods where secondary schools were closed are marked in red: June 1st–15th (2020) and December 15th (2020)–March 1st (2021). Time periods where secondary schools were open are marked in yellow (open with restrictions, March 1st–April 26th (2021) and blue (open without restrictions). Primary schools were open from February 8th–March 1st (2021).
Fig. 2
Fig. 2
Illustration of the different types of student pairs, with increasing level of expected contact. Each student in the data is paired with different type of students. The example shows the process for one student named Alex. Group 1: Students who attend a different primary school than Alex and a different secondary school. Group 2: Students who attend the same primary school than Alex and a different secondary school. Group 3: Students who attend the same primary and secondary school than Alex, but are placed in a different program track in the secondary school. Group 4: Students who attend the same primary and secondary school than Alex, and are placed in the same program track in the secondary school.
Fig. 3
Fig. 3
Attending the same school increases the probability of temporally associated infection. (A) Increase in the probability of temporally associated infection, compared to the baseline (G1), for student pairs in the same program track (G4), same school but different program track (G3), and different school but same background (G2). Error bars indicate 95% confidence intervals. (B) Probability of temporally associated infection for the four different groups of student pairs, as a function of the distance between the student’s homes. Note the logarithmic horizontal axis and that the <0.3km distance bin excludes individuals living in the same household. Groups have slightly different horizontal offsets to avoid overlapping error bars.
Fig. 4
Fig. 4
Comparison of the probability of temporally infections in school and family networks. (A) Increase in temporally associated infection rate, compared to the baseline (Twins2: siblings attending a different school but having attended the same primary school), for twins in the same program (Twin4), and same school but different program track (Twins3). Error bars indicate 95% confidence intervals. (B) Probability of temporally associated infection as a function of the distance between the individual’s homes for twin pairs (purple), sibling pairs (magenta), parent-child pairs (green) and co-parents (orange). Groups have slightly different horizontal offsets to avoid overlapping error bars. Note the logarithmic horizontal axis. The grayed area correspond to pairs living in the same household and a break in the logarithmic axis.

Similar articles

References

    1. Bustamante-Castañeda, F., Caputo, J., Cruz-Pacheco, G., Knippel, A. & Mouatamide, F. Epidemic Model on a Network: Analysis and Applications to COVID-19. Physica A: Statistical Mechanics and its Applications. 564, 125520 (2021). - PMC - PubMed
    1. Prasse, B., Achterberg, M. A., Ma, L. & Van Mieghem, P. Network-Inference-Based Prediction of the COVID-19 Epidemic Outbreak in the Chinese Province Hubei. Applied Network Science. 5, 1–11 (2020). - PMC - PubMed
    1. Firth, J. A. et al. Using a Real-World Network to Model Localized COVID-19 Control Strategies. Nature Medicine. 26, 1616–1622 (2020). - PubMed
    1. Sanchez, F. et al. A Multilayer Network Model of Covid-19: Implications in Public Health Policy in Costa Rica. Epidemics. 39, 100577 (2022). - PMC - PubMed
    1. Cui, Y., Ni, S. & Shen, S. A network-based model to explore the role of testing in the epidemiological control of the COVID-19 pandemic. BMC Infectious Diseases. 21, 1–12 (2021). - PMC - PubMed